

International Journal of Digital Journalism(IJDJ)
ISSN: 3070-4014 | DOI: 10.33140/IJDJ


Research Article - (2025) Volume 1, Issue 1
Employment of Artificial Intelligence Tools in the Production of Graphs, Charts, and Mind Maps
Received Date: Aug 01, 2025 / Accepted Date: Aug 25, 2025 / Published Date: Sep 03, 2025
Copyright: ©2025 Ahmed Shaker Alalaq. This is an open-access article distributed under the terms of the Creative Commons Attribution License, which permits unrestricted use, distribution, and reproduction in any medium, provided the original author and source are credited.
Citation: Alalaq, A. S. (2025). Employment of Artificial Antelligence Tools in the Production of Graphs, Charts, and Mind Maps. Int J Digital Journalism, 1(1), 01-11.
Abstract
The use of artificial intelligence tools in creating charts, diagrams, and mind maps is among the most prominent applications of modern technology in fields such as education, business management, and data analysis. These tools enable users to produce accurate and fast visualizations of information, helping to simplify understanding, enhance analytical thinking, and speed up decision-making.
These tools rely on technologies like natural language processing, machine learning, and big data analytics. They can automatically transform raw text or data into visual charts, or suggest ways to organize information into mind maps that help structure and connect ideas.
Keywords
Artificial Intelligence, Data, Maps, Charts
Key Benefits of Using AI in this Domain Include:
• Reducing time and effort in preparing presentations and reports
• Providing smart insights and recommendations based on data analysis
• Supporting team collaboration through visual sharing tools
• Offering professional design options even for non-specialists
As AI technologies continue to evolve, these tools are expected to better understand complex contexts and generate more accurate and creative visual representations.
Introduction
In an era where the need to process massive amounts of data and convert it into understandable and analyzable information is grow¬ing, artificial intelligence (ai) tools have emerged as effective solu¬tions capable of addressing these challenges efficiently and quick¬ly. The production of graphs, charts, and mind maps is no longer merely a technical activity but has become an essential element in enhancing the quality of presentation and communication, en¬abling individuals and institutions to express ideas more clearly and creatively.
The importance of this topic lies in its foundation on the interaction between technology and the cognitive and practical needs of humans. It contributes to reshaping the way information is comprehended and presented within a visual framework that enhances perception and learning among users.
The core issue addressed by this study stems from a fundamental question regarding the extent to which these tools integrate with various educational and administrative contexts, and the degree to which they rely on precise standards in visually representing and organizing knowledge. The study also raises the issue of the gap between the available technical capabilities and the users' readiness to adopt and effectively employ these tools.
The scope of the study is limited to AI tools used for generating visual representations only. It does not include other AI applications such as machine translation or voice interaction. The study is restricted to the time period between [insert desired time period] and excludes tools that are still in internal development or closed testing phases.
Regarding the adopted methodology, this study uses the descriptive-analytical method to provide a detailed explanation of the most prominent AI tools used in the production of visualizations, charts, and mind maps, analyzing their features and areas of use. It also compares their functionalities in terms of efficiency and ease of use. Additionally, the study is supported by the case study method to highlight practical applications in educational and administrative environments.
Definition of Mind Maps and Graphical Representations
Creating graphs, charts, and mind maps is of great importance to researchers, as these tools enhance the understanding, retention, and communication of complex information. They serve as visual aids that help organize ideas and data, making it easier to analyze results and present them effectively.
Mind maps, also known as mental maps, are a visual technique used to organize thoughts and information around a specific topic. These maps are characterized by having a central idea in the middle, from which main and sub-ideas branch out. This structure facilitates understanding the relationships between different concepts. Colors, symbols, and images are often used to enhance visual memory, making mind maps an effective tool for learning and creative thinking [1].
Others define mind maps as powerful visual tools for organizing information and ideas. They come in different types to suit various purposes, each type differing in structure and offering unique advantages in how information is visualized and organized [2]. A mind map is essentially a diagram using a central keyword or phrase, with connected lines linking main ideas and details. Mind maps may include more than three levels (the center, main ideas, and details), although most follow this general model [1].
As for Graphs and Charts, they are graphical representations used to present data and information in a visual manner. The types of charts include:
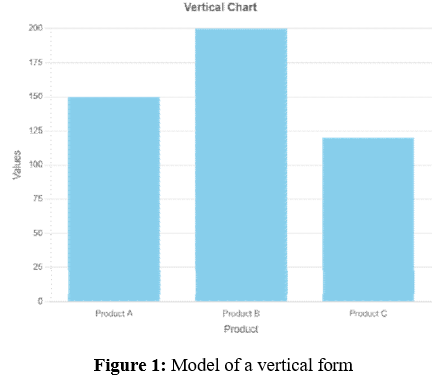
• Bar charts: Used to display data in the form of vertical or horizontal bars.
• Line charts: Show changes in data over time.
• Pie charts: Used to illustrate percentages as parts of a whole [3].
Graphs help simplify complex information, making it easier to understand and analyze (Al-Manara Center, n.d.). Therefore, it can be said that charts and diagrams are among the most effective tools for conveying scientific information, influencing decisions on the acceptance or rejection of manuscripts, and drawing the scientific community’s attention to research findings.
Graphical excellence is fundamentally defined by three main criteria:
• High information density — meaning the amount of information presented in each unit area of the graphic.
• Low ink-to-data ratio — which involves avoiding unnecessary shading, 3D effects, gridlines, and what is often referred to as “visual noise.”
• Clear axis labeling — ensuring that axes are labeled in a way that avoids ambiguity.
The Importance of Mind Maps and Graphical Tags
In today's fast-paced world, organizing and understanding com¬plex information has become increasingly important. Mind maps and graphical tags are powerful visual tools that help simplify ideas, improve memory retention, and enhance learning and com¬munication. By presenting information in a structured and visual format, these tools support better comprehension and allow indi¬viduals to see connections between concepts more clearly. This topic explores the key benefits of using mind maps and graphical representations, especially in educational and research settings.
• Cognitive Support: Mind maps support visual learners by structuring information in a way that enhances memory retention and understanding [4].
• Research Organization: They assist in organizing research processes, guiding decision-making, and clarifying the connections between various components of the study [5].
• Teaching Tool: Mind maps can be used in educational settings to teach complex concepts and facilitate collaborative learning among students [5].
• Enhancing Information Retention:
• Mind maps increase learners' ability to retain and recall information. Studies suggest that using mind maps can boost retention by up to 95% compared to traditional note-taking methods.
• The structure, colors, images, and illustrations in mind maps stimulate the brain and help maintain interest in the information being processed.
• The human brain processes emotions in the same area as it processes memories. Since recalling emotionally charged information is easier, and because mind mapping makes learning enjoyable and engaging, it improves memory and recall [6].
• Simplifying Complex Ideas: Mind maps help simplify complex information, making it easier to understand. By organizing ideas in a visual format, learners can see relationships between various concepts, enhancing their ability to grasp the content. Additionally, they help researchers reduce the amount of text needed when explaining material in educational or research contexts.
Types of Charts and Their Uses
Charts are among the most important visual tools used to present and interpret data in a clear and simple way. They help simplify complex information and highlight relationships and patterns between variables, making them effective tools in various fields such as education, business, and scientific research. Different types of charts are used depending on the nature of the data and the purpose of use, such as bar charts, line charts, pie charts, and others, each with specific features that make them suitable for different contexts.
• Bar Chart Use: Comparing quantities across separate categories Examples:
• Product sales
• Number of students by major
2. Line Chart Use: Tracking changes or trends over time Examples:
• Daily temperatures
• Monthly website visits

Figure 2: Line Chart
3. Pie Chart Use: Showing percentage proportions of categories that make up a whole Examples:
• Budget distribution
• Vote percentages in elections

Figure 3: Pie Chart
4. Scatter Plot Use: Displaying the relationship between two numerical variables Examples:
• Relationship between height and weight
• Age versus income
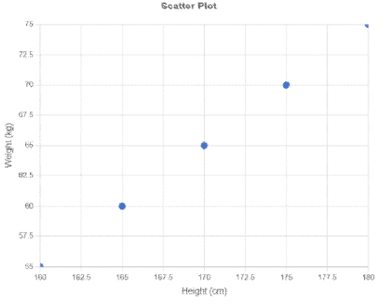
Figure 4: Scatter Plot
• Box Plot Use: Analyzing data distribution and outliers Examples:
• Employee performance evaluation
• Score distribution in a test

Figure 5: Box Plot
2. Horizontal Bar Chart Use: Same as the vertical bar chart, preferred when there are long names or many categories Examples:
• Ranking countries by GDP
• Number of books by author
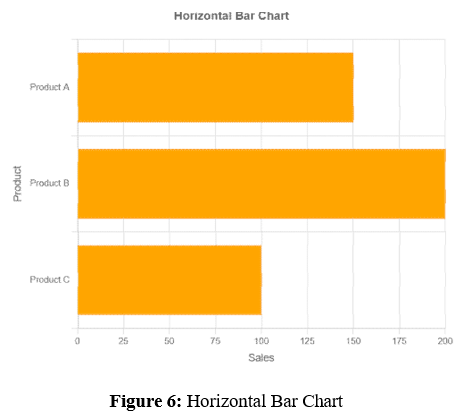
Figure 6: Horizontal Bar Chart
Types of Smart Mind Maps
Basic or Organizational Mind Map: The Basic Mind Map (Main Mind Map) is a powerful and effective tool for organizing research and facilitating its various stages. It is a central map that starts from a main idea and branches out into subtopics. It is used to clarify main ideas and their related branches. These maps help organize information logically, making it easy to understand and absorb [7].
Below are its targeted uses for researchers, summarized:
• Defining the research problem: Helps clearly identify the research problem and analyze its different dimensions.
• Formulating research questions and objectives: Organizes research questions and links them to hypotheses and general and specific objectives.
• Literature review: Organizes sources and references, linking them to subtopics, and compares different viewpoints in previous studies.
• Designing the methodological framework: Defines the methodology used, data collection tools, and research steps, clarifying variables and their relationships.
• Data analysis and research results: Organizes results and links them to the objectives and research questions.
• Preparation for presentations: Converts research content into clear visual points that highlight the main ideas without getting lost in details.

Figure 7: Basic or Organizational Mind Map
Tree Mind Map: The Tree Mind Map is an effective tool for researchers to organize ideas and information hierarchically and logically. It helps in analyzing and designing research in an easy-to-understand and visually structured manner. It follows a clear tree structure: root > branches > sub-branches, showing relationships between ideas or elements in a tree-like format. It begins with a main idea that branches into sub-ideas and related concepts. This type of mind map aids in understanding the hierarchical sequence of information and identifying relationships between different concepts. It can be used to organize knowledge, classify information, and analyze complex systems [8]. Among its most prominent uses are:
• Organizing systematic topics
• Analyzing decisions or process steps
• Organizing information hierarchically: helps the researcher arrange information from general to specific, facilitating understanding of the overall structure of the topic.
• In-depth analysis of ideas and problems: shows relationships between the main idea and sub-ideas.
• Identifying variables and relationships in research: useful in determining independent and dependent variables and influencing factors in quantitative or qualitative studies.
• Enhancing memory and comprehension: visual organization improves the researcher’s ability to remember and connect information [8].

Figure 8: Tree Mind Map
Hierarchical Map: The Hierarchical Map is a useful tool for researchers to organize and classify information hierarchical-ly, analyze relationships between elements, and clarify complex structures in an easy-to-understand visual manner. It shows rela-tionships between concepts according to a top-down hierarchical order.
• Explaining organizational sequences
• Displaying levels of thinking or concepts
• Classifying information by levels: helps the researcher organize information from the most general (top) to the most specific (bottom), facilitating the understanding of sequences and layers.
• Identifying relationships between elements: shows how main elements branch into subcategories, aiding in analyzing the relationships between them.
• Supporting systematic data analysis: useful in qualitative studies for classifying data into interconnected topics and categories.
• Enhancing visual understanding of complex relationships: helps simplify complex relationships between concepts or entities through clear visual representation.

Figure 9: Hierarchical Map
Concept Map (or Creative Map): The Concept Map is a powerful tool for researchers to organize and link concepts and analyze relationships between them. It is essential in building theoretical frameworks and analyzing qualitative data in a visual and logical way. It focuses on connecting different concepts through lines and directed relationships. It is used to aid creative thinking through various graphical elements such as images or colors, which stimulate imagination and free thinking. This type of map helps generate new ideas, solve problems innovatively, and develop creative concepts [9].
Some of its most prominent uses include:
• Comprehensive analysis of a complex topic
• Showing relationships between unordered ideas
• Linking concepts with logical relationships: helps the researcher connect different concepts through causal or descriptive relationships.
• Developing theoretical frameworks for research: used to build theoretical or conceptual frameworks by linking variables and influencing factors.
• Enhancing critical and creative thinking: encourages the researcher to explore new relationships between concepts and develop innovative explanatory models.

Figure 10: Concept Map
Target Mind Map: The Target Mind Map is a very powerful tool for researchers. It differs from other types by focusing primarily on achieving a specific goal, whether research-related or professional. The central goal is displayed in the middle, branching out into means and plans to achieve it [10]. Ideas appear at several linked levels, allowing for detailed organization of information. This type of map helps analyze complex systems, identify intertwined relationships, and understand fine details [8].
• Planning personal or professional goals
• Preparing a marketing plan
• Clearly defining goals: helps visually formulate main and sub-research objectives, facilitating understanding.
• Planning research stages: guides breaking down the big goal into smaller, manageable phases and tasks.
• Enhancing focus: keeps the researcher centered on the main goal and prevents distraction [11].

Figure 11: Target Mind Map
Timeline Map: A Timeline Map is a type of map that collects data by following a chronological sequence, making it useful for illustrating sequential processes and steps. This type of map helps track events, understand processes, and identify temporal relationships between different elements [12]. It can be used for process planning, documenting procedures, and project tracking.
Events or stages are arranged on a timeline with branches used to detail each phase. Some of its most prominent uses include [8]:
• Showing project development
• Historical sequencing of events
• Organizing the schedule for a study or work

Figure 12: Timeline Map
Decision Map: Used to display possible options and outcomes, often in the form of a decision tree. Some of its most prominent uses include:
• Making complex decisions
• Analyzing risks and outcomes
• Comparing alternatives

Figure 13: Decision Map
|
Tool Name |
Tool Type |
AI Usage |
Access Link |
|
MindMeister |
Mind Map |
Intelligent suggestions to automatically expand branches and ideas |
|
|
Whimsical AI |
Mind Map + Data Flow |
Generate maps and visual ideas from text commands |
|
|
Tldraw + GPT Plugin |
Free Drawing / Concept Maps |
Automatically converts text ideas into drawings (experimental) |
|
|
Taskade |
Mind Map + Tasks |
Automatic project and mind map structure suggestions |
|
|
XMind AI |
Professional Mind Map |
Automatically generates a map from a single idea |
|
|
Coggle AI |
Collaborative Mind Map |
Supports smart suggestions and automatic idea expansion |
|
|
Mindgrasp.ai |
Concept Maps from PDF Files |
Converts texts and lectures into concept maps automatically |
|
|
Lucidchart AI |
Diagrams and Flowcharts |
Converts text commands into diagrams and maps automatically |
|
|
Creately AI |
Mind Maps, Concept Maps + Charts |
Smart assistant for creating and designing dynamic concept maps |
|
|
Magical Mind (by Magical) |
Fast-Generated Mind Map |
Enter an idea and automatically create a full mind map |
|
|
Miro AI |
Smart Boards and Mind Maps |
Suggests ideas, creates maps from a single line |
|
|
FigJam AI (by Figma) |
Maps, UI Design, and Data |
Smart assistant for instant creation of visuals and ideas |
|
|
Venngage (Smart Templates) |
Graphs and Infographics |
Automatically suggests charts based on data type |
|
|
Visme AI |
Charts and Visual Reports |
Creates charts from text commands and automatic data analysis |
|
|
ChartGPT |
Charts from Text Commands |
Enter a description and it automatically generates a chart |
|
|
App.diagrams.net (w/ GPT Plugin) |
Flowcharts and Diagrams |
Integrates with ChatGPT for automatic diagram generation |
|
|
Mindomo |
Mind Map and Educational Tool |
Automatically generates ideas and expands content using AI |
Table 1: Key AI-Powered Tools for Creating Graphs and Mind Maps
|
Tool Name |
Analysis |
|
MindMeister |
Enables creating dynamic mind maps and uses AI to offer smart suggestions for branch expansion, benefiting researchers in brainstorming and structured thinking. Ideal for academic planning and projects. |
|
XMind AI |
A professional tool focusing on automatically generating mind maps from a single main idea. Used for research planning, literature review, and generating systematic classifications. |
|
Coggle AI |
A collaborative environment for creating mind maps, supporting AI for branch expansion and idea suggestions. Perfect for research teams and educational activities. |
|
Taskade |
Combines task management and mind mapping, suggesting automatic project structures. Useful for research planning or thesis writing. |
|
Magical Mind |
Known for high speed, generates a full mind map from just one idea input. Suitable for quick brainstorming and initial design. |
|
Mindomo |
Combines AI and education, automatically generating ideas based on user inputs. Especially aimed at students and teachers for curriculum preparation or research presentations. |
|
Mindgrasp.ai |
Unique specialization: converts PDFs or lectures into concept maps automatically. A powerful tool for researchers to analyze long texts and summarize studies. |
|
Whimsical AI |
Integrates mind maps with data flow diagrams and converts text commands into visuals. A multifunctional tool for complex projects combining planning and structuring. |
First: AI-Powered Mind Mapping Tools
|
Tool Name |
Analysis |
|
Lucidchart AI |
A powerful tool for flowcharts and diagrams that automatically converts text commands into visuals. Important for explaining methodologies or designing research processes. |
|
Creately AI |
Supports concept maps and organizational charts with an intelligent assistant to design complex layouts interactively. Excellent for analyzing relationships between concepts. |
|
Venngage (Smart Templates) |
Enables creating charts based on data types, with smart template suggestions automatically. Suitable for easily visualizing research results. |
|
Visme AI |
Combines design and data analysis, converting text commands into visuals and providing graphical analysis. Effective for preparing presentations. |
|
ChartGPT |
Allows creating charts directly from natural language text commands. Easy to use and suitable for non- designers. |
|
App.diagrams.net + GPT Plugin |
Flexible flowchart tool integrated with GPT for automatic diagram generation. Excellent for building research process maps or theoretical models. |
|
FigJam AI |
Focuses on interactive idea design and visual graphics, including models and mind maps. Useful for design teams and collaborative research. |
|
Tldraw + GPT Plugin |
AI-based freehand drawing platform that converts text into concept diagrams, suitable for unconventional research idea designs. |
|
Miro AI |
Collaborative tool for creating mind maps and smart workboards. Suggests ideas and converts commands into maps directly, ideal for group brainstorming sessions. |
Second: AI-Powered Charting and Flowchart Tools
|
Usage Field |
Most Suitable Tools |
|
Mind Mapping for Individual Researchers |
XMind AI – MindMeister – Magical Mind |
|
Collaborative Research |
Miro AI – Coggle AI – Whimsical AI |
|
Text Analysis and Conversion to Maps |
Mindgrasp.ai – Mindomo |
|
Designing Analytical and Chart Diagrams |
Lucidchart – Creately – Visme – ChartGPT |
|
Interactive Text Commands for Creating Visuals |
Tldraw – App.diagrams.net – FigJam – Venngage |
Third: Specific Fields of Use
The smart tools listed in the table above highlight how researchers can enhance the efficiency of their work by selecting the appropriate tool according to the specific field of use. For individual work, tools like XMind AI and MindMeister stand out as effective means to organize and structure ideas into clear mind maps. In collaborative contexts, tools such as Miro AI and Whimsical AI provide an interactive environment that supports joint thinking and flexible idea exchange [13].
In the field of text analysis and converting it into concept maps, tools like Mindgrasp.ai and Mindomo are ideal choices for extracting meanings and organizing complex information. Meanwhile, tools like Lucidchart and ChartGPT meet researchers' needs for designing precise and visually clear charts and analytical diagrams [14]. Interaction with text commands to create visual graphics has become easier thanks to tools like Tldraw and FigJam, which combine creativity with ease of use.
Overall, this diversity enhances the researcher’s ability to utilize AI tools in line with the type of research task, contributing to improving output quality while reducing the time and effort required.
Conclusion
In conclusion, the use of artificial intelligence tools in generating graphs, charts, and mind maps represents a transformative advancement in the fields of research and knowledge organization [15]. These tools have made it easier for researchers, students, and professionals to convert complex ideas into clear, structured visual formats that aid in faster and more precise understanding of information. AI also enhances users’ ability to interact creatively and effectively with data and text, contributing to improved outcomes while saving time and effort. Therefore, relying on these modern technologies is a necessary step to keep pace with scientific progress and achieve excellence in research and education. Moreover, artificial intelligence tools offer advanced capabilities such as prediction and intelligent data analysis, which support decision-making based on accurate and well-studied information. They also facilitate collaborative work among research teams through shared platforms that combine collective thinking with systematic organization of ideas, thereby boosting productivity and encouraging innovation. As these technologies continue to evolve, research and education fields are expected to see further advancements in how information is presented and organized— enhancing researchers’ and students’ abilities to face future challenges with advanced skills and smart tools. Therefore, understanding and applying these tools becomes a strategic necessity for achieving excellence and success across various academic and professional domains.
References
- Alalaq, A. S. (2025). The Oxford Insights Government AI Readiness Index (GARI): An Analysis of its Data and Overcoming Obstacles, with a Case Study of Iraq. arXiv preprint arXiv:2503.20833.
- Alalaq, A. S. (2024). E-Learning: A Communication Style Between Students and Instructors A Study of Its Nature, Negative and Positive Effects. Innovative Journal of Applied Science, 6-6.
- Alalaq, A. S. (2024). Creating Publishing Accounts for University Professors on Global Scientific Websites (ORCID, Research Gate, Google Scholar). arXiv preprint arXiv:2408.08936.
- Chiou, R., Branzi, F. M., Krieger-Redwood, K., & Jefferies,E. (2024). Dissecting the neuroanatomy of creativity and curiosity: The subdivisions within networks matter. Behavioral & Brain Sciences.
- Eppler, M. J. (2006). A comparison between concept maps, mind maps, conceptual diagrams, and visual metaphors as complementary tools for knowledge construction and sharing. Information visualization, 5(3), 202-210.
- Kotciuba, I., & Shikov, A. (2019). Methods of didactic design in e-learning sphere based on mind maps. In Energy Management of Municipal Transportation Facilities and Transport (pp. 83-97). Cham: Springer International Publishing.
- Kutak, D., Dolezal, M., Kerous, B., Eichler, Z., Vašek, J., & Liarokapis, F. (2019). An interactive and multimodal virtual mind map for future workplace. Frontiers in ICT, 6, 14.
- Llorach Masip, M. J. (2023). The Use of Mind Maps in Education. Journal of Parents and Teachers, (393), 37–41.
- Lori, L. (2022). Matria in contemporary Somali literature in Italian: Mapping articulations of female solidarity and resistance. Nordic Journal of African Studies, 31(2), 118-135.
- Polyanskaya, L. A., & Polyansky, S. Y. (2025). Frame and mind map as methodological techniques for implementing the graphic method of reflective learning in the technology of critical thinking development at the basic general education level (using social studies as an example). Pedagogy. Theory & Practice, 10(6), 758–767. https://doi.org/10.30853/ ped20250090
- Rajiv Bansal, & Satender Khatri. (2023). An Observational Study on Graphical Presentation of Data - A Review. AYUSHDHARA, 10(Suppl3), 26-28.
- Mogull, S. A. (2017). Scientific and medical communication: a guide for effective practice. Routledge.
- Roig Zamora, J., & Araya Ramírez, J. (2013). Mental Maps Usage as a Didactic Tool in the Research Processes Performed by the Industrial Engineering Students of the Industrial Engineering Carreer.
- Hassan Abdelmoez Al-Hajj Hassan. (2024). Mind Maps: Their Benefits and Application
- Aker, B., Melhem, F., Khayyat, H., & Mlitat, T. (2019). Assessment of Al-Manara Mall.