
Current Research in Environmental Science and Ecology Letters(CRESEL)
ISSN: 2997-3694 | DOI: 10.33140/CRESEL


Research Article - (2024) Volume 1, Issue 1
Effects of Plant Decomposition and Soil Respiration on CO2 in the Atmosphere Via Global Temperature Changes
Received Date: Feb 01, 2024 / Accepted Date: Feb 24, 2024 / Published Date: Feb 29, 2024
Copyright: ©Â©2024 Masaharu Nishioka. This is an open-access article distributed under the terms of the Creative Commons Attribution License, which permits unrestricted use, distribution, and reproduction in any medium, provided the original author and source are credited.
Citation: Nishioka, M. (2024). Effects of Plant Decomposition and Soil Respiration on CO2 in the Atmosphere Via Global Temperature Changes. Curr Res Env Sci Eco Letters, 1(1), 01-12.
Abstract
A good correlation was found between the CO2 growth rate (ppm/year) and satellite-based global temperature, as shown in Figure 1 (see Introduction) in our recent paper. Then, the following equation was reasonably derived: drco2 /dt �?? γ ΔT (rco2 : CO2 concentration, γ: constant, ΔT: temperature change)
It was confirmed that the CO2 growth rate follows temperature changes with a time lag. This essential equation casts strong doubts that anthropogenic CO2 is the cause of global warming, although the concept of global warming due to anthropogenic CO2 has been proposed by the IPCC. Our previous papers suggested that temperature changes affect plant decomposition and soil respiration, followed by a change in CO2 generation. The higher the temperature is, the more CO2 is generated. In this paper, the effects of plant decomposition and soil respiration on CO2 in the atmosphere are further clarified for global temperature changes by reviewing related aspects and available datasets. The results included (1) the carbon budget, (2) the comparison of exhaust gas and CO2 growth rates, (3) greenhouse gas compositions, (4) the solar energy budget, (5) changes in carbon isotopes, (6) latitude-related changes in CO2 and temperature, and (7) seasonal changes in exhaust gas compositions. Based on all these results, we concluded that changes in plant decomposition and soil respiration due to global temperatures control the global CO2 cycles. The impact of CO2 emissions from fossil fuel combustion on global warming is extremely low.
Keywords
Global Warming, Carbon Cycles, Anthropogenic CO2, Vegetation Distribution, Plant Decomposition, Soil Respiration, CO2 Breathing, CO2 Growth Rate, Thermally-Induced CO2
Abbreviations
ENSO Index: El Niño-Southern Oscillation Index
IPCC: The Intergovernmental Panel on Climate Change (the United Nations body)
NASA: The National Aeronautics and Space Administration
NOAA: The National Oceanic and Atmospheric Administration
UAH: The University of Alabama in Huntsville
drco2/dt: The change rate of the CO2 concentration or CO2 growth rate
Rs: Soil respiration
ΔT: Temperature change
Introduction
The concept of global warming due to anthropogenic CO2 has been proposed by the Intergovernmental Panel on Climate Change (IPCC) [1]. CO2 is of great interest due to its infrared (IR) activity. Anthropogenic CO2 from fossil fuels increased after the Industrial Revolution. Moreover, global temperatures have risen with the increase in the use of fossil fuels. However, there is no direct evidence proving that anthropogenic CO2 has induced global warming. A temperature trend analysis of ice core samples showed that global temperatures have drastically changed with more than 13 cycles of rising and falling temperatures over the last 800,000 years [2]. Therefore, today’s global warming may be caused by a natural cycle and a portion of the “Modern Warm Period”.
Observation of the Earth's temperature using satellites began in 1979. Two groups, UAH (The University of Alabama in Huntsville) and RSS (Remote Sensing Systems) have conducted the observation and analysis [3,4]. Figure 1 includes the temperature changes in the lower troposphere measured by the UAH. The temperature is approximately 3,000 meters above the altitude and its value is the 13-month average of the six months before and after that month. It is rising very slowly, going up and down repeatedly. The average temperature increase is 0.14â??/decade [3]. We found a good correlation between the change rate of CO2 concentration and satellite-based global temperature data during 1979-2022. Since the CO2 concentration is currently increasing annually, the change rate of the CO2 concentration can be called the “CO2 growth rate” (ppm/year). Figure 1 shows the results from a previous paper [5]. Eq. (1) was reasonably derived as follows:
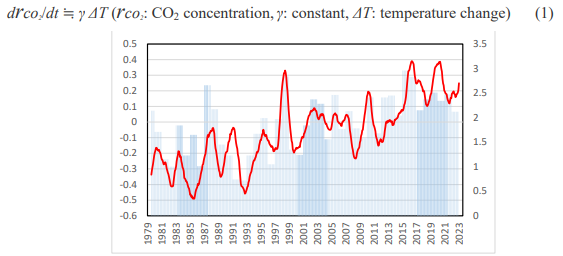
Figure 1: Correlation between Temperature and CO2 Changes During 1979-2022 [5]. Temperature (°C, Red Line): 13-Month Average of Lower Troposphere Anomaly Values by UAH with Scales on the Left. CO2 (Ppm/Year, Blue Vertical Lines): Difference from the Previous Year in Annual Averages by NOAA with Scales on the Right
It was confirmed that the CO2 growth rate (hereinafter referred to as drco2/dt) changes approximately several months after the temperature change (hereinafter referred to ΔT), which may be called “thermally-induced CO2”. Keeling et al. compared average global temperatures and drco2/dt values between 1958 and 1988 and reported correlations with a time lag of 6-12 months.
Humlum et al [6]. also reported a correlation with a time lag of 10-12 months [7]. Salby presented the correlation with a time lag of 10 months by analyzing it using a correlation coefficient [8,9]. All these results showed that two variables were correlated, but the temperature changed first, and the thermally-induced CO2 concentration followed ΔT with a time lag of 0.5-1 year:
ΔT à(0.5-1 year)à Δrco2 (Δrco2: a change in CO2 concentration) (2)
Therefore, the essential equations (1) and (2) cast strong doubts that anthropogenic CO2 is the cause of global warming [10].
Our previous paper suggested that ΔT affects plant decomposition and soil respiration, followed by a change in CO2 generation [5]. The higher the temperature is, the more CO2 is generated. The correlation between ΔT and drco2/dt was further investigated at different latitudes in a subsequent paper [11]. The effects of plant decomposition and soil respiration on both ΔT and drco2/dt were confirmed at various latitudes. It was interpreted that the constant γ varied depending on the vegetation on Earth. In this paper, the effects of plant decomposition and soil respiration on CO2 in the atmosphere are further clarified for global ΔT by reviewing related aspects and available datasets.
Global Data
Most of the datasets analyzed here are available on the National Oceanic and Atmospheric Administration (NOAA) website except for specific notes [12].
Results and Discussion
The investigation of carbon cycle budgets is the first step in clarifying CO2-related processes at the Earth’s surface. The carbon cycle budget (unit: GtC/year) from the IPCC report is shown in Figure 2 [13]. Anthropogenic CO2 accounts for only 4% of the total CO2, as calculated below:
anthropogenic CO2 ratio = (fossil fuel combustion)/(fossil fuel combustion +
respiration and decomposition + ocean atmosphere exchange)
=(7.8)/(7.8 + 107.2 + 79.2)
= 0.04 (3)

Figure 2: Simplified Carbon Cycles and Carbon Equivalent Estimates (Unit: GtC) Obtained from the IPCC Report [13].
Figure 2 shows that the “respiration and decomposition” value is 107.2 GtC, which is 55% of the total carbon cycle budget. The remaining data were associated with “ocean atmosphere exchange”, 41%. It should be noted that “vegetation + organic carbon in soils” has a value of 1,950-3,050 GtC. This amount is far greater than the coal reserves of 446-541 GtC [13]. This means that all the plants have not been respirated (or decomposed), and the remaining plants have accumulated. From this carbon cycle budget, the residence time of CO2 is calculated as follows:
CO2 residence time = (CO2 in the atmosphere)/(fossil fuel combustion +
respiration and decomposition + ocean-atmosphere exchange)
= (829)/(7.8 + 107.2 + 79.2)
=4 (4)
The residence time is approximately 4 years, which is relatively short on a global scale. This means that anthropogenic CO2 emis- sions are low (4%) and replaced with new CO2 every 4 years on average.
Figure 3 compares the global fossil fuel CO2 and drco2/dt between 1979 and 2021 [14,15]. Since drco2/dt data from NOAA are avail- able in units of ppm/year, the units are converted to GtC by the following equation [10].
(x1 GtC × 3.67/44)/(5,135 Eg/28.9) = x2 ppm (5)
(x1 and x2: variables, 3.67: a conversion factor from carbon to CO2, 44: molecular mass of CO2, 28.9: molecular mass of air, 5,135 Eg: air mass on earth)
Figure 3: Global Fossil Fuel CO2 (Blue: GtC/Year) and Global CO2 Growth Rate (Red: GtC/Year) between 1979 and 2021 (Datasets [14,15]).
No correlation was detected between these two variables. It is obvious that anthropogenic CO2 accounts for only 4% of the total carbon cycle budget and does not affect drco2/dt. Moreover, France et al. showed that there was no direct relationship between anthropogenic CO2 emissions and atmospheric CO2 concentrations [16]. CO2 emissions increased by 25% after 2003. However, the rate of increase in atmospheric CO2 has slowed since 2002- 2003. During 1990-2003, anthropogenic CO2 emissions remained relatively stable. During the 1997-1998 El Niño, the rate of increase in CO2 increased rapidly. Moreover, CO2 emissions rose by ~25% between 2003 and 2011, but the rate of increase has remained constant since 1999. The temperature also remained stable during this time. This indicates that anthropogenic CO2 emissions do not determine the atmospheric CO2 concentration. Natural processes dominate human-related processes. Even if we stop using fossil fuels, a rate of increase in CO2 concentration may not occur. The concentration of H2O vapor significantly varies from approximately 10 ppm to 5% by mole fraction [17]. If H2O is assumed to be 1%, the CO2 concentration in the greenhouse gas can be calculated as follows:
CO2 concentration in the greenhouse gas = (0.04)/(1 + 0.04) = 0.04 (6)
Therefore, CO2 is a minor greenhouse gas, and H2O is a dominant greenhouse gas, as illustrated in Figure 4. Furthermore, since an- thropogenic CO2 constitutes only 4% of the total carbon, as shown in eq. (4), anthropogenic CO2 constitutes approximately 0.16% of the total greenhouse gas. A comparison of the absorption spectra of air, H2O, and CO2 reveals that most of IR is absorbed by H2O molecules [18]. Again, in the present atmosphere, H2O vapor is the most significant greenhouse gas, followed by CO2 and various other minor greenhouse gases.
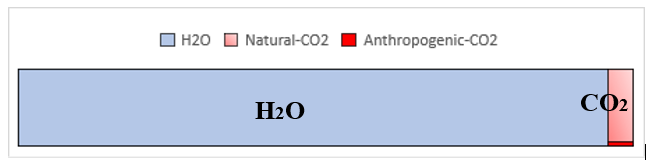
Figure 4: Compositional Ratio of Greenhouse Gases in the Atmosphere when H2O is Assumed to be 1%
Investigating the solar energy budget is also necessary for clarifying CO2-related processes at the Earth’s surface. Figure 5 shows the solar energy budget from the NASA dataset [19]. The reflectance (Albedo) is 30%, and 19% is absorbed by the atmosphere, including clouds. The remaining 51% is absorbed and reflected by the ground. of the 51%, 30% is consumed by conduction from the ground to the atmosphere and water evaporation, and 21% is reflected from the ground as IR radiation. Six percent of the IR radiation reflected from the ground passes through the atmosphere (atmospheric window). The remaining 15% is absorbed by the active substances of IR. As shown in Figure 4, 96% of the IR active substances in the atmosphere are H2O molecules, so nearly the entire amount of reflected IR is absorbed by H2O molecules. Furthermore, temperature is the kinetic energy of atmospheric gas molecules, and IR absorption by active substances does not necessarily increase the temperature of the atmosphere. It needs to be converted into the kinetic energy of O2 and N2 gas molecules. It is important to pay attention to the extent to which the low IR energy of 15 μm absorbed by CO2 contributes to the kinetic energy of O2 and N2.

Figure 5: Solar Energy Budget Based on the NASA Dataset [19]
13C is 1.1% of natural carbon, and plants take in more 12CO2 than concentration in the atmosphere will be lower than normal. This 13CO2 through photosynthesis. In the past, fossil fuels originating is known as the “Suess Effect” [20]. δ13C is a measure of the ratio from living organisms contained more 12CO2 , and their emissions contained relatively high amounts of 12CO2 . Therefore, the 13C of the two stable isotopes of carbon, 12C and 13C, and is defined in parts per thousand (‰) as follows:
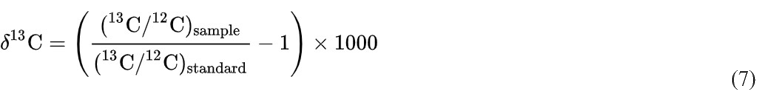
Figure 6 compares the trends of both δ13C and CO in Barrow,AK between 2010 and 2014 [12, 21]. CO2 is emitted when plants breakdown through plant decomposition and soil respiration. Moreover, the ratio of 12CO to 13CO in the atmosphere increases Taken together with the global carbon budget in Figure 2, the results in Figure 6 show that the contribution of CO2 released from plant decomposition and soil respiration to atmospheric CO2 must be clearly dominant over that of the fossil fuel CO2. Two variables, δ13C and CO , exhibit anti-correlation, but the interpretation of these results by using the Suess effect cannot be generalized.
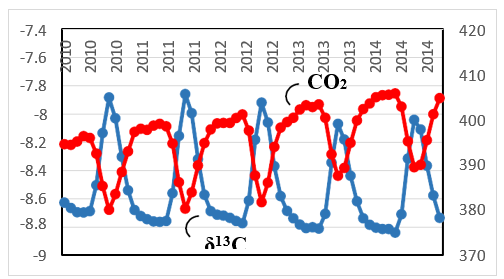
Figure 6: Trends of both δ13C (Blue, Scale: Left) and CO2 (Red, Scale: Right) in Barrow, AK between 2010 and 2014 (Datasets: [12, 21])
In a previous paper, ΔT and drco2/dt were compared between 1979 and 2022 in the tropics, north latitudes, and south latitudes [11]. ΔT in the tropics strongly responds to El Niño events, as shown in Figure 7(a). The increasing trend in temperature is greater in the north (20 N-90 N) than in the south (20 S-90 S). It can be seen that drco2/dt at the sine latitude of 0.75 (â??50 N) responds more strongly to ΔT than does that in the tropics, as shown in Figure 7(b). The average annual increase rates of the CO2 concentration between 1979 and 2022 (see Figure 7(b)) are 1.85, 1.90 and 1.83 (ppm/year) for the tropics (20 S-20 N), the northern latitudes (20 N-90 N), and the southern latitudes (20 S-90 S), respectively. Land occupies approximately 30% of the Earth, 30% of the land is forested, and approximately 10% of the Earth's surface is covered with forests [11]. Subarctic forests extend to 50 N-70 N in the Northern Hemisphere. In the Southern Hemisphere, forests can be found only at the southern tip of South America. The Southern Hemisphere comprises a small area of both land and forests. On the other hand, the Northern Hemisphere comprises a vast area of both land and forests.
Figure 7(a): Temperature Change (â??) between 1979 and 2022 in the Tropics (20 S-20 N, Red), North Latitude (20 N-90 N, Green) and South Latitude (20 S-90 S, Purple)
Figure 7(b): The Change Rate of CO2 Concentration (ppm/Year) with Latitude between 1979 and 2022 at Sine Latitudes (-0.75â??50 S: Purple, 0: Red, And 0.75â??50 N: Green) [11]
The difference in ΔT between the land and sea is greater in the north (20 N-90 N) than in the south (20 S-90 S), as shown in a previous paper [11]. Furthermore, the temperature increase trend is greater in the north (20 N-90 N) than in the south (20 S-90 S). Therefore, changes in temperature and CO2 concentration due to global location, seasonal periods, and differences between land and sea support the critical role of plant decomposition and soil respiration in global temperature change. We compared satellite-based UAH Earth-surface temperatures, the NOAA ENSO index, and global drco2/dt in detail in a previous paper [5]. These three variables were strongly correlated over the 40 years of observation. The temperature changed approximately one year after the ENSO index changed, and drco2/dt followed the ΔT by several months. CO2 emission and absorption at the Earth’s surface respond to ΔT. It was like Earth’s breathing. Figure 8 summarizes the process. CO2 emissions due to higher temperatures were related to plant decomposition and soil respiration. CO2 emissions during El Niño events are influenced by plant decomposition and soil respiration, which may increase due to an increase in temperature. The outlined process during El Niño is summarized in Figure 8 [5].

Figure 8: Proposed Process for El Niño Events: An Increase in Global Temperature, an Increase in Respiration, and Subsequent Global CO2 Emissions [5]
Organic compounds are synthesized from CO2 during photosynthesis, and the synthesized organic compounds eventually decompose and return to CO2. This decomposition process may be called soil respiration (Rs) because it occurs mainly underground. oxygen is not present. Atmospheric N2O is thought to be produced by the activity of denitrifying bacteria in the soil. This is due to the respiratory nitrate-reducing action of bacteria. If there is a sufficient nitrogen source, such as NH + or NO -, N O is generated 4 3 2 Rs consists of autotrophic and heterotrophic processes and releases CO2 from the soil to the atmosphere [22]. The primary heterotrophic process is a microbial process that is the largest carbon cycling process on Earth (Figure 2). The global annual CO2 emission rate through Rs is estimated to be approximately 70 GtC/year and is positively correlated with temperature and precipitation [23]. Additionally, because decomposition is a biological process, the process does not change immediately when the temperature changes, but there is a time lag. Temperature is a major factor in the Rs process, so it fluctuates seasonally, as does CO2 generation. In other words, as shown in Figure 7, seasonal changes in CO2 concentrations are small in the Antarctic and increase as people move northward. CO2 generated and consumed in nature is associated with photosynthesis, plant decomposition and soil respiration.
The decomposition produces CO2 in an aerobic atmosphere where oxygen is present and CH4 in an anaerobic atmosphere where from moist soil [24,25]. Although the concentrations of CH4 and N2O in the atmosphere are much lower than that of CO2, their global warming potential (GWP) is greater than that of CO2.
To confirm the effect of Rs on CH4 and N2O in addition to CO2, the seasonal changes in the concentrations of these compounds were investigated. Figure 9 shows the trends of the atmospheric concentrations of (a) CH4 and CO2 and (b) CH4 and N2O between 2018 and 2022. The concentrations of these gases increase annually, but seasonal changes are observed. The concentrations decrease from spring to summer and increase from fall to winter. These results are consistent with those of the Rs process, which starts to activate in spring because of increasing temperatures and generates more CO2, CH4, and N2O in fall after a time lag with biological processes. In the case of CO2, photosynthesis occurs, and the kinetics of CO2 generation differ from those of CH4 and N2O generation. Figure 10 illustrates the seasonal changes in the formation of these gases.
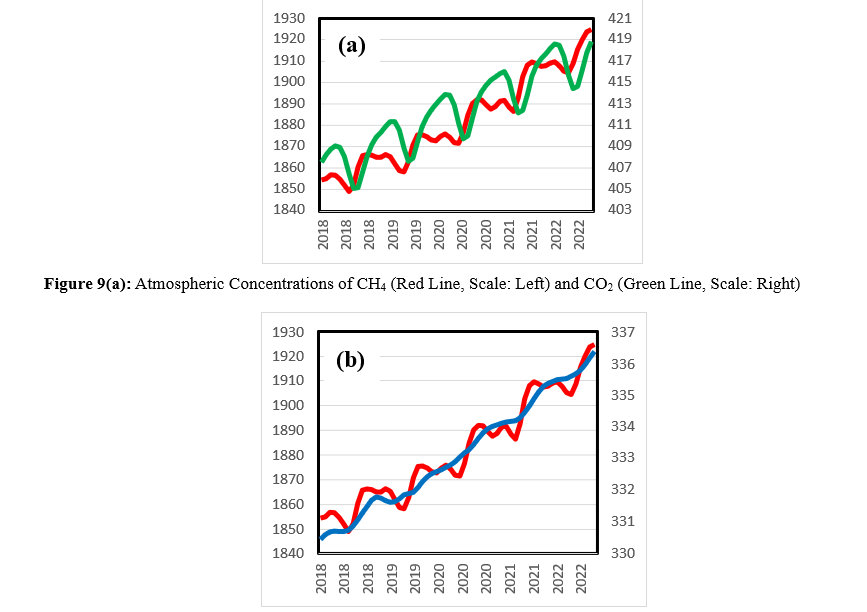
Figure 9(b): Atmospheric Concentrations of CH4 (Red Line, Scale: Left) and N2O (Blue Line, Scale: Right) between 2018 and 2022 (Dataset: [12])
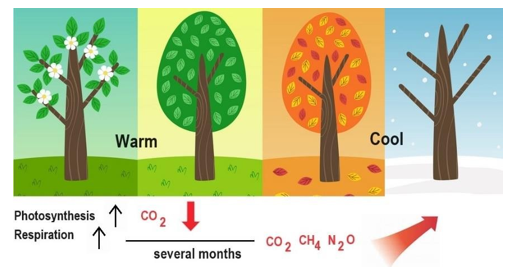
Figure 10: Proposed Seasonal Pattern for the Generation of CO2, CH4, and N2O with a Time Lag of Several Months by Plant Decom- position and Soil Respiration
The period of 7,000 to 5,000 years ago was the warm Holocene Epoch [26]. Four major civilizations flourished during the warm period of 5,000 to 3,500 years ago. Then, the temperature gradually decreased, and it is thought that there was Little Ice Age between 1,650 and 1,850 after the Roman Warm Period and Medieval Warm Period [27-29]. The Mendenhall Glacier and Lake are located 20 km north of Juneau, AK (Figure 11). During the lowest temperature period of the Little Ice Age in the mid-1700s, the Mendenhall Glacier reached its maximum advance and began to retreat [30]. The tip of the former glacier is now the lake. In the mid-1700s, CO2 concentrations had yet to rise significantly. The retreat of glaciers may have been caused by the transition to the modern warm period due to natural cycles rather than the effects of CO2.

Figure 11: The Mendenhall Glacier and Lake are located 20 km North of Juneau, AK (by Author, 8/2/2014)
Since 1812, more than 90,000 chemical analyses have been performed on atmospheric CO2 [31]. Past direct analytical results show that CO2 has not monotonically changed but rather has considerably changed with changes in temperature [32]. The concentration of CO2 in the Northern Hemisphere reached three high levels, approximately 1825, 1857, and 1942. At the peak in 1942, corresponding to the 1930-40 warm period, values greater than 400 ppm were observed, comparable to modern CO2 concentrations. Based on the changes in temperature in Antarctica during this time, it can be inferred that the three peaks in CO2 corresponded to rising temperatures. Direct atmospheric measurements indicate that CO2 concentrations fluctuated by approximately 150 ppm, up to values much higher than those of today, between 1812 and 1961. These direct measurements were mostly greater than the ice core data. For example, around the year 1820, it was approximately 440 ppm; approximately 1855, it was 390 ppm; and approximately 1940, it was 440 ppm. Additionally, data compiled by Beck suggest that changes in CO2 concentrations follow, rather than precede, ΔT [31,32]. Analyses of ice core samples have shown that global temperatures and CO2 concentrations have periodically changed over the last 800,000 years [2]. The temperature patterns have changed even for the last 2,000 years, as shown in Figure 12(a), with an ice age and warm periods. Based on the above results and the results of direct CO2 analyses since the 19th century, CO2 has changed so that it slowly breathes in response to ΔT. Figure 12(b) is an illustration of this situation but is relatively fast over a few years for the ENSO periods reported in a previous paper [5].
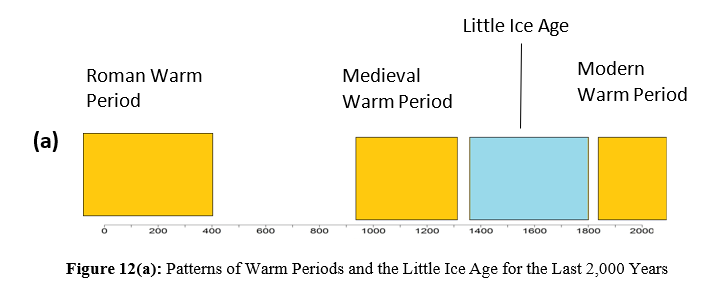
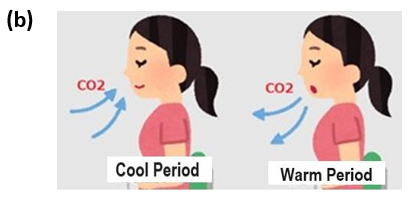
Figure 12(b): Proposed Thermally-Induced CO2 Absorption and Emission Processes During Cool and Warm Periods on Earth
Atmospheric CO2 is taken up by plants through photosynthesis and converted into organic matter. The higher the CO2 concentration is, the more actively photosynthesis occurs. This is considered to be the additional fertilizing effect of CO2. The food chain allows animals to thrive by taking in plants. When animals and plants reach the end of their lifespans, they decompose and return to CO2 as shown in Figure 13 [33].

Figure 13: The Global CO2 Cycle was Modified from the Cycle in [33]. CO2 does not Necessarily Cause Adverse Effects on the Global Environment (See Text).
As Earth's temperature increases, biological processes in soil become more active, leading to faster decomposition of organic matter, and the amount of CO2 emitted increases. Biological processes are accompanied by microbial processes and increased soil fertility, which is good for the global environment. Furthermore, as observed, Earth is becoming greener due to rising CO2 and increasing fertility [34]. The current levels of mild global warming and increases in CO2 do not necessarily seem to be adverse effects on the global environment. Since CO2 is a gas, it can diffuse and move through the atmosphere, forming a series of carbon cycles. Unlike the IPCC and other organizations that insist on reducing CO2 for the sake of the future global environment, CO2 may be a useful and valuable substance.
Conclusions
Our previous papers suggested that ΔT affects plant decomposition and soil respiration, followed by a change in CO2 generation. The higher the temperature is, the more CO2 is generated. In this paper, the effects of plant decomposition and soil respiration on CO2 in the atmosphere are further clarified for global temperature changes by reviewing related aspects and available datasets. The aspects and datasets investigated include the following
• An essential equation, drco2/dt â?? γ ΔT (rco2: CO2 concentration, γ: constant, ΔT: temperature change), was derived. drco2/dt follows ΔT and is proportional to the magnitude of ΔT. The constant γ changes depending on the plant distribution on Earth [11].
• The carbon cycle budget shows that anthropogenic CO2 accounts for only 4% of the total, and the residence time of CO2 is approximately 4 years.
• There is no correlation between CO2 exhausted from fossil fuel combustion and drco2/dt. • CO2 is only 4% of greenhouse gas, and the remaining 96% is H2O.
• Fifteen percent of solar energy is reflected from the ground as IR and is absorbed by IR active substances in the atmosphere. Nearly the entire amount of reflected IR is absorbed by H2O molecules.
• δ13C and CO show anti-correlation, but the interpretation of the Suess effect cannot be applicable for this anti-correlation if the result is considered together with the global carbon budget.
• The extent of the correlation between drco2/dt and ΔT differs depending on the latitude and between the land and sea.
• During El Niño, drco2/dt follows ΔT with a time lag of several months, and CO2 emission and absorption at the Earth’s surface respond to ΔT.
• The concentrations of CO2, CH4, and N2O gases increase annually, but seasonal changes are observed. These concentrations decrease from spring to summer and increase from fall to winter.
• Rs is interpreted to activate in spring because of increasing temperatures and generate CO2, CH4, and N2O in fall due to biological processes after a time lag.
• Temperature patterns have changed over the last 2,000 years, as shown by the ice age and warm periods. Therefore, CO2 has evolved to breathe slowly in response to ΔT.
• Plant decomposition and soil respiration are paralleled by microbial processes and increased soil fertility, and Earth is becoming greener due to rising CO2 and increasing fertility. Based on these results, we conclude that changes in plant decomposition and soil respiration due to global temperatures primarily control global CO2 cycles. The impact of CO2 emissions from fossil fuel combustion on global warming is extremely low. For these reasons, the man-made global warming hypothesis needs to be carefully reinvestigated.
References
- IPCC Assessment Report AR6.
- The National Institute of Water and Atmospheric Research, Ice core temperature and CO2.
- Spencer, R. Latest Global Average Tropospheric Temperatures.
- Remote Sensing Systems, Microwave Climate Data Center.
- Nishioka, M. (2023). Changes in Temperature and CO2 Concentration Induced by El Niño Sci Rep J. 2:192
- Keeling, C. D., Piper, S. C., & Heimann, M. (1989). A threeâ? dimensional model of atmospheric CO2 transport based on observed winds: 4. Mean annual gradients and interannual variations. Aspects of climate variability in the Pacific and the Western Americas, 55, 305-363.
- Humlum, O., Stordahl, K., & Solheim, J. E. (2013). The phase relation between atmospheric carbon dioxide and global temperature. Global and Planetary Change, 100, 51-69.
- Salby, M. L. (2018). What is really behind the increase in atmospheric CO2. Video Presentation, October, 10.
- Salby, M. “Atmospheric Carbon”, Video Presentation, July 18, (2016) University College London,
- Harde, H. (2017). Scrutinizing the carbon cycle and CO2 residence time in the atmosphere. Global and Planetary Change, 152, 19-26.
- Nishioka, M. (2024). Changes in Temperature and CO2 in the Atmosphere at Various Latitudes. Curr Res Env Sci Eco Letters, 1(1), 01-09.
- NOAA Global Monitoring Laboratory, Carbon Cycle Greenhouse Gases.
- IPCC Assessment Report, Carbon Cycle Budget.
- University of Exeter, Global Carbon Budget.
- NOAA datasets, Carbon Cycle Greenhouse Gases / Data /CO2.
- Francey, R. J., Trudinger, C. M., Van Der Schoot, M., Law,R. M., Krummel, P. B., Langenfelds, R. L., ... & Rödenbeck,C. (2013). Atmospheric verification of anthropogenic CO2emission trends. Nature Climate Change, 3(5), 520-524.
- Wallace, J. M., & Hobbs, P. V. (2006). Atmospheric science: an introductory survey (Vol. 92). Elsevier.
- Wikimedia Commons, the free media repository, Radiation Transmitted by the Atmosphere.
- Center for Science Education, The Energy Budget.
- Keeling, R. F., Graven, H. D., Welp, L. R., Resplandy, L., Bi, J., Piper, S. C., ... & Meijer, H. A. (2017). Atmospheric evidence for a global secular increase in carbon isotopic discrimination of land photosynthesis. Proceedings of the National Academy of Sciences, 114(39), 10361-10366.
- Institute of Arctic and Alpine Research.
- Nissan, A., Alcolombri, U., Peleg, N., Galili, N., Jimenez- Martinez, J., Molnar, P., & Holzner, M. (2023). Global warming accelerates soil heterotrophic respiration. Nature Communications, 14(1), 3452.
- The Oak Ridge National Laboratory Distributed Active Archive Center, Global Annual Soil Respiration Data (1992).
- Pierotti, D., & Rasmussen, R. A. (1977). The atmospheric distribution of nitrous oxide. Journal of geophysical research, 82(37), 5823-5832.
- Tian, H., Xu, R., Canadell, J. G., Thompson, R. L., Winiwarter, W., Suntharalingam, P., ... & Yao, Y. (2020). A comprehensive quantification of global nitrous oxide sources and sinks. Nature, 586(7828), 248-256.
- General background is available on Wikipedia, Holocene.
- General background is available on Wikipedia, Little Ice Age.
- General background is available on Wikipedia, Roman Warm Period.
- General background is available on Wikipedia, Medieval Warm Period.
- Motyka, R. J., O'Neel, S., Connor, C. L., & Echelmeyer, K.A. (2003). Twentieth century thinning of Mendenhall Glacier, Alaska, and its relationship to climate, lake calving, and glacier run-off. Global and Planetary Change, 35(1-2), 93- 112.
- Beck, E. G. (2007). 180 years of atmospheric CO2 gas analysis by chemical methods. Energy & Environment, 18(2), 259-282.
- Zbigniew Jaworowski, CO2: The Greatest Scientific Scandalof Our Time, EIR Science March 38-53 (2007).
- Illustration is referred to Carbon Cycle.
- Donohue, R. J., Roderick, M. L., McVicar, T. R., & Farquhar,G. D. (2013). Impact of CO2 fertilization on maximum foliage cover across the globe's warm, arid environments. Geophysical Research Letters, 40(12), 3031-3035.