
World Journal of Forest Research(WJFR)
ISSN: 2994-5569 | DOI: 10.33140/WJFR


Research Article - (2026) Volume 5, Issue 1
Ecosystem Evolution Scenarios in the Ferlo Biosphere Reserve Based on the Iucn Red List of Ecosystems Criteria
2Department of Plant Biology, Faculty of Science and Technology, Cheikh Anta Diop University (UCAD), , Senegal
Received Date: Dec 18, 2025 / Accepted Date: Jan 21, 2026 / Published Date: Jan 29, 2026
Copyright: ©2026 Diara Sylla, et al. This is an open-access article distributed under the terms of the Creative Commons Attribution License, which permits unrestricted use, distribution, and reproduction in any medium, provided the original author and source are credited.
Citation: Sylla, D., Sene,A., Guisse, A. (2026). Ecosystem Evolution Scenarios in the Ferlo Biosphere Reserve Based on the Iucn Red List of Ecosystems Criteria. World J Forest Res, 5(1), 01-16.
Abstract
This study assesses the applicability of the International Union for Conservation of Nature (IUCN) Red List of Ecosystems criteria in a typically Sahelian environment, namely the Ferlo Biosphere Reserve in Senegal.
The methodology is based on the evaluation of different ecosystem types using five assessment criteria: two criteria related to spatial distribution (qualitative factors), two criteria addressing ecosystem functioning through biotic and abiotic interactions (quantitative factors), and a final criterion based on quantitative risk analysis. Ecosystems are subsequently classified into one of eight threat categories—Collapsed, Critically Endangered, Endangered, Vulnerable, Near Threatened, Least Concern, Data Deficient, and Not Evaluated—according to the thresholds defined by the IUCN framework.
The analysis relies on land-use and land-cover maps of the Ferlo Biosphere Reserve for the years 1965 and 2017, as well as statistical data derived from these datasets and their spatial overlay.
The results indicate that vegetation formations exhibiting regressive trends are the most threatened. Gallery forests within the biosphere reserve are classified as Endangered, while wooded savanna falls into the Collapsed category. Shrub to tree savanna is also classified as Endangered. Conversely, ecosystems that have experienced progressive dynamics—corresponding to the least stable stages of spontaneous vegetation succession—are classified as Least Concern.
The application of the IUCN Red List of Ecosystems methodology in the Ferlo Biosphere Reserve demonstrates that this framework is fully applicable to Sahelian environments, as most of the assessment criteria can be reliably documented.
Keywords
Red List of Ecosystems, IUCN, biosphere reserve, Ferlo, Senegal, Sahel
Introduction
In the context of widespread biodiversity degradation observed across all biomes, it has become essential to redefine conservation priorities through the establishment of a globally recognized reference monitoring system. Such a system is necessary to promote effective ecosystem management and to maintain ecosystem health, which is increasingly acknowledged as critical for human well-being, particularly in relation to natural risk reduction and climate change adaptation [1,2].
In response to this challenge, the International Union for Conservation of Nature (IUCN) initiated a global framework for the development of the Red List of Ecosystems. This framework aims to assess ecosystem status using five criteria and to assign ecosystems to one of eight threat categories defined by the IUCN [3]. These criteria include: reduction in geographic distribution, restricted distribution, degradation of the abiotic environment, disruption of biotic interactions, and quantitative estimation of the risk of ecosystem collapse through modeling approaches. The Red List of Ecosystems constitutes a powerful tool for monitoring global biodiversity change, informing conservation actions, and facilitating effective communication with decision-makers across multiple sectors.
The adoption of this methodology requires its application across all bioclimatic zones and spatial scales. To date, most applications have been conducted in Europe and Latin America [3-7]. Applications in Africa remain limited and have largely focused on Sudanian zones or national-scale assessments [3,8]. However, the evaluation of Sahelian ecosystems—particularly protected areas in the Sahel—would not only allow for testing the applicability of the method and assessing the relevance of its criteria, but also provide an opportunity to propose potential refinements and to predict ecosystem evolution scenarios in regions of high biological importance.
Within this context, the present study applies the IUCN Red List of Ecosystems methodology to the Ferlo Biosphere Reserve, a protected area located in the Senegalese Ferlo, with the objective of assessing ecosystem risk and exploring future ecosystem trajectories in a Sahelian setting.
Materials and Methods
Description of the Study Area
The study was conducted in the Ferlo Biosphere Reserve, which covers a total area of 2,057,861.66 ha.
From an administrative perspective, the reserve extends across three regions, five departments, and thirteen municipalities. The regions concerned are Louga, Saint-Louis, and Matam (Figure 1). The departments and municipalities included in the reserve are as follows:
• Ranérou-Ferlo Department: Pété Mboumba and Galoya Toucouleur
• Matam Department: Ogo, Oréfondé, Agnam Civol, and Dabia
• Kanel Department: Ourosidy and Ndendory (currently Sinthiou Mamambe)
• Linguère Department: Barkhédji In accordance with the statutory framework of the UNESCO Man and the Biosphere (MAB) Programme and the Seville Strategy, the Ferlo Biosphere Reserve is organized into several management zones. These include four core areas exclusively dedicated to conservation and scientific research, buffer zones where the use of natural resources is permitted under regulated conditions, and transition zones, which encompass resource-use activities as well as human settlements.
The specific functions and zoning arrangements of each area are not detailed in this article, as they have already been thoroughly described in a previous scientific publication [9].

Figure 1: Location and zoning of the Ferlo Biosphere Reserve in Senegal. The reserve is structured into core areas, buffer zones, and transition zones in accordance with the UNESCO Man and the Biosphere (MAB) Programme. The map also shows the ecological zones and administrative boundaries surrounding the reserve
The Ferlo Biosphere Reserve was selected because of its strategic geographical position along major climatic, pedological, and anthropogenic gradients, as well as its legal protection status. Indeed, the Ferlo North Wildlife Reserve is located within the northern sandy Ferlo, while the southern part of the Ferlo includes the Ferlo South Wildlife Reserve, which lies within the lateritic Ferlo zone.
The Ferlo region corresponds to the northern bioclimatic zone of Senegal, characterized by a Sahelian climate in the north and a Sahelo-Sudanian climate in the southern part. Rainfall increases along a north–south gradient and ranges between the 100 mm and 500 mm isohyets. The landscape is shaped by a succession of sand dunes and low-lying depressions, which become seasonally waterlogged during part of the year.
Soil types vary according to the pedological gradient. The northern sandy Ferlo is dominated by reddish-brown soils, composed mainly of loose sands with low water-holding capacity, as well as ferruginous soils, which are shallow and poor in organic matter. In contrast, the eastern cuirassed Ferlo is characterized by gravelly soils, generally dark in color and relatively rich in organic matter, and lithosols, which are very shallow soils with limited development.
Vegetation is characterized by a continuous herbaceous layer, reaching its maximum development at the end of the rainy season, and a woody layer composed of trees, shrubs, and bushes. Vegetation distribution closely follows both the rainfall gradient and the pedological gradient across the region. As a result, steppe formations are predominantly found in the northern Ferlo, while savanna formations occur in the southern part. These vegetation types may develop on dune systems, whereas gallery forests and denser vegetation formations are mainly associated with topographic depressions and lowlands.
Methodological Approach
Tools and Data Sources
A comprehensive literature review was conducted, focusing on reliable and quantifiable data sources. Information relevant to the biophysical characterization of each ecosystem type was compiled to support the assessment.
In addition, remote sensing and Geographic Information Systems (GIS) were used, specifically through the analysis of diachronic ecosystem mapping of the Ferlo Biosphere Reserve. The datasets included:
• the 1965 land-use/land-cover map of the Ferlo Biosphere Reserve, derived from the interpretation of CORONA aerial photographs from the U.S. reconnaissance mission;
• the 2015 land-use/land-cover map, produced from the interpretation of satellite imagery obtained from the ArcGIS database and subsequently validated through field surveys in 2017;
• statistical outputs derived from both datasets and from their spatial overlay;
• additional information related to the biophysical characterization and evolutionary processes of the targeted ecosystems.
Ecosystem Classification using the IUCN Red List of Ecosystems
The ecosystem classification method based on the IUCN Red List of Ecosystems (RLE) relies on the assessment of the risk of ecosystem collapse. This framework is based on five assessment criteria and eight categories of collapse risk [10].
In this study, the IUCN Red List of Ecosystems criteria were applied to the vegetation formations of the Ferlo Biosphere Reserve. The RLE methodology is a relatively recent framework designed to assess the risk of ecosystem collapse, which is considered to occur when an ecosystem loses its defining biotic and abiotic characteristics [3].
The assessment is based on five rule-based criteria designed to capture four major symptoms of ecosystem degradation: declining distribution, restricted distribution, degradation of the abiotic environment, and disruption of biotic processes. The final risk category assigned to an ecosystem corresponds to the highest level of risk indicated by any of the [3,11].
In the present study, criteria A and B, which assess declines in ecosystem extent (Criterion A, leading to reduced carrying capacity and niche diversity) and restricted geographic distribution (Criterion B, increasing vulnerability to spatially explicit threats), were evaluated using diachronic spatial datasets derived from land-use and land-cover maps for 1965 and 2017.
Criteria C and D, which evaluate the relative severity of abiotic degradation (Criterion C, resulting in reduced habitat quality) and disruption of biotic interactions and key ecological processes (Criterion D), were assessed through the synthesis of available ecological information and the compilation of relevant biophysical data. These data were used to evaluate the relative severity of ecosystem degradation over the 52-year study period, following the guidelines proposed by Keith et al. [3].
Results
Spatial Distribution of Ecosystems
The land-use and land-cover mapping of the Ferlo Biosphere Reserve for 1965 and 2017 allowed the identification of seven land-cover classes: savannas, steppes, croplands, human settlements (habitat), bare soils, lateritic crust areas, and water bodies (temporary ponds) [12].
The spatial variability of natural vegetation made it possible to distinguish:
• within savanna formations, four classes: wooded savanna, tree savanna, shrub-to-tree savanna, and shrub savanna;
• within steppe formations, two classes: shrub-to-tree steppe and shrub steppe. Vegetation dynamics analysis revealed a regressive trend in the following formations: gallery forests, shrub-to-tree savanna, and wooded savanna within the biosphere reserve. Consequently, the assessment of collapse risk focused on these ecosystems, which experienced measurable degradation over the 52-year period.
Gallery Forest Ecosystem in the Ferlo Biosphere Reserve
Classification
National Classification
Gallery forests are recognized as a distinct vegetation formation in Senegal and in several pastoral unit characterization reports [13-15]. They correspond to riparian vegetation occurring along valleys and drainage networks in the Ferlo region.
IUCN Habitat Classification Scheme (Version 3.0): 1. Forest → 1.5 Subtropical Dry Forest [6].
Ecosystem Description: Gallery Forest
a. Biotic Characteristics
This ecosystem type is characterized by dense woody vegetation, with tree species exceeding 7 m in height and a canopy cover ranging between 60% and 70%. The most frequently encountered woody species include Acacia senegal, Anogeissus leiocarpus, Acacia nilotica, Combretum glutinosum, Piliostigma reticulatum, Mitragyna inermis, and Guiera senegalensis.
Other species, such as Balanites aegyptiaca, may locally form nearly monospecific stands, particularly in the northern part of the reserve. The ecosystem also hosts rare or very rare species in the Ferlo, including Dalbergia melanoxylon, Sclerocarya birrea, and Sterculia setigera, which are listed on the IUCN Red List of threatened species.
When present, the herbaceous layer is composed of species such as Schoenefeldia gracilis, Pennisetum pedicellatum, Zornia glochidiata, Polycarpaea linearifolia, Tephrosia bracteolata, Cenchrus biflorus, and Dactyloctenium aegyptium. Some herbaceous species, including Justicia niokolo-kobae and Digitaria aristulata, are currently highly threatened or locally declining.
Wild fauna is almost absent due to intense anthropogenic pressure; however, domestic livestock, particularly cattle, goats, and other small ruminants, are abundant in these areas.
b. Abiotic Characteristics
Gallery forests are located along the ancient Ferlo valley and its tributaries. This ecosystem includes ponds, croplands, and human settlements. The hydrological and pedological conditions of these lowland environments explain the presence of gallery forests. The groundwater table is relatively shallow and may lead to seasonal flooding during the rainy season.
Soils are mainly grey sandy-clay soils, locally calcareous, as well as hydromorphic soils with temporary waterlogging. Due to their low topographic position, these ecosystems receive mineral elements and sediments transported by runoff, resulting in higher soil fertility compared to surrounding upland areas.
The climate is Sahelian, characterized by a nine-month dry season and a three-month rainy season.
c. Distribution
Gallery forests occur throughout much of the Ferlo Biosphere Reserve, forming linear formations along the former river valley and its tributaries. They extend across several pastoral units located within the reserve.
d. Key Processes and Interactions
Hydrological processes, particularly runoff and seasonal flooding, play a crucial role in maintaining the structure and functioning of gallery forests. These conditions support distinct plant communities that differ from those adapted to surrounding upland soils. Fruits and foliage from gallery forest species are highly palatable to livestock.
However, results indicate a decline in tree density over the 52-year period, likely associated with recurrent droughts and reduced flooding in some stands. In certain areas, this has led to the transformation of gallery forests into savanna formations or even bare land, accompanied by the decline of sensitive species such as Dalbergia melanoxylon.
e. Threatening Processes
The main threats to gallery forests in the Ferlo Biosphere Reserve include land-use change (conversion to cropland and settlements) and overgrazing. Initially linked to subsistence agriculture, land clearing has intensified following changes in pastoral land management. Settlements are often established at the edges of gallery forests, leading to the expansion of cultivated areas.
Because gallery forests contain ponds that retain water for extended periods after the rainy season, they attract livestock seeking water, forage, and shade. This results in overgrazing, soil compaction, and ecosystem fragmentation, contributing to the contraction of gallery forest extent. These pressures, combined with recurrent droughts, substantially increase the vulnerability of this ecosystem.
f. Application of IUCN RLE Criteria
Criterion A: Reduction in Geographic Distribution
Criterion A1
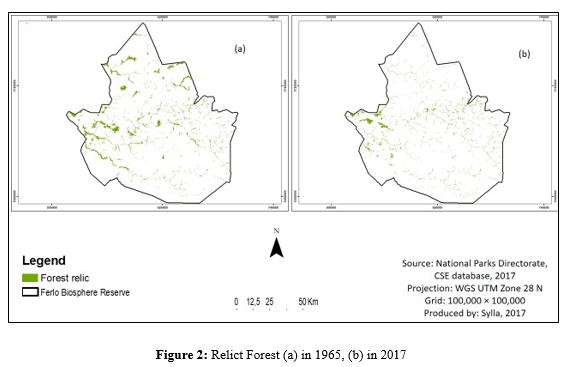
Land-use mapping for 1965 and 2017 (figure 2 (a) et 2 (b)) indicates a significant decline in gallery forest extent over 52 years, decreasing from 867.14 km² in 1965 to 659.18 km² in 2017. The proportional rate of decline is 23%, which does not meet the threshold for threat classification under Criterion A1. Accordingly, the gallery forest ecosystem is classified as Least Concern (LC) under Criterion A1.
Criterion A2
Based on observed changes between 1965 and 2017, the mean rate of decline is approximately 4 km² per year. Projecting this trend over a 50-year period from 2017 results in an estimated loss of 200 km², corresponding to an absolute decline of 30.34%. Under Criterion A2, the gallery forest ecosystem is therefore classified as Vulnerable (VU).
Criterion B: Restricted Geographic Distribution
Criterion B1 (Extent of Occurrence):
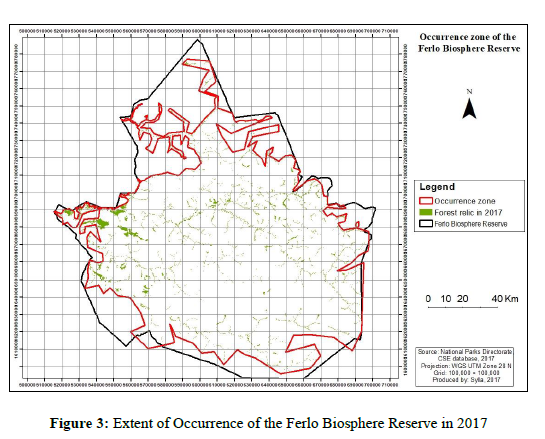
The extent of occurrence of the gallery forest ecosystem in 2017 is estimated at 15,718.2 km² (see figure below). This value is below the 20,000 km² threshold and, considering the documented decline in ecosystem extent over the 52-year period, the gallery forest ecosystem meets the conditions of subcriteria B1a and B1c. Accordingly, under Criterion B1, the ecosystem is classified as Endangered (EN).
Criterion B2 (Area of Occupancy):
In 2017, the gallery forest ecosystem occurs within 194 grid cells of 10 km × 10 km (figure 3), of which 78 cells contain more than 1 km² of the ecosystem. To be eligible for assessment under Criterion B2, the ecosystem must also be subject to a continuing decline in its geographic distribution, environmental quality, or biotic interactions.
Although no clear decline in environmental quality has been demonstrated, a continuing decline in geographic distribution has been observed (see Criterion A2). However, the estimated area of occupancy of 78 grid cells does not meet the threshold required for classification under Criterion B2. Consequently, under this criterion, the gallery forest ecosystem is assigned to the Least Concern (LC) category.
Criterion B3: Number of Locations
Because the gallery forest ecosystem occurs across more than five locations, the gallery forest of the Ferlo Biosphere Reserve is classified as Least Concern (LC) under Criterion B3.
Criterion C: Degradation of the Abiotic Environment
Variations in rainfall and the expansion of cultivated areas are likely to contribute to the degradation of the abiotic environment of the relict riparian forest. However, it is necessary to identify the dominant driver of degradation. Several studies indicate that rainfall variability in the Sahel represents the primary factor negatively affecting ecosystems [16-18].
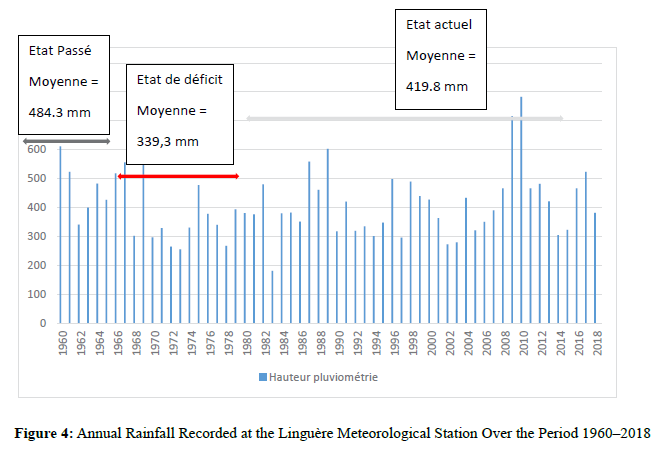
Species that have disappeared from the Ferlo region are generally those located beyond their optimal phytogeographical range, as moisture availability, soil conditions, and water reserves no longer meet their ecological requirements. Woody species tend to decline more rapidly during drought periods because soil water reserves are depleted faster. This justifies the use of rainfall data to calculate the relative severity of abiotic degradation. Rainfall data from the covering the period 1960–2018 were used in this analysis (figure 4).
Ecosystem collapse was defined as the mean annual rainfall during the period of severe rainfall deficit, following IUCN guidelines [19]. This value was estimated at 339 mm, leading to a collapse threshold range between 300 mm and 350 mm. To calculate the relative severity of rainfall decline, the rainfall time series was divided into two periods: a reference period (1960– 1969) and a current period (1984–2018). Because the collapse threshold is expressed as a range (300–350 mm), relative severity was calculated for both threshold values.
For the 300 mm threshold, relative severity was calculated as: Relative severity=Observed declineMinimum decline×100=(484.3−420)(484.3−300)×100=34.8%\text{Relative severity} = \frac{\text{Observed decline}}{\text{Minimum decline}} \times 100 = \frac{(484.3 - 420)}{(484.3 - 300)} \ times 100 = 34.8\%Relative severity=Minimum declineObserved decline×100=(484.3−300)(484.3−420)×100=34.8%
For the 350 mm threshold, relative severity was calculated as:
Relative severity=Observed declineMaximum decline×100=(484.3−420)(484.3−350)×100=47.87%\ text{Relative severity} = \frac{\text{Observed decline}} {\text{Maximum decline}} \times 100 = \frac{(484.3 - 420)}{(484.3 - 350)} \times 100 = 47.87\%Relative severity=Maximum declineObserved decline×100=(484.3−350) (484.3−420)×100=47.87%
The relative severity of abiotic environmental degradation therefore ranges between 34.8% and 47.87%, leading to the classification of the gallery forest ecosystem as Vulnerable (VU) under subcriterion C1.
Subcriteria C2 and C3 were assessed as Data Deficient (DD) due to the lack of sufficient quantitative information.
Criterion D: Degradation of the Biotic Environment Mortality of plant and animal species within the gallery forest ecosystem is driven by multiple factors, including land-use expansion, overgrazing, and bush fires. Although burned areas are recorded annually, available data do not extend back to 1965 and are not disaggregated by vegetation formation type. Other degradation processes have not been quantified. Consequently, the classification of the gallery forest ecosystem under Criterion D could not be completed due to insufficient data, and it was therefore assessed as Data Deficient (DD).
Criterion E: Quantitative Risk Analysis
The Ferlo Biosphere Reserve was formally designated in 2013, and no quantitative modeling has yet been conducted to estimate the probability of ecosystem collapse for gallery forests. As a result, the ecosystem was classified as Data Deficient (DD) under Criterion E.
Wooded Savanna in the Ferlo Biosphere Reserve Classification National Classification Wooded savanna is recognized as a distinct vegetation type in the Yangambi Agreement [20]. It has also been widely used in ecological studies to characterize vegetation formations in the Ferlo region [14,21,22]. This formation belongs to the broader savanna biome.
IUCN Habitat Classification Scheme (Version 3.0): 2. Savanna → 2.1 Dry Savanna → Wooded Savanna [6].
Ecosystem Description: Wooded Savanna
a. Biotic Characteristics
Within the Ferlo Biosphere Reserve, wooded savanna covers an area of 359,102.54 ha (359.11 km²) and is mainly distributed around temporary ponds. Characteristic woody species include Acacia senegal, Acacia nilotica, Acacia seyal, Piliostigma reticulatum, Mitragyna inermis, Anogeissus leiocarpus, Combretum glutinosum, Ziziphus mauritiana, Boscia senegalensis, and Guiera senegalensis. Sudano-Sahelian species such as and Acacia seyal are also present.
The herbaceous layer, which reaches its peak development at the end of the rainy season, is dominated by Zornia glochidiata, Schoenefeldia gracilis, Pennisetum pedicellatum, Polycarpaea linearifolia, Tephrosia bracteolata, Cenchrus ciliaris, and Dactyloctenium aegyptium.
Fauna is mainly composed of domestic livestock, which use these areas for watering during the rainy season and partially during the dry season. Nevertheless, several wild species are present, including mammals (hyena, warthog, gazelle) and birds (guineafowl, ostrich, francolin). Wildlife abundance increases during the rainy season, and competition between wild and domestic species for natural resources is observed.
b. Abiotic Characteristics
Wooded savannas in the Ferlo Biosphere Reserve occur under Sahelian climatic conditions, characterized by a dry season lasting more than nine months and a rainy season of approximately three months. The soils supporting this formation are mainly hydromorphic soils with temporary waterlogging. Surface water resources consist of temporary ponds, while groundwater resources are associated with the Maastrichtian aquifer and shallow continental aquifers. Moisture availability is relatively higher in these areas due to the presence of woody vegetation and the hydrographic network. Although air temperatures are generally high, microclimatic conditions within wooded savannas tend to be relatively cooler.
c. Distribution
Wooded savannas, like relict forests, are associated with the hydrographic network, forming discrete patches around ponds. They are mainly located in the northwestern and central-western parts of the study area.
d. Key Processes and Interactions
Major natural processes affecting wooded savannas include the early drying of ponds, sand encroachment, and water erosion.
e. Threatening Processes
At pond sites, the principal threat is sedimentation, resulting from intense water erosion combined with rainfall deficits. Vegetation surrounding these water points is also subject to strong anthropogenic pressure. The premature drying of certain ponds reflects human activities along their margins, particularly vegetation clearing, which accelerates erosion and leads to the deposition of sediments at the bottom of these biodiversity-rich water bodies.
The main drivers of vegetation degradation around ponds include tree cutting, bush fires, and overstocking due to high livestock densities.
f. Application of IUCN RLE Criteria
Criterion A: Reduction in Geographic Distribution
Criterion A1:
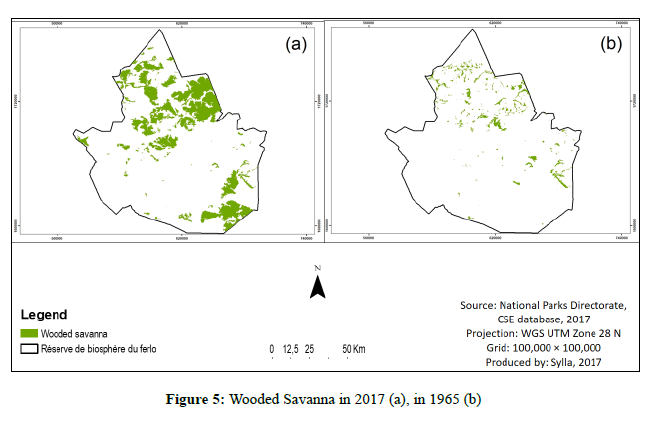
Criterion A1 evaluates the risk of ecosystem collapse by comparing ecosystem extent over a 50-year period, based on either absolute or proportional rates of decline. Wooded savanna covered 359,102.54 ha (359.11 km²) in 1965 and 59,409.13 ha (54.41 km²) in 2017 (figure 5). The total loss is therefore estimated at 305.02 km², corresponding to an average decline of 5.87 km² per year. The proportional rate of decline is 82%, which places the ecosystem in the Critically Endangered (CR) category under Criterion A1. Criterion A2a: based on an observed decline rate of 5.87 km² per year, projection over the next 50 years from 2017 indicates a complete loss of the remaining wooded savanna area by 2067. Under Criterion A2, the wooded savanna ecosystem is therefore classified as Collapsed (CO).
Criterion A3: No data were available for the reference year 1750, and Criterion A3 could not be assessed.
Criterion B: Restricted Geographic Distribution
Criterion B1 (Extent of Occurrence): the minimum convex polygon encompassing the entire wooded savanna ecosystem is estimated at 760,207 ha (7,602.07 km²). This extent of occurrence is below the 20,000 km² threshold and, given the observed continuing decline in ecosystem distribution, the wooded savanna meets the conditions for classification as Endangered (EN) under Criterion B1.
Criterion B2 (Area of Occupancy): the overlay of a 10 km × 10 km grid on the wooded savanna shows that the ecosystem is present in 71 grid cells, of which 21 cells contain at least 1 km² of wooded savanna (figure 6). This value, combined with the documented continuing decline in geographic distribution, supports the classification of the wooded savanna ecosystem in the Ferlo Biosphere Reserve as Vulnerable (VU) under Criterion B2.

Figure 6: Extent of Occurrence of the Wooded Savanna in the Ferlo Biosphere Reserve
Criterion B3: Number of Locations
Because the wooded savanna ecosystem occurs across multiple locations, it is classified as Least Concern (LC) under Criterion B3.
Criterion C: Degradation of the Abiotic Environment
The assessment follows the same rationale as applied to the gallery forest ecosystem.
Criterion D: Degradation of the Biotic Environment
Woody savanna species are subject to intensive exploitation by local populations, leading to high mortality rates. However, quantitative data on the extent of clearing and degradation of wooded savannas are not available. Consequently, the wooded savanna ecosystem is classified as Data Deficient (DD) under Criterion D.
Criterion E: Quantitative Risk Analysis
Because the Ferlo Biosphere Reserve was formally established in 2013, no quantitative modeling has been conducted to estimate the probability of ecosystem collapse for the wooded savanna ecosystem. It is therefore classified as Data Deficient (DD) under Criterion E.
Shrub-to-Tree Savanna in the Ferlo Biosphere Reserve
Classification
International classification: Shrub-to-tree savannas have been recognized as a distinct vegetation formation by Aubréville and Trochain. They were later conceptualized as ecosystems by Jacquin in his doctoral thesis on savanna vegetation dynamics in relation to fire use in Madagascar. Shrub-to-tree savannas occur in North Africa, South Asia, and South America [3,20,23,24].
IUCN Habitat Classification Scheme (Version 3.0):
2. Savanna → Wooded Savanna.
Ecosystem Description: Shrub-to-Tree Savanna
a. Biotic Characteristics
Shrub-to-tree savanna vegetation in the Ferlo Biosphere Reserve is Sahelo-Sudanian in character and is mainly distributed in the central-eastern and south-eastern parts of the study area. Dominant woody species include Guiera senegalensis, Pterocarpus lucens, Grewia bicolor, Acacia senegal, Balanites aegyptiaca, Commiphora africana, Combretum glutinosum, and Boscia senegalensis.
The herbaceous layer is dominated by Schoenefeldia gracilis, Zornia glochidiata, Pennisetum pedicellatum, Polycarpaea linearifolia, Tephrosia bracteolata, Cenchrus ciliaris, and Dactyloctenium aegyptium. Large woody species such as Adansonia digitata and Sterculia setigera, as well as tall grasses, previously occurred in this formation but have now disappeared or become very rare.
Wild fauna includes termites, birds, and mammals.
b. Abiotic Characteristics
Most shrub-to-tree savannas are located in the municipalities of Oudalaye and Ourosidy, which are subject to a southern Sahelian climate within the Ferlo valley. Mean annual rainfall ranges between 450 and 480 mm [25,13]. Rainfall variability is high, with a predominance of years below the long-term average since 1961. The rainy season lasts approximately three months, while the dry season extends over nine months.
The landscape consists of plateaus interspersed with dunes, and soils are predominantly sandy–silty, with a strong presence of ferruginous crusts. The hydrographic network is limited, comprising a few temporary ponds and groundwater resources associated with the Terminal Continental aquifer and the Maastrichtian aquifer. In this area, the shallow Terminal Continental aquifer is the main water source, as surface water bodies are scarce.
c. Distribution
Shrub-to-tree savanna occurs in the central-eastern and south- eastern parts of the study area, beyond the block formed by gallery forests, croplands, and bare soils. It covers approximately 29.7% of the local territory.
d. Key Processes and Interactions
Changes in the diversity of woody and herbaceous species represent the most important natural processes in savanna ecosystems. Drought events and anthropogenic pressures have led to the decline or disappearance of species unable to adapt (e.g. Dalbergia melanoxylon, Sterculia setigera) and the emergence of more resilient species (e.g. Calotropis procera, Boscia senegalensis).
Overgrazing, bush fires, and rainfall variability have altered herbaceous composition, with highly palatable species being replaced by less palatable ones. Both water and wind erosion are widespread in the Ferlo region and have a detrimental impact on vegetation.
e. Threatening Processes
Shrub-to-tree savannas in the Ferlo are threatened by a combination of climatic variability and anthropogenic pressures. Recurrent droughts (1970, 1984, 1990) and soil degradation have led to vegetation homogenization and steppe expansion. Vegetation formations that once occurred in northern Ferlo are now restricted to the south, where they form a more compact block.
Large plant species (Adansonia digitata, Sterculia setigera, Sclerocarya birrea, Dalbergia melanoxylon) and large animal species (large mammals, giant reptiles) have disappeared or become extremely rare due to their inability to adapt to current ecological conditions. Vegetation is increasingly dominated by species adapted to degraded environments (Balanites aegyptiaca, Boscia senegalensis, jackals) and by species characteristic of degraded areas (Calotropis procera, small reptiles).
Anthropogenic activities—including overgrazing, deforestation, pruning, and bush fires—further accelerate the degradation of woody and herbaceous vegetation. Woody species such as Acacia senegal, Dalbergia melanoxylon, Sclerocarya birrea, and Grewia bicolor experience high mortality and show signs of local disappearance.
Overgrazing and excessive pruning represent major constraints on vegetation recovery, as they limit growth, development, and natural regeneration. Bush fires cause losses in both ecosystem quality and extent [26].
f. Application of IUCN RLE Criteria
Criterion A: Reduction in Geographic Distribution
Criterion A1:
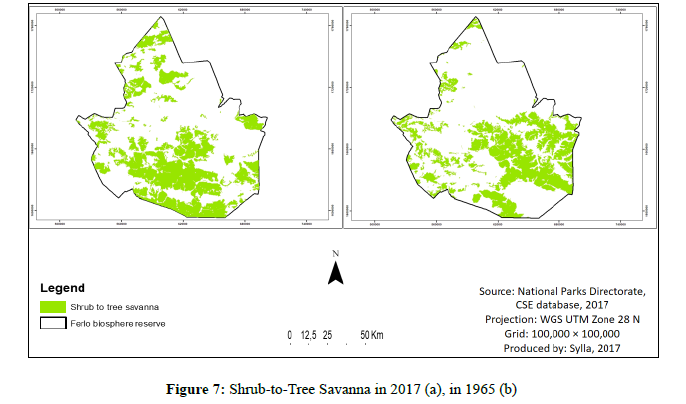
Statistics for shrub-to-tree savanna extent in 1965 (6,873.69 km²) and 2017 (6,024.2 km²) indicate a proportional rate of decline of 12% (figure 7). This value does not reach the threshold for a threatened category; therefore, under Criterion A1, the ecosystem is classified as Least Concern (LC).
Criterion A2a: Based on the same datasets, the annual rate of decline is estimated at 16.33 km² per year. Projected to 2067, shrub-to-tree savanna extent would decrease to 5,207.7 km², corresponding to a proportional decline of 63.54%. Under Criterion A2a, the ecosystem is therefore classified as Endangered (EN).
Criterion A2b and A2c:
No data were available for the year 1750; therefore, these subcriteria could not be assessed.
Criterion B: Restricted Geographic Distribution
Criterion B1 (Extent of Occurrence):
The extent of occurrence of the shrub-to-tree savanna ecosystem is estimated at 10,071.8 km². This value is below the 20,000 km² threshold, and a continuing decline in geographic distribution has been documented (see Criterion A1). Consequently, under Criterion B1, the shrub-to-tree savanna ecosystem is classified as Endangered (EN).
Criterion B2 (Area of Occupancy):
The shrub-to-tree savanna ecosystem occurs within 178 grid cells of 10 km × 10 km, of which 121 cells contain more than 1% of the total area of the ecosystem (figure 8). This value (178 grid cells) does not meet the threshold required for classification under Criterion B2. Therefore, under this criterion, the shrub-to- tree savanna ecosystem is assigned to the Least Concern (LC) category.

Figure 8: Extent of Occurrence and Area of Occupancy of the Shrub-to-Tree Savanna
Criterion B3: Number of Locations
Figure 8 shows that the shrub-to-tree savanna occurs across multiple locations (more than five). Consequently, the shrub-to- tree savanna ecosystem of the Ferlo Biosphere Reserve is classified as Least Concern (LC) under Criterion B3.
Criterion C: Degradation of the Abiotic
Environment Bush fires contribute to a reduction in savanna vegetation and may therefore compromise the viability of the biotic environment. However, burned areas have not been quantified separately for each vegetation formation type. As a result, the classification of the shrub-to-tree savanna ecosystem under Criterion C could not be completed and is assessed as Data Deficient (DD).
Criterion D: Degradation of the Biotic Environment
Several activities—including free-ranging livestock grazing, deforestation, overgrazing, bush fires, excessive tapping of Acacia senegal, disturbance of wildlife habitats, water and wind erosion, and poaching—are likely to degrade the biotic environment. However, the impacts of these pressures on vegetation and fauna have not been quantitatively assessed. Consequently, the ecosystem is classified as Data Deficient (DD) under Criterion D. Criterion E: Quantitative Risk Analysis (Modeling)
No quantitative modeling has been conducted to estimate the probability of ecosystem collapse for the shrub-to-tree savanna ecosystem. The ecosystem is therefore classified as Data Deficient (DD) under Criterion E.
Synthesis of ecosystem collapse risk in the Sylvopastoral and Biosphere Reserves of the Ferlo
In the preceding sections, the ecosystems selected for assessment were evaluated and assigned to one of the eight IUCN Red List of Ecosystems categories for each assessment criterion. According to the IUCN framework, the highest level of risk indicated by any single criterion determines the final risk category assigned to each ecosystem [3].
This table synthesizes all assessment results to determine the final ecosystem collapse risk category, which is presented in the following table
|
Ecosystems |
Assessment Criterion A: Spatial distribution |
Criterion B: Restricted extent |
Final assessment |
|||
|
Sub-criterion |
A 1 |
A 2 a |
B 1 |
B 2 |
B 3 |
|
|
Forest relic |
VU |
VU |
EN |
LC |
LC |
EN |
|
Wooded savanna |
EN |
CO |
EN |
VU |
LC |
CO |
|
Shrub to tree savanna |
EN |
EN |
EN |
LC |
LC |
|
Table 1: Summary of the Assessment of Ecosystems in the Ferlo Biosphere Reserve and the Six Boreholes Sylvopastoral Reserve
Discussion
Influence of Climate Variability and Anthropogenic Pressures
The Sahel is strongly influenced by climate variability and anthropogenic activities, and the current state of its ecosystems— regarding spatial distribution, structure, functioning, species composition, and dynamics—is the result of the combined effects of these drivers.
Decline in Geographic Distribution and Restricted Range Relict forests, wooded savannas, shrub-to-tree savannas, and tree savannas represent the most stable formations within spontaneous vegetation succession. Located in a Sahelian climatic context, the Ferlo region—historically more wooded— has been profoundly affected by recurrent drought events and intense human pressures. As a result, a reduction in the extent of stable natural vegetation formations has been observed, in favor of formations better adapted to current environmental conditions.
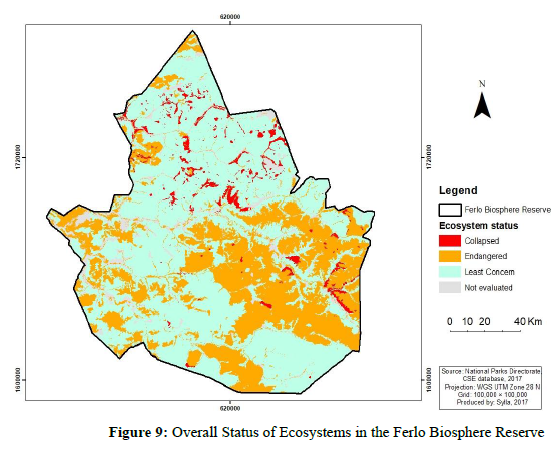
This trend is reflected in the assigned collapse risk categories: Endangered (EN) for relict forests, Collapsed (CO) for wooded savannas, and Endangered (EN) for shrub-to-tree savannas. Despite the lack of historical vegetation data for the year 1750, robust results were obtained using datasets spanning a 50-year period. Numerous studies indicate that ecosystem degradation in the Ferlo began in the 1950s, coinciding with the southward migration of isohyets, and intensified during major drought episodes (1970, 1972, 1984, among others). Consequently, a 50-year temporal window appears appropriate for ecosystem assessments in Sahelian environments. Our findings are consistent with previous studies conducted in the Ferlo using the same methodology as well as with broader-scale analyses employing different approaches that documented the widespread disappearance of characteristic woody species [8,17]. Beyond Senegal, similar degradation trends have been reported in other Sahelian regions, such as the Bourztanga watershed in Burkina Faso, where declines in open forests, wooded savannas, and tiger bush formations, alongside the expansion of shrub savannas, were observed over a 39-year period.
Species with Sudano-Sahelian or Sudanian phytogeographical affinities, described in earlier studies have become increasingly rare or are nearly absent in recent vegetation surveys [17,27-30]. This decline can largely be explained by the southward shift of the 400 mm isohyet and successive droughts, which have led to soil degradation and depletion of groundwater reserves. These species were no longer able to adapt to the reduced moisture availability.
Under conditions of increased rainfall irregularity, species better adapted to arid environments have expanded, and vegetation formations have reorganized along a north–south gradient driven by rainfall and soil conditions. Steppes and shrub savannas have expanded and now dominate the northern and central parts of the Ferlo, whereas tree savannas have almost disappeared from these areas. They are currently restricted to the southern Ferlo, forming a compact block with other savanna units, which increases their vulnerability to additional disturbances.
This homogenization of vegetation formations, which undermines ecological balance, has been widely reported in recent studies in the Ferlo and across the Sahel more broadly further supporting the classification of these ecosystems as threatened [8,17,31,32,].
Anthropogenic pressures have exacerbated the vulnerability of ecosystems already weakened by climatic stress. Changes in traditional pastoral land management, combined with the sedentarization of pastoralists around water points (ponds and boreholes), have led to extensive deforestation and the expansion of cultivated areas, particularly in depressions formerly occupied by gallery forests and wooded savannas. These processes have severely altered the landscape.
In pastoral zones, overstocking has degraded rangelands, areas surrounding water points have become nearly bare, and the early drying of ponds has intensified competition between domestic livestock and wildlife, leading to the decline of wild species. Bush fires, wind erosion, and water erosion further modify landscape structure and composition. In agropastoral zones, land clearing for cultivation compounds these pressures.
The Ferlo landscape, including protected areas, is now structured along three major gradients: climatic (rainfall), pedological, and anthropogenic. These findings confirm previous studies based on woody vegetation inventories which documented a northward dominance of steppe formations and a southward dominance of savannas, alongside the emergence of drought-tolerant species such as Boscia senegalensis and Calotropis procera, and the near disappearance of Sudano-Sahelian species such as Adansonia digitata, Anogeissus leiocarpus, Combretum aculeatum, Cadaba farinosa, Sclerocarya birrea, and Guiera senegalensis. Despite methodological differences, both our study and previous work consistently point to ecosystem degradation and steppe expansion [17,30].
Biotic and Abiotic Environments
Assessment of ecosystems under Criteria C and D requires data on the status of keystone species (health and population structure), changes within dominant species communities, disturbance regimes, population trends of regulating, invasive, or pathogenic species, and the impacts of human management.
In the Ferlo, data on rainfall, burned areas by ecosystem type, climate scenarios, and cultivated land extent could potentially be used to assess collapse risk under these criteria. However, such datasets are largely unavailable, incomplete, or too recent in the Ferlo, in Senegal, and more broadly across Africa, limiting their applicability for ecosystem classification. As a result, all ecosystems assessed in this study were classified as Data Deficient (DD) under Criteria C and D. Similar limitations have been reported in other studies, including the assessment of Gonakier forests in Senegal the Ferlo watershed ecosystems in Madagascar and tidal flats of the Yellow Sea [3,8,3,7]. In these studies, ecosystem collapse risk was primarily determined using distribution-based criteria. According to the IUCN Red List of Ecosystems framework, this approach remains valid, as the highest risk category assigned by any single criterion determines the final classification.
Discussion of the Methodology
The IUCN Red List of Ecosystems methodology is relatively recent, with its first application reported in 2010 in Venezuela [11]. It was designed to be applicable across all biomes and spatial scales, providing a widely recognized scientific framework for identifying, assessing, and monitoring ecosystems with the highest probability of collapse at local, regional, and global scales.
In this study, the method was applied at a local scale in a Sahelian environment to test its applicability. Numerous studies have applied the same framework in different ecological contexts and at various scales demonstrating its broad relevance [3-7]. The method evaluates ecosystems using five criteria—spatial distribution, restricted distribution, biotic and abiotic degradation, and quantitative analysis—and classifies them into eight threat categories based on predefined thresholds.
Its application requires specific datasets:
• Spatial distribution: data on ecosystem extent over a 50-year period, including past and projected trends. These data can be derived from cartographic sources (e.g. 1965–2015) and future projections based on observed annual decline rates.
• Restricted distribution: the area of the minimum convex polygon encompassing the ecosystem and the number of 10 km × 10 km grid cells in which the ecosystem occupies more than 1% of the cell area.
• Biotic and abiotic degradation: identification and quantification of major threats affecting ecosystem functioning, followed by calculation of relative severity.
• Criterion E: quantitative modeling data estimating the probability of ecosystem collapse.
While data required for the first two criteria can generally be obtained, historical data dating back to 1750 are rarely available. Data on biotic and abiotic degradation are often scarce, and identifying the most influential threat can be subjective and difficult to quantify, potentially leading to variability among assessments.
Conclusion
This study aimed to assess ecosystem collapse risk using the IUCN Red List of Ecosystems framework and demonstrates that vegetation formations in the Ferlo Biosphere Reserve—including relict forests, wooded savannas, and shrub-to-tree savannas— are highly threatened by rainfall variability and anthropogenic pressures.
The classification results were primarily derived from distribution- based criteria, as other criteria could not be applied due to data limitations. Nevertheless, this classification is considered robust, as ecosystem degradation is clearly expressed through a reduction in spatial extent relative to 1965 and the conversion of stable vegetation formations into less stable units.
Relict forests are mainly threatened by aridification, recurrent droughts, and the expansion of cultivated areas, while savannas are subject to frequent bush fires, water and wind erosion, and overexploitation of rangelands and woody resources.
Overall, the limited availability and quantification of data on biotic and abiotic disturbances remain a major constraint for ecosystem assessments in Sahelian environments, underscoring the need for long-term, ecosystem-specific monitoring systems to support future applications of the IUCN Red List of Ecosystems [33-40].
References
- Millenium Ecosystem Assessment (MEA). 2010. Ecosystem and well being : A framework for assessment. Washington DC: Island Press Blurb.
- Lead, C., de Groot, R., Fisher, B., Christie, M., Aronson, J., Braat, L., ... & Shmelev, S. (2010). Integrating the ecological and economic dimensions in biodiversity and ecosystem service valuation. The Economics of Ecosystems and Biodiversity: The Ecological and Economic Foundations (Bd. 1). Abingdonâ?onâ?Thames, UK: Taylor and Francis.
- Keith, D. A., Rodríguez, J. P., Rodríguez-Clark, K. M., Nicholson, E., Aapala, K., Alonso, A., ... & Zambrano- Martínez, S. (2013). Scientific foundations for an IUCN Red List of Ecosystems. PLOS one, 8(5), e62111.
- Mac Nally, R., Horrocks, G., Pettit, N. E., & Davies, P. M. (2013). The floodplain ecosystem of river red gum and black box, south-eastern Australia. Scientific foundations for an IUCN Red List of Ecosystems. PLoS ONE Supplementary Material, 12 p.
- Holdaway, R. J., Wiser, S. K., Williams, P. A., & King, W. M. (2013). Granite Gravel Fields and Sand Plains, New Zealand. Scientific foundations for an IUCN Red List of Ecosystems. PLoS ONE Supplementary Material, 8(5), 6 p.
- Keith et Spalding. 2013. UICN habitats classification sheme. caribbean_coral_reef. Keith, D. and Spalding, M. (2013). Caribbean Coral Reefs, 167-171. Supplementary Material Appendix S2. Scientific Foundations for an IUCN Red List of Ecosystems. PloS ONE, 8(5):e62111.
- Murray, N. J., Ma, Z., & Fuller, R. A. (2015). Tidal flats of the Y ellow S ea: A review of ecosystem status and anthropogenic threats. Austral Ecology, 40(4), 472-481.
- Ba T. 2017. Dynamique spatio-temporelle des écosystèmes dans le bassin versant du Ferlo. Thèse de doctorat unique en écologie, agroforesterie, ED SEV/ UCAD. 113 p
- Ngom, D., Fall, T., Sarr, O., Diatta, S., & Akpo, L. E. (2013). Caractéristiques écologiques du peuplement ligneux de la réserve de biosphère du Ferlo (Nord Sénégal). Journal of Applied Biosciences, 65(0), 5008-5023.
- Keith, D. A., Rodríguez, J. P., Rodríguez-Clark, K. M., Nicholson, E., Aapala, K., Alonso, A., Asmussen, M., Bachman, S., Bassett, A., Barrow, E. G., Benson, J. S., Bishop, M. J., Bonifacio, R., Brooks, T. M., Burgman, M. A., Comer, P. J., Comín, F. A., Essl, F., Faber-Langendoen, D., Fairweather, P. G., Holdaway, R. J., Jennings, M., Kingsford,R. T., Lester, R. E., Mac Nally, R., McCarthy, M. A., Moat, J., Oliveira-Miranda, M. A., Pisanu, P., Poulin, B., Riecken, U., Spalding, M. D., & Zambrano-Martínez, S. (2011). Scientific foundations for an IUCN Red List of Ecosystems. PLoS ONE, Supporting Information, 86 p.
- Rodríguez, J. P., Keith, D. A., Rodríguez-Clark, K. M., Murray, N. J., Nicholson, E., Regan, T. J., ... & Wit, P. (2015). A practical guide to the application of the IUCN Red List of Ecosystems criteria. Philosophical Transactions of the Royal Society B: Biological Sciences, 370(1662), 20140003.
- SYLLA D, Ba Taibou, Guisse Aliou. 2017. Dynamique spatio-temporelle de l’occupation du sol dans la réserve de biosphère du Ferlo de 1965 à 2017.
- Sarr, M. A. (2009). Évolution récente du climat et de la végétation au Sénégal: Cas du Bassin versant du Ferlo (Doctoral dissertation, Lyon 3).
- Centre de Suivi Ecologique (CSE). 2014. Rapport de caractérisation de l’unité pastorale de Moguere. Ministère de l’agriculture et de l’équipement rural, Projet d’appui à la sécurité alimentaire Pasa Loumakaf. Dakar. 20 p
- Centre de Suivi Ecologique (CSE). 2015. Rapport de caractérisation de l’unité pastorale de Thiel. Ministère de l’agriculture et de l’équipement rural, Projet d’appui à la sécurité alimentaire Pasa Loumakaf. Dakar. 24 p
- Pieri, C. (1989). Fertilité des terres de savanes.
- Diouf, J. C. (2011). Dynamique du peuplement ligneux au Ferlo (Nord-Sénégal), conséquences et perspectives pour une gestion durable. Doctorat de 3ème cycle de Biologie Végétale, Option: Écologie. Faculté des Sciences et Techniques de UNIVERSITE CHEIKH ANTA DIOP DE DAKARDépartement de Biologie Végétale 263p.
- Marega, O., Fall, A., Mering, C., & Salem, A. (2013). Paroles d’éleveurs: perceptions, pratiques, stratégies pastorales dans le Sahel sénégalais (Ferlo). Lexicometrica.
- Bland, L. M., Keith, D. A., Miller, R. M., Murray, N. J., & Rodríguez, J. P. (2017). Guidelines for the application of IUCN Red List of Ecosystems Categories and Criteria, version 1.1. International Union for the Conservation of Nature, Gland, Switzerland.
- Aubréville, A. (1957). Accord à Yangambi sur la nomenclature des types africains de végétation. BOIS & Forets Des Tropiques, 51, 23-27.
- Ba, T. 2011. Dynamique de l’occupation des sols de la communauté rurale de BAKEDJI au Ferlo (Sénégal). Mémoire de DEA, BV, FST, UCAD (Sénégal). 65 p.
- Sylla D. 2015. Etat actuel et dynamique de l’occupation du sol de la communauté rurale de Tessékéré de 1984 à 2015. Mémoire de master agroforesterie, écologie et adaptation, BV/ FST/ UCAD. 35 p
- Trochain, J. L. (1957). Accord interafricain sur la définition des types de végétation de l’Afrique tropicale. Institut d’études centrafricaines.
- Jacquin, A. (2010). Dynamique de la végétation des savanes en lien avec l’usage des feux à Madagascar: Analyse par série temporelle d’images de télédétection (Doctoral dissertation, Institut National Polytechnique de Toulouse-INPT).
- Aubert, G. (1949). Les sols du Sénégal. Dakar, Sénégal :Institut Français d’Afrique Noire (IFAN), Mémoire n°12.
- MEDD (2014). Stratégie nationale de gestion des feux de brousse au Sénégal. Ministère de l’Environnement et du Développement Durable, Dakar, Sénégal.
- Poupon, H. (1980). Structure et dynamique de la strate ligneuse d’une steppe sahélienne au nord du Sénégal (Vol. 115). IRD Editions.
- Ndong, A. 2016. Etude de l’histoire et de l’état de la végétationdu Ferlo au Nord du Sénégal. Thèse de doctorat, spécialité Ecologie et agroforesterie, UCAD, Dakar. 161p.
- Bakhoum, A. (2013). Dynamique des ressources fourrageres: indica-teur de resilience des parcours communau-taires de TESSEKERE AU FERLO,(NORDSENEGAL)[Biologie,Productions et Pathologies Animales]. UNIVERSITE CHEIKH ANTA DIOP DE DAKAR.
- NDIAYE, O. (2013). Caractérisation des sols, de la flore et de la végétation au Ferlo (Doctoral dissertation, Thèse de doctorat, Université Cheikh-Anta-Diop (UCAD), Dakar (Sénégal)).
- Jauffret, S. (2001). Validation et comparaison de divers indicateurs des changements à long term dans les écosystèmes méditerranéens arides: application au suivi de la désertification dans le Sud tunisien (Doctoral dissertation, Aix-Marseille 3).
- Botoni, H. E. (2003). Interactions Elevage-Environnement. Dynamique des paysages et évolution des pratiques pastorales dans les fronts pionniers du Sud-Ouest du Burkina Faso (Doctoral dissertation, UPV).
- Achard, F., Eva, H. D., Stibig, H. J., Mayaux, P., Gallego, J., Richards, T., & Malingreau, J. P. (2002). Determination of deforestation rates of the world’s humid tropical forests. Science, 297(5583), 999-1002.
- Keith Djetdal.f2013. Scientific Foundations for an IUCN Red List of Ecosystems. M. Convertino (ed.), PLoS ONE, 8(5): e62111.
- Malou R et al,. Influence du climat sur les ressources en eausouterraines des zones soudano sahélienne. Abs article. 14 p
- Nicholson, E., Keith, D. A., & Wilcove, D. S. (2009). Assessing the threat status of ecological communities. Conservation Biology, 23(2), 259-274.
- Pickett, S. T., & Cadenasso, M. L. (2002). The ecosystem as a multidimensional concept: meaning, model, and metaphor. Ecosystems, 5(1), 1-10.
- Tansley, A. G. (1935). The use and abuse of vegetationalconcepts and terms. Ecology, 16(3), 284-307.
- Union Internationale pour la Conservation de la Nature (UICN). (2015).
- La Liste rouge des écosystèmes de l’UICN : catégories et critères. UICN, Gland, Suisse.
- Yonkeu, S., Tchawa, P., & Ndzié, J. P. (2010). Dynamique de la végétation et dégradation des terres dans le bassin versant de Bourzanga (Burkina Faso). Sécheresse, 21(3), 181–191