
Journal of Educational & Psychological Research(JEPR)
ISSN: 2690-0726 | DOI: 10.33140/JEPR
Impact Factor: 1.4

Research Article - (2026) Volume 8, Issue 1
Early Cognitive Abilities Associated with Later Academic Functioning in Neurotypicals and Young Children with Williams Syndrome: A Longitudinal Study
Received Date: Jul 23, 2025 / Accepted Date: Sep 30, 2025 / Published Date: Feb 19, 2026
Copyright: ©2026 Melanie A Porter, et al. This is an open-access article distributed under the terms of the Creative Commons Attribution License, which permits unrestricted use, distribution, and reproduction in any medium, provided the original author and source are credited.
Citation: Reeve, J. L., Porter, M. A. (2026). Early Cognitive Abilities Associated with Later Academic Functioning in Neurotypicals and Young Children with Williams Syndrome: A Longitudinal Study. J Edu Psyc Res, 8(1), 01-26.
Abstract
Williams Syndrome (WS) is associated with poor academic performance, and reduced educational attainment, with research consistently finding literacy and numeracy impairments across the lifespan in WS. To date, however, most studies have focused on older children and adults, with little research on early development of academic functioning in WS. The present research investigates emerging reading and mathematical abilities in young children with WS and examines potential early cognitive abilities associated with later academic functioning. The present research aimed to identify the early academic profile of young children with WS and to examine the relationship between academic functioning and demographic variables. Early cognitive abilities associated with later academic functioning were also investigated. The performance of the WS group was compared to a typically developing control group matched on chronological age, socio-economic status, and parental education. Participants included 20 young children with WS and 40 typically developing children, aged between 2 to 7 years (at initial testing), who completed a comprehensive developmental and academic assessment, utilising standardised measures (the Mullens Scale of Early Learning and the Wechsler Individual Achievement Test, Second Edition) that contained normative data appropriate for our young WS sample in terms of both mental age and chronological age [1,2]. Young WS children exhibited relative impairments in mathematical abilities compared to single word reading, but both areas were generally below chronological age expectations. Lower levels of developmental/intellectual functioning, executive functioning, and attentional difficulties were found to be associated with reduced academic outcomes in young WS children. For typically developing children, only attention and behavioural measures predicted later academic outcome, not earlier levels of developmental/intellectual functioning. Considerable variability was evidenced in early academic abilities, including whether mathematics was a relative area of weakness compared to reading, confirming the importance of individual assessments, and developing individualised educational provisions and learning support for this neurodevelopmental population.
Keywords
Williams Syndrome, Preschool, Primary School, Literacy, Numeracy, Reading, Mathematics, LongitudinalIntroduction
Literacy and numeracy abilities are key indicators of academic achievement, important for later employment, and allow a person to participate in society with more independence [3,4]. Developing these academic skills is just as important for people with an intellectual disability, as it increases levels of adaptive functioning, enables them more independence, and contributes to their quality of life and mental health [5-7]. Investigating academic abilities and the factors that affect literacy and numeracy development in individuals with Williams syndrome (WS), who typically have a mild to moderate intellectual disability and specific learning disabilities (SLD), is essential [8-10]. To date, however, this area of research has received relatively little attention, with a clear lack of longitudinal research. WS is associated with impairments in literacy and numeracy, although the exact prevalence of SLD remains unclear. Also, while reading skills are generally considered to be stronger than numerical abilities, most literacy research in WS has focused on single word reading and decoding (rather than, for example, reading rate and reading comprehension or spelling ability), and very few studies have directly compared the various aspects of literacy and numeracy all together in the one study [9-12]. Moreover, methodological differences across studies make it hard to directly compare findings, with different measurement tools used and different definitions of what constitutes a literacy or numeracy impairment. Most studies have also focused on older children and adults, with little research on early development of academic functioning in WS.
The current study investigated early literacy and numeracy development in a young sample of children with WS and in neurotypical controls, focusing on single word reading (real words and nonwords) and mathematical abilities (numerical calculation and numerical problem-solving). By adopting a longitudinal study design, the present research also examined early cognitive correlates of later academic functioning (approximately 3.5 years later). As previous studies with TD, intellectual disability, and older WS populations have linked cognitive factors to academic outcomes, particularly IQ, executive functioning, and attention, these variables were the focus of the current research [13-17].
Williams Syndrome
Williams syndrome (WS) is a neurodevelopmental disorder caused by a hemizygous microdeletion spanning approximately 26 to 28 genes on chromosome 7q11.23 [18-21]. The prevalence of WS has been estimated to be somewhere between 1 per 20,000 and 1 per 7,500 [22-24]. The neurodevelopmental phenotype of this syndrome is distinct and multifaceted. Developmental delay and subsequent intellectual disability is almost universal, although there is evidence of intellectual variability with Full-Scale IQ ranging from the profoundly impaired range to average in school-aged children and adults with WS [8,11,25]. WS research also suggests relative strengths in expressive vocabulary, visual memory, verbal short-term memory, phonological awareness, and nonverbal reasoning, and relative weaknesses in visuospatial skills, receptive grammar, and comprehension/relational language and pragmatics [8,26-30]. However, again, this profile is not always reflected at an individual level, with vast clinical variability [26,31,32]. The WS phenotype also includes hypersociability and high levels of generalised anxiety and specific phobias, with a lower prevalence of social phobia across the life span [33,34]. Attentional difficulties are also well documented in the WS literature and a diagnosis of Attention-Deficit/Hyperactivity Disorder (ADHD) is common, with the overall prevalence estimated to be 55% for preschool children and between 33% and 80% for school-aged children and adolescents with WS [11,35,36]. The likelihood of an ADHD diagnosis is comparable for females and males with WS, unlike the typical male bias in the general population [34]. The prevalence of Autism Spectrum Disorder (ASD) is also higher in WS than it is in the typically developing population [11]. Furthermore, individuals with WS display deficits in executive functioning, typically in: working memory; inhibition; initiation; cognitive flexibility (i.e., shifting); planning and organisation, and self- and task-monitoring, although age-related changes in the manifestation of each executive component has been suggested [37-40]. This unique pattern of strengths and weaknesses in WS suggests that educators, clinicians, and other professionals will require specific knowledge, educational provisions, and evidence-based interventions to appropriately support the complex needs of children with WS and maximise their learning and academic achievements.
Reading Ability and WS
Research has consistently reported reading difficulties amongst WS individuals, with a recent study reporting that only 27% were reading at a basic functional level, with about 93% of WS children and adults (aged 9 to 35 years; Mage = 21.0 years; N = 30) able read at least a few words [5]. Indeed, even after excluding individuals who were not able to read any words at all, the average reading age (single word tasks) for WS adults was reported to be approximately 8 years, 8 months, further indicating that the reading abilities of this population are below the level of functional literacy even after completing formal schooling [41].
Longitudinal studies have identified limited improvement in reading over time in older children and adults with WS. For example, although scores on measures utilised were not directly comparable (i.e., Time 1: Neale Analysis of Reading; Time 2: Wechsler Objective Reading Dimensions (WORD), Udwin et al. reported a slight (nonsignificant) increase in reading accuracy scores and a significant reduction in reading comprehension scores over an almost 9-year interval in 23 adolescent and adult WS individuals, indicating the gap in ability level between typically developing controls and WS individuals is widening with chronological age (Time 1: aged 10 to 15 years, Mage = 12.92 years, N = 44; Time 2: aged 19 to 24 years, Mage = 21.75 years) [42-45]. Later, the same researchers1 reported that one quarter of their WS adult sample remained at floor on the WORD reading measure at follow-up testing [41]. Udwin et al. and Howlin et al. suggested that the lack of progress may be due to the limited literacy support provided to students with additional needs.
Delayed and atypical developmental patterns in early reading have also been reported in WS [46,47]. In their 12-month longitudinal study, Steele and colleagues found that children with WS (aged 5 to 8 years at Time 1; Mage = 6.5 years; N = 26) and Down syndrome (DS; aged 5 to 8 years at Time 1; Mage = 6.92 years; N = 26) showed reduced improvement on (non-standardised) single-word reading tasks2 over time compared to TD controls matched on reading ability (aged 4 to 5 years at Time 1; Mage = 5.08; N = 41) [47]. Steele et al. also explored the association between specific language capabilities and early single word reading, and found that increased vocabulary was the only significant predictor for young WS and DS children⸻in contrast to the TD controls, where greater phonological awareness and letter knowledge were also found to predict single word reading development. Furthermore, when WS and DS groups were compared directly, better vocabulary and phonological skills (phoneme and rhyme matching) predicted a smaller improvement in reading for WS. Interestingly, these precursor language skills for WS were equivalent to TD controls at Time 1, which poses the question of whether factors impacting later reading ability extend beyond specific language skills to other areas of cognitive processing, for example, attention, IQ, or executive functioning.
As the genetic and cognitive heterogeneity outlined above may suggest, studies have demonstrated a wide range of reading abilities in WS [5]. For example, several studies have reported a proportion of WS individuals who were not able to read any words at all, and this did not always relate to IQ levels [5,9,41,45,48-50]. In contrast, studies have identified some WS individuals to be reading in the average range or at their chronological age/grade level [10,27,51]. Heterogeneity has also been established with nonword reading abilities (phonological decoding), as skills also ranged from average levels to an inability to read any nonwords [27,50,52,53]. Despite the wide variability in reading skill, early cognitive characteristics associated with reading abilities for WS individuals remains relatively unexplored. This limited literature is discussed in detail below.
Mathematical Ability and WS
Notwithstanding the scant literature examining mathematical skills in WS individuals, especially relative to the literacy research, studies have repeatedly found, on average, mathematical abilities to be impaired, or as most studies define impairment, below mental age levels [10,13,41,44,54,55]. Learning numeracy skills is thought to require the early development of core representations [56]. In WS infants and toddlers, such core representations, like magnitude (i.e., how much) and object representations, appear to be relatively typical, however limitations become evident by maturity, suggesting an abnormal developmental trajectory [54,56-58]. Neuroanatomically, the mathematical impairments reported in WS individuals also appear to be consistent with neurological data, with the reduced grey matter and hypoactivation in areas of the parietal region of the brain being areas involved in mathematical processing as well as visuospatial abilities and visual attention [56].
A recent systematic review by Van Herwegen and Simms reported that mathematical skills in WS individuals generally do not exceed the ability level of 8- to 9-year-old neurotypical children, and show a particular difficulty with symbolic and non-symbolic magnitude representation, with better performance on more verbal aspects of mathematics [7]. For example, several studies using different age groups, different control groups, and different methodologies have shown that people with WS generally know the names of numbers and can complete basic forward counting tasks, however cardinality skills (i.e., understanding concepts associated with counting, or how many items in a group/set) were found to be particularly problematic [13,59-62]. This finding is consistent with the bilateral reduction of grey matter and connectivity in the intraparietal sulcus (IPS) evident in children and adults with WS, and is in line with the literature reporting a gap between language production and language comprehension abilities [28,63].
As mentioned above, there has also been some suggestion that mathematical development in WS follows an atypical developmental pathway [7]. A recent cross-sectional study by Van Herwegen et al. explored the developmental trajectories of mathematical ability in school-aged children and adults with WS (aged 8 to 51 years; Mage = 19.41 years; N = 24) and DS (aged 8 to 49 years; Mage = 21.85 years; N = 26), compared to mental age matched TD controls (aged 4 to 10 years; Mage = 6.37 years; N = 26) [64]. Using the Numerical Operations subtest from the Wechsler Individual achievement Test (WIAT), they found that, whilst scores increased significantly with chronological age in the TD group, mathematic computational skills were delayed for both the neurodevelopmental groups and developed in line with their overall mental age [65]. Steele and Brown et al., however, reported mathematical performance to be above overall mental age, with other studies finding a particular association with nonverbal mental age [44,62]. Furthermore, the understanding of counting (i.e., cardinality skills) has been shown to be associated with verbal abilities, rather than visuospatial abilities as reported in the TD population, suggesting that that these skills are not only delayed but also atypical in WS individuals [13]. Heterogeneity in mathematical abilities is also evident across the WS literature, for example, some individuals have been shown to perform arithmetic at year-11 levels and others not able to answer any calculation problems at all [12,41,61,66]. However, as most studies include WS individuals over a wide age range it is not clear if this variability is due to developmental ability or a syndrome-specific phenotype. As such, although all studies are reporting mathematical abilities as delayed, the extent and underlying causes of this delay remains unknown. Moreover, mental age equivalent scores are known to be very unreliable, and the use of standard scores, both for academic abilities and for IQ scores should, ideally, be compared to enhance accuracy [67].
To date, only two research studies have investigated the longitudinal development of mathematical abilities in WS and, like with the reading literature, these studies suggest very limited improvement in mathematical abilities over time. Firstly, as described above, Udwin, Howlin, and colleagues provided longitudinal insights for a group of WS adults by utilising data from their earlier studies [12,41,44,45]. To explore mathematical skills, the WS participants were assessed using the Arithmetic subtest on the Wechsler Intelligence Scale for Children, revised (WISC-R) at Time 1, and, although participants were out of the normative age range, the Arithmetic subtest on the Wechsler Intelligence Scale for Children, Third Edition (WISC-III) was utilised at Time 2 [68,69]. Findings for Udwin et al. showed a decline in performance in the follow¬up study of young WS adults, however some caution is required when interpreting these results as the measures were not directly comparable (i.e., scores are typically lower on the WISC-III than the WISC-R [44,70,71]. Also, this subtest is arguably not an ideal measure of numerical abilities, as it can also be a measure of working memory, verbal processing, and processing speed, among other things. As such, the authors surmised that, although there was no notable improvement overall, the scores did not reflect a true decline. In their 1998 follow-up study, Howlin et al. reported that their sample of WS adolescents did not display a substantial increase in their WISC-III Arithmetic scores as they reached adulthood, despite maintaining their general cognitive ability levels [41]. Overall, age-equivalent scores were around the 7- to 8-year level, however, only 16 individuals were able to achieve a score above the basal level (6 years, 1 month). In an attempt to make the different Wechsler versions more comparable, Howlin et al. adjusted the scores on the WISC-III [12]. Despite this, graphical displays show the mean arithmetic scores for their sample of 47 WS adults to be lower at their 12-year follow-up (Time 1: aged 19 to 38 years, Mage = 25.75; Time 2: aged 25 to 49 years, Mage = 36.83)⸻although it is unclear if this result was significant. Of note, however, only 18 participants in the Howlin et al. sample had a genetically confirmed diagnosis of WS (Fluorescence in Situ Hybridization [FISH] test), with the remainder diagnosed based on clinical characteristics [12,18,23,72]. In a more recent 12-month longitudinal study looking at early mathematical abilities, Steele and Brown et al. included 27 WS children (Mage = 6.7 years; no age range available) using the Test of Early Mathematics Ability, Third Edition (TEMA-III) and found that numerical and cardinality abilities improved over time in this young cohort [62,73].
Although several WS studies have investigated whether mathematical performance is in line with mental age, very few studies have examined specific skills and general cognitive predictors, and, as such, very little is known about what impacts mathematical development. Within the specific skill research with WS children, and in line with the TD literature, findings have shown mathematical abilities are associated with a non-symbolic Approximate Number Sense task (ANS; a non-verbal task that measures large number discrimination without counting or numerical symbols), and estimation abilities, particularly in early development [61,64]. Furthermore, Steele and Brown et al. found cardinality skills were a unique predictor of increased early mathematical abilities [62]. In terms of general cognitive processes, aspects of attention, IQ, particularly verbal intellect, and executive functioning have all been suggested to impact mathematical abilities in the WS population [13,46,74].
The Role of Cognition in Academic Functioning in WS
Intellectual Functioning
Findings to date have shown very mixed results regarding the relationship between IQ and academic functioning in WS individuals. In the literacy domain, for example, Pagon et al. explored the reading abilities of nine school-aged children and adults (aged 10 to 20 years; Mdn = 13 years) [10]. Although statistical analyses were not performed, the authors described that an individual’s reading skills3 were qualitatively higher relative to their Full-Scale IQ (FSIQ; mean reading ability/FSIQ difference being 19 points)-great variability was noted, however, with one individual only displaying a 1-point difference. Several WS studies have also found that reading ability was on par with overall IQ. For example, Levy and Antebi found (single word) real word and nonword reading scores were significantly and positively correlated with FSIQ for their WS sample (aged 11 to 22 years; Mage = 16.17 years) [51]. Levy et al. reported that WS individuals aged 12 to 20 years (Mage = 16.42 years) with a FSIQ in the mild impairment range (i.e., scores ranging from 50 to 70) were reading at this IQ level, whereas individuals with a FSIQ above 70 were reading at low average to average ranges (often above their FSIQ) [50]. Similarly, Udwin, Howlin, and colleagues, found that older children and adults with WS who were unable to read displayed significantly lower FSIQ, verbal intellect, and nonverbal intellect than those that could read [41,44,45].
Looking at single word reading literature specifically (both real and nonwords), which is the focus of the current study, correlations with FSIQ have been reported to be strong4 [49]. However, only one study to date has utilised the absolute difference method, where an individual’s reading abilities are directly compared to their level of intellectual functioning (standard score comparison) [75]. Brawn and colleagues found that, although there was a small proportion of WS individuals who achieved a single word reading level significantly5 above their FSIQ, the majority of their older WS sample (aged 9 to 39 years; Mage = 21.0) showed reading for regular, irregular, and nonwords was commensurate with overall intellectual abilities (ranging from 61% to 89% depending on the word type) [5]. No individuals showed a significantly higher FSIQ compared to reading skill. In terms of verbal abilities, associations with single word reading have been found to be moderate to strong (nonwords and/or real words) [5,49,50]. The correlations with nonverbal abilities were mixed, with moderate to strong associations with nonwords, and correlations ranging from weak, to moderate (both regular and irregular, to strong for real words [5,49,50]. In a recent cross-sectional study looking at 9-year-old children with WS (Mage = 9.32 years; N = 70), however, Mervis, et al. found that the method of reading instruction6 was significantly and more strongly correlated with the Wechsler Individual Achievement Test, Third Edition (WIAT-III) Basic Reading Composite (which is comprised of the single word reading subtests Word Reading [regular and irregular words] and Phonological Decoding [nonwords]) than FSIQ, indicating that IQ may account for only a small amount of variance in reading ability [9,76]. Instead, these authors found visuospatial ability to be a weak, but significant, predictor of reading performance. Other studies have also shown single word reading abilities to have a weak (real and nonwords) to strong (real words) association with visuo-spatial abilities [5,49].
Similarly, in the mathematics literature, some researchers have argued that visuospatial difficulties are predominantly responsible for the poor mathematical abilities found in WS [61,77]. However, several studies have failed to find a significant relationship between mathematic abilities and visuospatial skills in their child and adult WS cohorts [13,64]. For example, O’Hearn and Landau found that early mathematical counting, calculation, and basic reasoning skills (as measured by TEMA-II) were higher than visuospatial abilities and, instead, were associated with verbal and nonverbal reasoning in their sample of WS children and adults (aged 10 to 38 years; Mage = 17.75 years) [55,78]. These findings, which are in contrast to the TD literature, provide further support that the mathematical developmental trajectory in WS individuals is atypical and follows a different developmental path to the neurotypical population [79]. Furthermore, as a result of their findings that mathematical ability was in line with verbal and overall intellect, Van Herwegen and Simms proposed that verbal and general intellectual functioning may interact and provide compensation for poor nonverbal and mathematical abilities [7].
Executive Functioning
Executive Functions (EF) have long been established as important for functional academic skills, at least in TD populations [80]. EFs refer to a set of distinct, yet partially interrelated, higher-order cognitive processes that are commonly associated with prefrontal circuitry, believed to enable independent, purposeful, and goal-directed behaviour [81-83]. In the TD mathematical literature, studies have shown that EFs are a significant predictor of mathematical performance, both with numerical calculation and mathematical problem-solving [84-86]. Functional brain imaging has also evidenced links between EF and mathematics in TD populations, with coactivation reported between the posterior parietal cortex (a region known to be implicated in numerical processing) and the prefrontal cortex during arithmetic tasks [87]. EF abilities have also been found to predict the development of mathematical skills in TD children, specifically, working memory, inhibition and shifting [74]. No study to date has investigated the association between EF abilities and mathematical performance in WS, however, Kim and Cameron postulated that EF deficits may help explain reduced mathematical abilities in this population [74]. Moreover, WS individuals have been shown to perform more poorly on tasks that require working memory abilities than TD controls, like counting onwards and backwards [54].
In the TD literature, working memory is thought to be necessary for phonological decoding and uniquely contributes to nonword reading abilities, however, its underlying role in reading remains unclear [88,89]. Only two studies to date have explored the relationship between verbal working memory and (single word) reading in WS school-aged children and adults, with mixed results [5,9]. The first study, by Brawn et al., reported that verbal working memory had a moderate association with ability to read real words (regular and irregular) and a strong association with ability to read nonwords [5]. In contrast, Mervis and colleagues found that associations between verbal working memory and the WIAT-II Basic Reading Composite were strong, however verbal working memory did not predict performance for basic reading skills after controlling for method of instruction and phonological processing [9].
Attention
In the TD literature, a strong correlation has been found between early inattention and poor reading acquisition [90]. Attentional flexibility, and selective and sustained attention, have also been reported to predict the development of numeracy skills in TD populations [17,87]. In the case of WS individuals, who have well-documented attentional difficulties (both inattention and hyperactivity) across the life span, early atypical attentional patterns (e.g., poor attentional shifting and sustained attention) and have been found to affect later cardinality skills and non-verbal mathematical estimation abilities [35,36,62,77,91,92]. Interestingly, however, attentional impairments have not been found to impact substantially on literacy performance in WS children. For example, in a cross-sectional and 12-month longitudinal study, Cornish et al. examined how inattention and hyperactivity (as measured by the Conners Rating Scale, Teacher Form) influenced literacy and vocabulary development in children with WS (aged 4 to 9 years at Time 1; Mage = 6.54 years; N = 26) and DS (aged 4 to 9 years at Time 1; Mage = 6.96 years; N = 26) [46,93]. In contrast to the DS group, despite WS children displaying significantly greater ADHD symptomology, inattention, and hyperactive behaviours, both neurodevelopmental groups were found to have equivalent single word reading and letter knowledge abilities at Time 1 and Time 2. WS children scored significantly higher for receptive vocabulary, rhyme matching, and phoneme matching across both time points. However, in contrast to the DS group, impairments in inattention and hyperactivity for the WS children were not found to be significantly associated with performance on tasks of receptive vocabulary, letter knowledge, phonological awareness (phoneme and rhyme matching), and single word reading7, as indexed by concurrent (Time 1) and longitudinal (Time 2) correlations [46].
Overall, although poor literacy and numeracy abilities have been reported, no study to date has identified the merging reading and mathematical profile in a young cohort of WS children, nor have studies utilised standard scores and a TD control group matched on chronological age, SES, and parent education in this young population. Furthermore, the underlying cognitive processes that underpin the early development of literacy and numeracy in the population remains unclear.
Current Study
The first aim of the current study was to investigate the emerging profile of reading and mathematical abilities in a sample of young children with WS and in TD controls. In line with previous research, we expected young WS children to display deficits in early reading and mathematical skills, in comparison to the TD control group, with the WS group showing a particular difficulty in mathematics relative to literacy. Individual variability was also expected, with some WS children expected to show impaired literacy and/or numeracy abilities and some falling within normal limits across academic tasks.
The second aim of the present research was to identify early cognitive abilities associated with later academic functioning in a longitudinal study design (spanning approximately 3.5 years). Specifically, IQ, executive functioning, and attentional difficulties were assessed at Time 1 using measures commonly utilised in clinical settings (e.g., preschool and school-aged version of the Child Behavior Rating Inventory of Executive Functioning [BRIEF] and the Conners Early Childhood/Conners 3rd Edition questionnaires), and these scores were then examined for their association with later literacy and numeracy functioning [94-97]. Early functional academic abilities (as measured by combining the Conners Early Childhood Pre-Academic/Cognitive developmental milestone and the Conners 3rd Edition Learning content scales) were also included as an early cognitive abilities associated with later academic skills [96,97]. In line with previous WS studies, we expected IQ, attention, and aspects of executive functioning, particularly working memory, to be associated with later academic outcomes in the WS cohort. We also expected ratings on the combined Conners Early Childhood/Conners 3rd Edition academic scales to significantly correlate with later literacy and numeracy skills in WS children, as measured at Time 2 [96,97].
Method
Participants
The present study involved a total of 60 young children and their parents/guardians, including children with WS (N = 20) and a community comparison group (N = 40). All WS and TD children spoke English as their first language.
Williams Syndrome Group
Twenty young children with diagnosis of WS (14 males, 6 females, and zero nonbinary) and their parents/guardians were recruited through Williams Syndrome Australia Limited. The WS diagnosis was confirmed using the Fluorescence in Situ Hybridization (FISH) test to look for deletion of the elastin gene [18,23,72]. WS children were screened for a history of psychological, neurodevelopmental, and/or neurological conditions unrelated to their WS (e.g., peri¬natal hypoxic brain injury, acquired brain injury, etc.), and major sensory impairments that could impact on their ability to perform the research tasks. No WS child was excluded from the study based on the above criteria. Of note, one child had a comorbid diagnosis of ASD. Although attentional difficulties were apparent during face-to-face testing and when analysing the questionnaire data, no child was diagnosed with ADHD during the length of the study [11]. No child had a coexisting diagnosis of anxiety.
Typically Developing Group
Due to the longitudinal nature of the study, forty typically developing (TD) controls (14 males, 26 females, and zero nonbinary) and their parents/guardians participated in the study. Thirty-three families were recruited through the Macquarie University Neuronauts Kids Science Club (82.5% of TD sample) and two from the child-care centres on campus at Macquarie University, Sydney, Australia (5%). Five typically developing siblings of WS children were also recruited to participate in the study (12.5% of TD sample). TD children were screened for a history of psychological, developmental, neurological conditions, learning disorders, and any major sensory impairments. No TD child was excluded from the study based on the above criteria.
Demographic information for both groups is shown in Table 1. In line with previous studies, cognitive ability was assessed using either the Mullens Scale of Early Learning (MSEL) or the Differential Ability Scales, Second Edition (DAS-II), depending on each child’s age at Time 1 testing [1,98-100]. The DAS-II was used for all children at Time 2 testing. On average, WS children performed in the mild to moderate range, with Developmental Quotient (DQ) scores ranging from severely impaired to average; this is highly consistent with the reported developmental levels for WS, the mean IQ reported for older children and adults with WS, and the cognitive heterogeneity reported for WS [11,29,31,32]. Geographic residence for each family was utilised as a measure of socioeconomic status (SES) using the Australian Bureau of Statistics Index of Relative Socio-economic Advantage and Disadvantage [101]. Families were provided with a score from “1” to “5”, with a lower score denoting a greater socioeconomic disadvantage. Independent t-tests and nonparametric Mann-Whitney U tests revealed no significant differences between the chronological age of the children (Time 1 and Time 2), SES, or parental education (mother, father, and average) across the two groups (p = >.05).
|
Measure |
WS (N = 20) |
TD (N = 40) |
||||||
|
Time Point |
|
|||||||
|
Time 1 |
Time 2 |
Time 1 |
Time 2 |
|||||
|
Mean (SD) |
Range |
Mean (SD) |
Range |
Mean (SD) |
Range |
Mean (SD) |
Range |
|
|
CA (years)a |
4.58 (1.74) |
2.17-7.73 |
8.26 (2.15) |
4.87-12.04 |
4.80 (1.65) |
2.23-8.10 |
7.51 (1.77) |
4.87-10.58 |
|
Gender distribution |
14 M 6 F 0 NBb |
(70%) (30%) (0%) |
|
|
14 M 26 F 0 NBb |
(35%) (65%) (0%) |
|
|
|
Handedness |
||||||||
|
% Right |
55 |
|
85 |
|
75 |
|
87.5 |
|
|
% Left |
10 |
|
15 |
|
10.7 |
|
12.5 |
|
|
% Ambidextrous |
0 |
|
0 |
|
0 |
|
0 |
|
|
%Unestablished |
35 |
|
0 |
|
14.2 |
|
0 |
|
|
Overall DQc/IQd |
56.94 (11.92)c |
38.00- 81.21c |
61.64 (11.83)d |
40.00– 79.00d |
105.96 (10.35)c |
86.14- 132.00c |
112.73 (11.61)d |
77.00– 140.00d |
|
Verbal DQc/IQd |
58.96 (16.56) c |
32.00- 93.00c |
68.56 (17.30)d |
35.00- 92.00d |
106.97 (11.94)c |
76.00- 142.00c |
109.00 (14.77)d |
58.00- 135.00d |
|
Nonverbal DQc/IQd |
63.73 (12.09) c |
40.27- 87.00c |
70.00 (19.61)d |
27.00- 102.00d |
102.72 (11.44)c |
84.00- 135.79c |
110.15 (12.15)d |
87.00- 147.00d |
|
Current Interventions |
||||||||
|
% Speech Therapy |
65 |
|
55 |
|
10 |
|
25 |
|
|
% Occupational Therapy |
55 |
|
55 |
|
0 |
|
2.5 |
|
|
% Physiotherapy |
55 |
|
20 |
|
0 |
|
0 |
|
|
% Comorbid ASDe Diagnosis |
5 |
|
5 |
|
0 |
|
0 |
|
|
Current Education |
||||||||
|
% Public Main-Steam School |
30 |
|
65 |
|
32.5 |
|
65 |
|
|
% Support-Stream in Main-Stream School |
5 |
|
15 |
|
0 |
|
15 |
|
|
% Special Education School |
10 |
|
15 |
|
0 |
|
15 |
|
|
% Private/Independent School |
0 |
|
5 |
|
0 |
|
5 |
|
|
% Daycare/ Preschool |
55 |
|
0 |
|
52.5 |
|
0 |
|
|
% Home |
0 |
|
0 |
|
15 |
|
0 |
|
|
Family SESf |
3.61 (1.29) |
1 – 5 |
3.89 (1.08) |
2 – 5 |
4.55 (0.88) |
2 – 5 |
4.44 (1.05) |
2 – 5 |
|
Family Ethnicity |
||||||||
|
% Oceanian |
60 |
|
|
|
67.5 |
|
|
|
|
% European |
10 |
|
|
|
25 |
|
|
|
|
%Asian |
15 |
|
|
|
5 |
|
|
|
|
% Other |
15 |
|
|
|
2.5 |
|
|
|
|
Years of Education |
||||||||
|
Mother |
14.05 (2.22) |
10-18 |
|
|
15.38 (2.37) |
12-20 |
|
|
|
Father |
13.24 (2.25) |
9-18 |
|
|
13.70 (2.20) |
10-20 |
|
|
|
Average Parent Years of Education |
13.65 (2.02) |
9.50- 16.50 |
|
|
14.82 (1.78) |
11.50-20 |
|
|
|
Note. a chronological age. b NB = nonbinary. c DQ = developmental quotient as measured by MSEL or DAS-II at Time 1 (Standard Scores; M = 100, SD = 15). d IQ = intelligence quotient as measured by DAS=II at Time 2 (Standard Scores; M = 100, SD = 15). e ASD = Autism Spectrum Disorder. f SES = socioeconomic status as measured by the Australian Bureau of Statistics Index of Relative Socio-economic Advantage and Disadvantage (ABS, 2016) based on geographic residence. Families were provided with a score from “1” to “5”, with a lower score denoting a greater socioeconomic disadvantage. |
||||||||
Table 1: Between Group Comparisons of Descriptive and Demographic Data at Time 1 and Time 2
Materials
Academic Functioning
Wechsler Individual Achievement Test, Second Edition (Australian Standardised Edition) WIAT-II. The WIAT-II is an individually administered measure of academic achievement for children and adults aged 4 to 85 years (Australian standardisation sample N = 1261) [2]. The measure consists of nine subtests which map onto four composites (Reading, Mathematics, Written Language, and Oral Language), each yielding a standard score (M = 100, SD = 15) based on either the individual’s age or year of education. Lower scores denote greater academic difficulties (a score of 69 or below is classified as abnormal or impaired, 70-79 is borderline impaired, 80-79 is low average, 90-109 is average, 110-119 is high average, 120-129 is very high or superior, and 130 or above is extremely high or very superior) [2]. The WIAT-II reading and mathematics subtests and composite scores are outlined in Appendix A. The WIAT-II displays adequate reliability and validity [2]. Split-half reliability coefficients for ages 4 to 19 years ranged from .71 to.96 with a mean interval of 23 days [2]. The WIAT-II has also established reliability and validity for the WS population [27]. Due to the longitudinal nature of the study, the WIAT-II was the current edition available when the study began, and it continued to be utilised in order to allow for a robust comparison.
Intellectual Functioning
The Mullen Scales of Early LearningMSEL. The MSEL is a standardised individually administered measure of early cognitive functioning for infants and preschool children, ranging from birth through to 68 months (US standardisation sample N = 1849) [1]. The MSEL consists of four core cognitive subtestsVisual Reception, Fine Motor, Receptive Language, and Expressive Language [1]. Raw scores for each subtest are converted to a T score (with a population M = 50, SD = 10). T scores for the four core cognitive subtests yield an Early Learning Composite standard score (M = 100, SD = 15; a lower score indicates greater cognitive difficulties). Across each age group, the median internal consistency values ranged from .75 to .83 for the five subtests [1]. The internal consistency of the Early Learning Composite was high, ranging from .83 to .95 across (median value was .91) [1]. Test-retest reliability correlations ranged from .71 to .96, and interscorer reliability ranged from .91 to .99 [1]. Previous studies have also used the MSEL with WS children and established its reliability and validity within this population [102].
Differential Ability Scales, Second Edition – DAS-II. The DAS-II is an individually administered standardised measure of intelligence designed for children aged from 2 years, 6 months to 17 years, 11 months (US standardisation sample N = 3,475) [100]. The DAS-II is divided into two record forms: 1) the Early Years battery, which comprises two levels, the lower level for children aged 2 years 6 months to 3 years 5 months, and the upper level for children aged 3 years 6 months to 6 years 11 months (and children aged 7 to 8 years 11 months who display low ability); and 2) the School-Age battery for children aged 7 to 17 years 11 months. The lower level of the Early Years battery has four core subtests that contribute to the overall General Conceptual Ability and two cluster scores: Verbal Ability and Nonverbal Ability. The upper level Early Years and School-Aged batteries require six core subtests to obtain the General Conceptual Ability and three cluster scores: Verbal Ability, Nonverbal Reasoning Ability, and Spatial Ability. Raw scores for each subtest are converted to a T score based on the child’s age (M = 50, SD = 10), and the relevant T scores then yield a standard score for each cluster and the General Conceptual Ability (M = 100, SD = 15). Lower scores reflect greater cognitive difficulties (a standard score of 69 or below is classified as “very low”) [100]. The internal reliability coefficient for each core subtest, cluster, and the General Conceptual Ability (all ages) ranged from .82 to.94 for the Early Years battery, and .68 to .97 for the School-Aged battery [100]. Across all ages, test-retest coefficients for each core subtest, cluster, and General Conceptual Ability ranged from .63 to .91, and interscorer agreement ranged from .95 to .99 [100]. The DAS-II Introductory and Technical Handbook outlines evidence to support both concurrent and construct validity. Previous studies have also established the validity and reliability of the DAS-II in the WS population [100,103].
Combining MSEL and DAS-II scores. At Time 1, to maintain consistency with the DAS-II Verbal and Nonverbal cluster, and the General Conceptual Ability scores, DQ scores were manually calculated using the MSEL four core subtests (for details, see Bishop et al., 2011). This is in line with other published studies with young typically developing children and children with neurodevelopmental disorders, including WS [98,99,104]. To reduce the probability of making a Type-II error, the calculated MSEL DQ scores (all children under 68 months of age at Time 1; WS: n = 14; TD: n = 27), and the DAS-II verbal cluster, nonverbal cluster, and General Conceptual Ability scores (all children over 68 months of age at Time 1; WS: n = 6; TD: n = 13), were combined to create single measures of global, verbal, and nonverbal ability for each WS and TD child. As such, the three scores (i.e., Global, Verbal, and Nonverbal) were used for the longitudinal correlational analyses as a measure of each child’s developmental or intellectual quotient (collectively known as the ‘developmental quotient’ or ‘DQ’ score). The DAS-II was used for all children at Time 2 testing. Previous studies have also shown good convergent and concurrent validity for combining MSEL and DAS-II in this way within typical and neurodevelopmental populations [98,99,105].
Executive Functioning
The Child Behavior Rating Inventory of Executive Functioning-Preschool Version (Parent Form) BRIEF-P. The BRIEF-P is a questionnaire which measures everyday executive functioning behaviours of preschool children aged 2 years 0 months to 5 years 11 months [94]. The 63 items map onto five clinical scales (Inhibit, Shift, Emotional Control, Working Memory, and Plan/ Organise), which combine to form the three indices of Inhibitory Self-Control, Flexibility, and Emergent Metacognition, and the overall Global Executive Composite. Internal consistency for parent normative data sets across all scales, indices, and Global Executive Composite, range from .80 to .95. Previous studies have used the BRIEF-P with neurodevelopmental populations, including WS [37].
Behavior Rating Inventory of Executive Functioning (Parent Form)—BRIEF. The BRIEF is a questionnaire which measures everyday executive functioning behaviours [95]. Seventy-two items map onto nine clinical scales (Inhibit, Shift, Emotional Control, Initiate, Working Memory, Plan/Organise, Organisation of Materials, and Monitor), which combine to form the two indices, the Behavioural Regulation Index and the Metacognition Index, and the overall Global Executive Composite. Internal consistency for parent normative data sets across all scales, indices, and Global Executive Composite, ranges from .80 to.97 [95]. Test-retest reliability correlation ranged from .76 to .88 over an average interval of 2 weeks [95]. Previous studies have also used and validated the BRIEF-C within the WS population [39,106]. Due to the longitudinal nature of the study, the BRIEF-C (first edition) was the current edition available when testing began, and it continued to be utilised at Time 2 data collection in order to allow for a direct comparison.
Combining BRIEF data. Due to the age range of the WS and TD children, we were required to utilise both the preschool (WS: n = 11; TD: n = 9) and child (WS: n = 9; TD: n = 13) BRIEF questionnaires. To increase power for the analyses, data from both measures were combined, and are collectively referred to as BRIEF data. For the purposes of this research, only the five corresponding clinical subscales (Inhibit, Shift, Emotional Control, Working Memory, and Plan/Organise) were utilised. The combined BRIEF sub-scales utilised in the current study are outlined in Appendix B. Each clinical scale and index yields a T score (with population M = 50, SD = 10) based on the individuals’ chronological age and sex.
Higher scores indicate greater degrees of executive dysfunction, with scores at or above 65 suggesting clinical significance [94,95]. T scores were used in our analyses as they most readily signify whether the ratings indicate clinical significance (≥65). The number of items relating to each of the five subscales also differs across the two measures, so the use of T scores was also more appropriate.
Functional Attention
Conners Early Childhood, Full-Length (Parent)—Conners EC. The Conners EC (Conners, 2009) is a standardised questionnaire completed by a parent/guardian to assess attentional, behavioural, emotional, and social concerns in preschool children aged 2 to 6 years (US standardisation sample N = 800). The full-length Conners EC consists of six behavioural scales (Inattention/ Hyperactivity, Defiant/Aggressive Behaviours, Social Functioning/Atypical Behaviours, Anxiety, Mood and Affect, and Physical Symptoms) and five developmental milestones (Adaptive Skills, Communication, Motor Skills, Play, and Pre-Academic/ Cognitive). Each clinical scale yields a T score (with population M = 50, SD = 10) based on the individuals’ chronological age and sex. Higher scores indicate greater degrees of concern, with T scores 60 and above suggesting High Average levels, 65 and above suggesting elevated levels, and 70 and above suggesting very elevated levels [97]. Due to the scope of the Conners EC, only the Inattention/Hyperactivity behavioural scale and the Pre-Academic/Cognitive developmental milestone were utilised in the current study. The Inattention/Hyperactivity behavioural scale evaluates the level of inattentive and hyperactive-impulsive behaviour that is exhibited by a child in the past month and the items closely reflect the diagnostic criteria for attention/deficit-hyperactivity disorder (ADHD) in the Diagnostic and Statistical Manual of Mental Disorders, Fifth Edition (DSM-5) [107]. The Pre-Academic/Cognitive developmental milestone assesses the level of a child’s knowledge of pre-academic concepts, pre-reading abilities, and early memory and reasoning skills. The Conners EC behavioural scales and developmental milestones are further outlined in Appendix C. The Conners EC parent rated Inattention/Hyperactivity behaviour scale and Pre-Academic/ Cognitive developmental milestone have very good psychometric properties [97]. The average test-retest reliability correlation for a two- to four-week interval for the Inattention/Hyperactivity behaviour scale and Pre-Academic/Cognitive developmental milestone is .88 and .97, respectively, and the average Cronbach’s alpha coefficient for the two scales are both above .94 [97]. The Conners EC also displays evidence of reliability and validity within neurodevelopmental populations [108].
Conners, 3rd Edition, Short Form (Parent)—Conners 3. The Conners 3 Short Form is a standardised questionnaire completed by a parent/guardian to assess attention, behaviour, learning, and social concerns in school-aged children aged 6 to 18 years (US standardisation sample N = 1200) [96]. The Conners 3 Short Form consists of 45 items, 43 of which map onto six content scales: Inattention, Hyperactivity/Impulsivity, Learning Problems, Executive Functioning, Aggression, and Peer Relations. Each clinical scale yields a T score (with population M = 50, SD = 10) based on the individual’s chronological age and sex. Higher scores indicate greater degrees of concern, with T scores at or above 60 suggesting elevated levels and T scores at or above 70 suggesting very elevated levels [96]. Due to the scope of the Conners 3, only the Inattention, Hyperactivity/Impulsivity, and Learning content scales were utilised in the current study. The Inattention content scale evaluates a child’s ability to concentrate and keep their mind on their work in the past month. The Hyperactivity/Impulsivity content scale assesses the level of hyperactive and impulsive behaviours (e.g., restlessness, excessive talking, or interrupting others) that is exhibited by a child in the past month. The items on these scales also closely reflect the diagnostic criteria for ADHD in the DSM-5 [107]. The Learning content scale provides an indication of learning, memory, and academic challenges. The Conners 3 content scales are further outlined in Appendix D. The Conners 3 Inattention, Hyperactivity/Impulsivity, and Learning content scales have good psychometric properties [96]. The average adjusted test-retest reliability correlation for a two- to four-week interval for all three scales ranged from .82 to .91 [96]. The average Cronbach’s alpha coefficient across all ages for the Inattention, Hyperactivity/Impulsivity, and Learning content scales were .93, .94, and .90, respectively [96]. The Conners 3 also displays evidence of reliability and validity within neurodevelopmental populations [109].
Combining Conners data. Due to the chronological age range of the WS and TD children at Time 1, we were required to utilise both the preschool (WS: n = 16; TD: n = 31) and the child (WS: n = 4; TD: n = 9) Conners questionnaires. To maintain consistency with the Conners EC Inattention/Hyperactivity behavioural scale, the scores for the Conners 3 Inattention and Hyperactivity/Impulsivity scales were averaged to obtain an overall score of attention. To increase power for the analyses, the Conners EC Inattention/ Hyperactivity scale and the Conners 3 attention scores, and the Conners EC Pre-Academic/Cognitive and Conners 3 Learning scores were then combined to create a single measure of attention and learning (collectively referred to as ‘Inattention-Hyperactivity/ Impulsivity’ and ‘Early Academic Performance’, respectively). T scores were used in our analyses as they most readily signify whether the ratings indicate clinical significance. The number of items relating to each of the scales also differs across the two measures, so the use of T scores was also more appropriate.
Procedure and Scoring
This research was part of a wider research study. Ethics approval for this study was gained from the Macquarie University Human Research Ethics Committee (reference number: 5200900071 and 52021913524613). The MSEL, DAS-II, WIAT-II, BRIEF-P, BRIEF, Conners EC, and Conners 3 were administered and scored by hand according to each of the examiner’s manuals by the first author who had appropriate training [1,2,94-97,100]. The scores on the MSEL, DAS-II, Conners EC, and Conners 3 measures were checked with their corresponding computer scoring program [1,96,97,100]. The WIAT-II, BRIEF-P, and BRIEF were double-scored by hand by the second author of the paper. The age-based norms were utilised for the WIAT-II. The BRIEF-P/BRIEF, and Conners EC/Conners 3 were administered to the primary caregiver. Most questionnaires were completed by the end of each face-to-face testing session, although in cases where parents were unable to do so, questionnaires were mailed back to the investigator within 4 weeks following face-to-face testing. The order of items on the MSEL were randomised to avoid any systematic effects on tasks and to maintain children’s motivation, in line with the standardised instructions [1]. Due to the young age of the children in the current study, just the Word Reading, Pseudoword Reading, Maths Reasoning, and Numerical Operations WIAT-II subtests were utilised, which only allowed for the calculation of the Mathematics Composite score [2]. Of note, due to the ability level of the WS children, it was inappropriate to administer the WIAT-II Reading Comprehension subtest and, as such, the Reading Composite was not able to be computed [2].
Due to the normative age range cut-offs for each cognitive and academic measure, several subtests have reduced numbers. Firstly, the age range begins at 5 years, 0 months for the Numerical Operations and 6 years, 0 months for the Pseudoword Reading subtests. As such, two WS and two TD children fell below the age range for Numerical Operation (also meaning a Mathematics Composite score could not be computed for these children). Four WS and 10 TD children were also below the age range for Pseudoword Reading. The total number of children for each task is outlined in Table 2 (and Appendix E for the cognitive measures).
Analytic Approach
Given the small sample size, corrections for multiple comparisons were not applied due to low power. Alpha was set at 0.05 to minimise the likelihood of a Type-II error [110]. This is in line with other published studies on WS [111-113]. For correlation analyses, all coefficients that displayed moderate to large effect sizes have also been reported to assist with interpretation and to demonstrate that the findings were not simply a reflection of Type-I error (in line with recommendations by Nakagawa and Rothman) [110,114]. The effect size classifications for r were as follows: <0.1=small; 0.3=medium, >.0.5=large [115]. Some variables were found to violate the assumption of normality, and, so where appropriate, nonparametric tests were engaged to check the robustness of the result.
Results
Profile of Academic Functioning in Young WS Children
The mean WIAT-II Standard Scores for both the WS and TD children are presented in Table 2. For the WS children, overall, the mean Mathematics Reasoning, Numerical Operations, and the Mathematics Composite scores fell within the impaired range (i.e., standard scores below 69), and the mean Word Reading and Pseudoword Decoding scores fell within the borderline range (i.e., 70 to 79). All mean TD scores fell in the average range. As shown in Table 2, Mann-Whitney U tests confirmed that, on average, all WS WIAT-II subtest and composite scores were significantly lower than TD scores (p = < .001).
|
WIAT-II Subtest and Composite |
WS |
TD |
Difference |
||||||||||
|
M (SD) |
Range |
% Impaireda |
Nb |
Mean Overall DQ (SD)d |
M (SD) |
Range |
% Impaireda |
Nb |
Mean Overall DQ (SD)d |
U |
p |
r |
|
|
Word Reading |
72.75 (20.13) |
40c-114 |
30.0 |
20 |
56.94 (11.91) |
109.68 (10.47) |
86-128 |
0.0 |
40 |
105.96 (10.35) |
29.00 |
<.001 |
0.75 |
|
Pseudoword Decoding |
72.25 (17.50) |
43-101 |
43.8 |
16 |
55.75 (12.73) |
107.27 (11.78) |
81-124 |
0.0 |
30 |
105.71 (10.54) |
19.50 |
<.001 |
0.75 |
|
Mathematics Composite |
51.67 (11.45) |
40c-78 |
94.4 |
18 |
56.56 (12.24) |
106.37 (12.90) |
76-131 |
0.0 |
38 |
106.28 (10.51) |
1.00 |
<.001 |
0.80 |
|
Mathematics Reasoning |
57.20 (17.14) |
40c-102 |
80.0 |
20 |
56.94 (11.91) |
108.15 (10.46) |
89-129 |
0.0 |
40 |
105.96 (10.35) |
13.50 |
<.001 |
0.78 |
|
Numerical Operations |
57.78 (12.97) |
40c-79 |
77.8 |
18 |
56.56 (12.24) |
103.16 (14.69) |
61-125 |
2.6 |
38 |
106.28 (10.51) |
9.50 |
<.001 |
0.78 |
|
Note. Standard Scores (population M = 100, SD = 15). Bold typeface indicates group mean scores impaired range (i.e., a standard score at or below 69). a Percentage of children who fell in the impaired range. Mathematics Composite was able to be calculated as all necessary mathematic subtests on the WIAT were administered. b Only children who fell within the WIAT-II normative age range were administered each subtest (see Wechsler for details [2]). c Lowest possible standard score. d Mean overall DQ for each adjusted sample. |
|||||||||||||
Table 2: Descriptive Statistics for WS and TD Children on the WIAT-II (Time 2)
Looking at the difference between the WIAT-II subtests within each clinical group, Friedman’s ANOVA indicated that mean scores for WS children differed significantly, χ2(3) = 20.21, p = .000. Wilcoxon signed-rank tests were then utilised to explore group differences between each WIAT-II subtest. Mathematics Reasoning scores (Mdn = 56.00) were significantly lower than Word Reading (Mdn= 77.50; T = 7.00, p = .001, r = -0.76) and Pseudoword Decoding (Mdn = 75.00; T = 5.00, p = .002, r = -0.78). Numerical Operations scores (Mdn = 60.00) were significantly lower than Word Reading (T = 13.50, p = .005, r = -0.66) and Pseudoword Decoding (T = 25.50, p = .028, r = -0.55). The scores on the WIAT-II mathematic subtests (i.e., Mathematics Reasoning and Numerical Operations; T = 39.50, p = .244, r = -0.27) and reading subtests (i.e., Word Reading and Pseudoword Decoding; T = 32.00, p = .197, r = -0.32) were not found to be significantly different. Overall, WS children performed significantly more poorly on the mathematics subscales than the reading subscales, indicating a dissociation between their maths and reading abilities at this young age.
For the TD group, Friedman’s ANOVA indicated that the mean WIAT-II subtest scores differed significantly, χ2(3) = 9.66, p =.022. In contrast to the WS group, post hoc Wilcoxon signed-rank tests revealed the reading subtest scores were significantly different (i.e., Word Reading scores [Mdn = 111.50] were higher than Pseudoword Decoding [Mdn = 110.50]; T = 120.00, p =.0.35, r = -0.39) and mathematics subtest scores (i.e., Mathematics Reasoning scores [Mdn = 107.00] were significantly higher than Numerical Operations [Mdn = 104.00]; T = 203.50, p = .042, r= -0.33). No other significant differences between the WIAT-II subtests were found for TD children (all p values > .05).
At an individual level, young children with WS displayed a wide range of standard scores on each of the WIAT-II academic achievement subtests (ranging from moderately impaired to average/high average range [see Table 2]). Of note, a standard score of 40 equates to a raw score of zero on the WIAT-II. The percentage of young WS and TD children falling into the impaired range (i.e., a standard score of 69 or below) for each WIAT-II subtest and the Mathematics Composite scores is presented in Table 2. Figure 1 provides a graphical view of the spread of scores for both the WS and TD groups. As indicated from the trend lines in Figure 1, WIAT-II academic subtest scores for young WS children, but not the TD group, appears to be lower for the older age groups, suggesting the gap in ability level between WS children and their neurotypical peers is widening with chronological age. To investigate this further, a series of Pearson and Spearmen correlation coefficients were performed to explore the relationship between each of the WIAT-II subtests and Mathematics Composite scores and chronological age (at Time 1) for both WS and TD groups. For the WS sample, although no significant relationships were identified, there were negative, medium effect sizes between chronological age and WIAT-II Word Reading (r(20) = -.440, p =.052) and WIAT-II Mathematics Reasoning (rs(20) = -.307, p =.189). No significant relationships (all p values > .05), or medium to large effect sizes, were identified for the TD group.
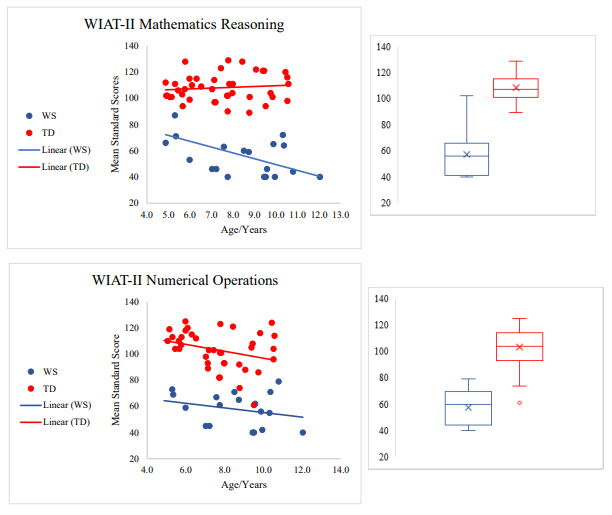
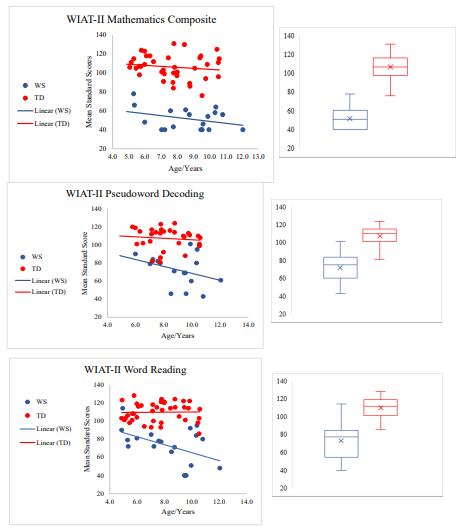
Figure 1: Academic achievement data for each WIAT-II subtest and Mathematics Composite by WS and TD child. Figure 1 illustrates the vast heterogeneity in academic profiles across young children with WS. Standard scores of 69 or below are considered impaired [2]
A series of Pearson and Spearmen correlation coefficients were performed to explore the relationship between each of the WIAT- II subtests and Mathematics Composite scores and the level of education and chronological age (at Time 1) of the primary caregiver for both groups. No significant relationships (all p values > .05), or medium to large effect sizes, were identified for either group.
An individual academic-intelligence discrepancy analysis was performed to determine whether there was a significant discrepancy8 between each WIATâ??II subtest and the Mathematics Composite Standard Scores and Verbal and Nonverbal DQ scores (see Figure 2 for percentages for each clinical group). WIAT-II mathematics subtests and composite scores were compared to each child’s Nonverbal DQ scores at Time 2, and WIAT-II reading subtests were compared to each child’s Verbal DQ scores at Time 2. Overall, most WS and TD children did not display a significant difference between DQ and academic scores. However, for the percentage of children who did display a significant difference, more WS children displayed significantly lower scores on the mathematical tasks compared to their Nonverbal DQ. The opposite trends were seen for the reading tasks, with more WS children significantly displaying higher literacy scores than their Verbal DQ. In the TD group, a small proportion displayed significantly lower numeracy scores in comparison to their Nonverbal DQ (no numeracy scores fell significantly above Nonverbal DQ). In contrast, an equal proportion of TD children displayed literacy scores significantly above and below their Verbal DQ.
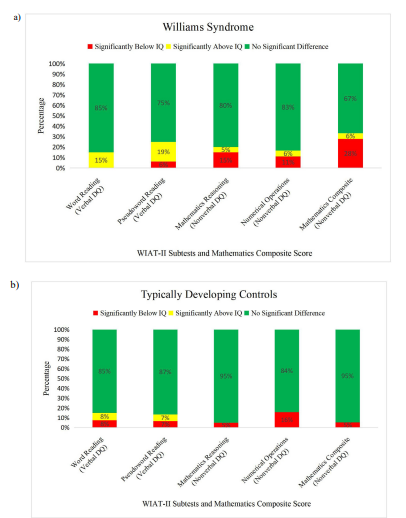
Figure 2: Figure 2 illustrates the academic-intelligence discrepancy for WS and TD children. Group academic-intelligence discrepancy analysis using the four WIATâ??II subtests and Mathematics Composite Standard Scores was based on either Verbal or Nonverbal DQ scores at Time 2. A difference of 1.5 SD was considered significant. The categories consisted of: 1) no significant difference between scores on academic measure and DQ (green); 2) academic score is significantly above DQ score (yellow); and 3) academic score significantly below DQ score (red)
Cognitive Abilities Associated with Early Academic Functioning in WS
A series of Pearson and Spearman correlation coefficients were performed to explore whether early cognitive functioning (i.e., Time 1: DQ scores [Verbal, Nonverbal, and Global; as measured by MSEL and DAS-II]; executive functioning [BRIEF-P and BRIEF-C]; functional attention [Conners EC and Conners 3]; and early academic performance [Conners EC and Conners 3]) was associated with later academic functioning (as measured by Time 2: WIAT-II Word Reading, Pseudoword Decoding, Mathematics Reasoning, Numerical Operations, and the Mathematics Composite). Cognitive data at Time 1 for the WS and TD sample is summarised in Appendix E.
Relationship Between Early Verbal, Nonverbal, and Global DQ and Later Academic Skills
For the WS sample, correlations revealed a significant, positive relationship between the Global DQ and the WIAT-II Numerical Operations (r(18) = .49, p = .041), WIAT-II Mathematics Reasoning subtest (rs(20) = .67, p = .001), and the WIAT-II Mathematics Composite (rs(18) = .71, p = .001). No other significant relationships were identified between DQ scores and the WIAT-II subtests and Mathematics Composite scores (all p values > .05). However, there were positive, medium to large effect sizes between: Verbal DQ and WIAT-II Numerical Operations (r(18) = .44, p = .068), WIAT-II Mathematics Reasoning (rs(20) = .34, p = .137), and the WIAT-II Mathematics Composite (rs(18) = .56, p = .016); Nonverbal DQ and WIAT-II Mathematics Reasoning (rs(20) = .31, p = .182) and the WIAT-II Mathematics Composite (rs(18) = .35, p = .160); and Global DQ and WIAT-II Word Reading (r(20) = .39, p = .086). No significant relationships, or medium to large effect sizes, were identified between the DQ scores and the WIAT-II subtests and the Mathematics Composite scores for the TD sample (all p values > .05). Overall, these results suggest that, at least for young WS children, higher levels of early intellectual functioning contribute to better later mathematical abilities.
Relationship Between Early Executive Functioning Abilities and Later Academic Skills
For the WS sample, correlations revealed a significant, positive relationship between the BRIEF Emotional Control clinical scale and WIAT-II Pseudoword Decoding (r(16) = .50, p = .050). No other significant relationships were identified between BRIEF ratings at Time 1 and the WIAT-II subtests and Mathematics Composite scores at Time 2 for WS children. There was, however, a positive, medium effect size between the BRIEF Inhibit clinical scale and WIAT-II Pseudoword Decoding (r(16) = .30, p = .254). No significant relationships, or medium to large effect sizes, were identified between the BRIEF data and the WIAT-II subtests and the Mathematics Composite scores for the TD sample (all p values > .05). Overall, these results provided evidence that early executive functioning abilities impact later phonological decoding abilities for young children with WS, especially Emotional Control and Inhibit.
Relationship Between Early Functional Attention and Later Academic Functioning
For the WS sample, correlations revealed a significant, negative relationship between the Conners Inattention-Hyperactivity/ Impulsivity ratings at Time 1 and the WIAT-II Mathematics Reasoning subtest at Time 2 (rs(20) = -.50, p = .047). Although no other significant relationships were identified (all other p values > .05), there were negative, medium effect sizes between Conners Inattention-Hyperactivity/Impulsivity and WIAT-II: Word Reading (r(20) = -.43, p = .095), WIAT-II Numerical Operations (r(20) = -.37, p = .195), and the WIAT-II Maths Composite (rs(18) = -.41, p = .144). The TD sample also displayed a significant, negative association between the Conners Inattention-Hyperactivity/ Impulsivity data and the WIAT-II Mathematics Reasoning subtest (r(40) = -.37, p = .022). No other significant relationships, or medium to large effect sizes, were identified between Conners Inattention-Hyperactivity/Impulsivity data and the WIAT-II subtests and the Mathematics Composite scores for the TD sample (all p values > .05). Overall, these results suggest that for young WS and TD children, functional attentional and behavioural difficulties impact on later academic abilities, particularly mathematics.
Relationship Between Early Functional Academics and Later Academic Skills
Correlational analyses with the WS sample revealed a significant, negative relationship between the Conners Early Academic Performance ratings and the WIAT-II Word Reading (r(20) = -.63, p = .009) and WIAT-II Mathematics Reasoning subtests (rs(20) = -.65, p = .006). Negative, medium to large effect sizes were also obtained between Conners Early Academic Performance ratings at Time 1 and the WIAT-II: Numerical Operations (r(18) = -.41, p = .144); WIAT-II Pseudoword Decoding (r(16) = -.50, p = .082); and the Maths Composite (rs(18) = -.52, p = .059). No significant relationships, or medium to large effect sizes, were identified between the Conners Early Academic Performance data and the WIAT-II subtests and the Mathematics Composite scores for the TD sample (all p values > .05). Overall, these results provide evidence that pre-academic skills, as rated by parents on the Conners Early Academic Performance scales, were associated with later academic abilities for young children with WS.
Discussion
The present longitudinal study allowed us to examine the early literacy and numeracy profile, as well as the early cognitive abilities associated with later academic functioning in a cohort of young children with WS and typically developing controls (matched on chronological age, SES, and parental education). There were five main findings from this study, which are discussed below. Firstly, mathematics abilities were significantly lower than reading abilities, on average, in this young WS cohort. This finding provides support for the dissociation of maths and reading skills that is anecdotally reported in the WS literature [11]. The second main finding of the current study related to the considerable variability of reading and mathematics abilities in this young sample of WS children, particularly with regard to reading single words (real and nonwords). This variability is in line with previous literacy and numeracy studies on older children and adults with WS [5,61]. The third main finding was that the gap in ability level between typically developing controls and WS children seems to be widening with chronological age, most likely reflecting a failure to make appropriate gains, or WS children falling further and further behind compared to same aged peers. The fourth main finding was that WS children displayed a relative difficulty, on average, with nonword reading, mathematical calculations and mathematical problem-solving. Finally, lower levels of developmental/intellectual functioning, executive functioning, and attentional difficulties was found to be associated with reduced later academic outcomes.
Early Profile of Academic Functioning in Young WS Children (Time 1)
The first aim of the current study was to investigate the early emerging profile of reading and mathematical abilities in young children with WS in comparison to TD controls. As predicted, and in line with previous research, we found that, on average, young WS children displayed impairments across early literacy and numeracy skills, in comparison to the TD control group (with mean scores in the average range) [5,13,41]. More specifically, for the literacy subtests, out of the 20 children with WS, approximately one quarter (30%) were impaired on single word reading and almost one quarter (43.8%) showed phonological decoding impairments. In contrast, no TD children fell in the impaired range for reading. For numeracy, in comparison to performance on literacy tasks, the percentage of young WS children in the impaired range was much higher (ranging from 77% to 94% across each WIAT-II numeracy subscale and the WIAT-II Mathematical Composite score). One TD child (representing 2.5% of the control sample) also fell in the mildly impaired range on the WIAT-II Numerical Operations subtest on this occasion, in line with a normally distributed sample.
As already indicated, the WS cohort also showed particular difficulty with numeracy, with all mean scores across the WIAT- II Mathematics Reasoning, Numerical Operations, and the Mathematics Composite falling in the impaired range, and with both Maths subtests scores falling significantly below both WIAT-II Word Reading and Phonological Decoding subscales, on average. Furthermore, no difference in WS group performance was found between the reading subtests or between the mathematics subtests. Taken together, these results provide evidence for a dissociation between numeracy and reading abilities for WS at this early age, which has been reported previously in older children and adults with WS [10,11]. In contrast to the WS group, however, a different pattern of results was found between early reading and numeracy abilities for our TD cohort. Specifically, single nonword reading skills (i.e., phonological decoding) were significantly lower than single real word reading skills, and mathematical computation skills were significantly lower than mathematical problem-solving skills.
At an individual level, when the WS and TD scores for each WIAT-II subtest and the WIAT-II Mathematics Composite scores were plotted together, trend lines indicated that the gap for literacy and numeracy skills for the WS children was increasing with age and so they were not making appropriate gains in comparison to neurotypical children. Moderate (non-significant) effect sizes confirmed this trend for single word reading (real words) and mathematical reasoning and problem-solving. In contrast, and as would be expected, no significant associations were found for our TD control group, indicating that they were developing at the same rate as the WIAT-II Australian normative population. Neither the chronological age nor the educational level of each child’s primary caregiver was significantly associated with child academic performance (for WS or for TD groups).
Heterogeneity of Academic Abilities in WS
As predicted, there was considerable individual variability of literacy and numeracy abilities in young WS children, with children displaying a wide range of standard scores on each of the WIAT-II academic achievement subtests with some at moderate levels of impairment and others at average or high average levels. This finding of academic heterogeneity in young WS children is commensurate with the cognitive variability previously reported in WS individuals [8,29,32].
For the WIAT-II reading subtests, our sample included young WS children who ranged from a moderate level of impairment to reading single words (real words) at average levels, with one WS child falling in the high average range. This variability is consistent with previous literature on older children and adults with WS [5,9,41,45,49-51]. Similarly, with nonword reading (i.e., phonological decoding) WS children ranged from moderately impaired to low average and average levels [5,27,50,52,53]. As evident, scores on the phonological decoding tasks did not quite reach high average levels of ability, in comparison to real word reading skills. It is possible that early educational methods and reading instruction for these WS children focussed on sight word reading instead of the recommended systematic phonics approach [9]. As such, background information regarding the type of reading instruction methods each individual has received would be very useful going forward. Of note, however, the WS child that performed at high average levels for the WIAT-II Word Reading subtest fell out of the normative age range for the WIAT-II Phonological Decoding subtest, which may have also slightly reduced the range of score on this task.
For mathematical abilities, individual variability was also evident, with WS children ranging from moderately impaired to average levels for mathematical reasoning and problem-solving skills. Although the range was reduced, WS children displayed some variability in mathematical calculation skills, with scores ranging from moderately impaired to borderline impaired. These findings of heterogeneity in mathematical ability in a young WS cohort is also consistent with previous WS literature [12,41,61,66]. Similar to the aforementioned differences in reading skill, however, individual scores for WS children did not reach low average to average levels for mathematical computation skills, like they did for mathematical reasoning. This may again reflect sampling characteristics as two WS children fell out of the age range for WIAT-II Numerical Operations, with one of these children falling in the average range on the WIAT-II mathematical reasoning subtest.
Using an absolute difference method, in line with Brawn and colleagues, the majority of young WS (and TD) children did not display a significant different between their verbal DQ and literacy abilities, and nonverbal DQ and numeracy abilities [5,75]. However, there were subgroups that displayed significant differences. For the WS group, and in line with Brawn et al., a percentage of children displayed single word reading skills (real words [15%] and nonwords [19%]) above their verbal DQ, thus attaining a level of reading significantly above their verbal intellect [5]. In contrast to the Brawn study, however, a small percentage (6%) of WS children displayed the opposite pattern, with nonword reading skills significantly below verbal intellect, indicating they have difficulties with phonological decoding. For mathematical abilities, a similar pattern emerged, however with a higher percentage of WS children whose mathematical reasoning (15%), computational skills (11%), and overall mathematical ability (28%) were significantly below their nonverbal intellectual ability, and a smaller percentage who showed the opposite pattern (i.e., maths skills were significantly higher than nonverbal DQ; 5-6%).
IQ, Executive Function, and Functional Attention is Associated with Early Academic Functioning
The second aim of the present research was to identify early cognitive abilities associated with later academic functioning, specifically, IQ, executive functioning, and attentional difficulties (each measured at Time 1).
Higher IQ is Associated with Improved Early Mathematical Abilities in WS
Literacy. The only relevant association obtained in the literacy domain was a moderate (non-significant) effect size between overall DQ and the WIAT-II Word Reading subtest, indicating that higher overall developmental/intellectual ability contributed to better single (real) word reading for WS children. This finding is consistent with findings on older WS children and adults [41,44,45,50,51]. In contrast, however, no association was found between overall DQ and nonword reading ability at this young age. Furthermore, no association was found between single word reading ability (both real and nonwords) and either verbal or nonverbal DQ, and no significant association was found between global DQ and nonword reading. As such, we propose that our results may be more in line with Mervis et al., who found that the type of early instructional methods, ideally using the system phonics instruction, accounted for more of the variance in reading ability than IQ [9]. As such, these results indicate that all WS individuals should aim to learn to read despite their level of developmental or intellectual functioning. To confirm this hypothesis, as mentioned above, background information on the type and length of early reading instruction received by these children should be collected in future research. Furthermore, although it was beyond the scope of the current study, future research should focus on the impact of visuo-spatial abilities on reading development in young WS children to further examine the cognitive processes underpinning early literacy development in line with previous WS research [5,49]. It could be that, in the present study, the association with visuospatial abilities is being masked by other processes measured by the nonverbal domain. Although nonverbal reasoning and visuospatial skills have been linked to word reading accuracy in the TD literature, no relationship was identified between the developmental quotient and later reading accuracy skills for the TD controls in the current study [9,116]. Similarly, perhaps this is also due to the nonverbal domain measuring other processes.
Numeracy. In contrast to the above literacy results, mathematical abilities were found to be positively associated with developmental/intellectual functioning in this young WS cohort. Specifically, global DQ was significantly correlated with later mathematical calculation abilities, mathematical reasoning skills, and overall mathematics abilities (as measured by the WIAT-II Mathematics Composite score). Moderate to strong (non-significant) associations were also found between verbal DQ and later mathematical computational and reasoning skills. Although very few studies have directly examined how early developmental or intellectual functioning relates to mathematical development in WS individuals to date, our findings are in line with Ansari et al. who also found verbal abilities to predict mathematical abilities (cardinality) in WS school-aged children aged 6 to 11 years [13]. Similarly, O’Hearn et al. found verbal and general reasoning abilities to be correlated with early mathematical counting, calculation, and basic reasoning skills in their sample of older children and adults with WS [55]. These results are commensurate with our findings of an association between overall and verbal DQ and later mathematical calculation and reasoning skills, and the overall mathematical composite. Interestingly, however, we also found a positive association between higher nonverbal DQ and improved later mathematics reasoning skills and overall numeracy abilities. The current WS literature surrounding the association between mathematical skill and visuospatial abilities is mixed, with some researchers showing that visuospatial difficulties are predominantly responsible for the poor mathematical abilities [61,77] and others finding no relationship [13,55,64]. Furthermore, no associations were found between DQ and later mathematic abilities in the TD group in the present study, in contrast to previous research reporting visuo-spatial abilities to be the main predictor of mathematical skill in neurotypical children [13]. As most previous studies have utilised tests that measure specific mathematical abilities, such as estimation and cardinality, it may be that these specific skills are underpinning mathematical development and interacting with intellectual functioning. Further longitudinal research is required with larger samples over a longer time frame to clarify these relationships.
Early EF Abilities are Associated with Improved Early Phonological Decoding Skills in WS
Literacy. In line with Mervis et al., we also found no significant relationship between working memory and later reading accuracy for young WS children [9]. Instead, however, a significant association was found between increased emotional dysregulation and improved phonological decoding. Further, although not significant, a moderate effect size was found between poor inhibition and improved phonological decoding skills. These results were not expected, and the reason is unknown. As such, future longitudinal research is needed to clarify the impact of EF on reading development. In contrast to the TD literature, no relationship was found between the BRIEF Working Memory subscale and later word reading accuracy (both real and nonwords) for our TD control group [88].
Numeracy. No significant associations were identified between early EF abilities and later mathematical skills for young WS or TD children in the current study. Although this was the first known study to directly investigate this association in WS individuals, a relationship between early EF and mathematical development was expected based on the TD literature stating that the development of mathematical skill relies on EF abilities, such as and especially working memory [87]. It could be that EF abilities impact the development of more specific mathematical skills, and the more general measures of mathematical calculation and mathematical reasoning employed in this study were masking any significant associations. For example, in the TD literature, planning has been found to be associated with applied problem solving, and working memory related to calculation accuracy and early magnitude skills [117-119]. As such, alongside brain imaging, future research should implement a longitudinal study design utilising tests that measure specific mathematical skills in order to further investigate the impact of EF on numeracy development in WS children.
Better Functional Attention is Associated with Improved Early Academic Abilities in WS
Literacy. In contrast to previous WS studies, a moderate and negative effect size evidenced an association between poor early inattention/hyperactivity and later word reading accuracy (real words) in our WS sample [46]. Furthermore, no such associations were found in the TD group, despite previous studies finding a strong association [90]. One likely reason for these results, particularly with the TD group, may be the combined inattention/ hyperactivity measure utilised in the current study. As previous studies have shown, inattentive behaviour, and not hyperactivity, in the early years predicts later reading acquisition, long-term educational attainment, and occupation choices in TD populations [90,120]. Although Cornish et al. did separate out these attentional behaviours from hyperactivity, the age of their participants at the first timepoint was slightly older (ranging from 4 to 9 years, in contrast to our sample which ranged from 2 to 7 years) [46]. Perhaps attentional difficulties uniquely impact literacy attainment at different developmental stages. Another possibility, however, is that different types of attention may be underpinning reading development in these populations and at various age-points. For example, studies have identified that selective and sustained attention have emerged as longitudinal predictors of numeracy development in neurotypicals [17]. This differentiation and manifestation of attentional skills may also be impacting literacy development in the WS population. Indeed, sustained attention and attentional shifting are reduced in WS individuals [77,121]. Overall, the impact of poor attention on reading attainment remains unclear. Future longitudinal research should explore these different attentional skills independently in young WS children to disentangle the impact each has on literacy development.
Numeracy. In line with previous research, inattention/hyperactive behaviours were significantly correlated with the WIAT-II Maths Reasoning subscale in WS, indicating that poor attention reduces later numerical reasoning and problem-solving abilities in young WS children [62,77]. This same significant pattern of results was also seen for the TD group, in line with previous studies [17,87]. Although not significant, negative, medium effect sizes also evidenced an association between poor inattention/hyperactivity and mathematical calculations and overall maths abilities (as measured by the Mathematics Composite) in the WS group.
Early Functional Academic Abilities are Associated with Early Academic Skills in WS
As predicted, early functional academic abilities (as measured by the Conners Early Academic Performance ratings), was found to be associated with later literacy and numeracy skills in young WS children only.
Clinical implications
As academic achievement plays a crucial role in later adaptive functioning, increased independence, and improved quality of life and mental health, it is essential for educators and clinicians to understand the academic profile of young WS children and the cognitive processes that underpin them [5,6,7]. The findings from the current study further support a dissociation between numeracy and literacy, with numeracy skills being significantly reduced. The current study also identifies those aspects of IQ, executive functioning, and attention that significantly contribute to later reading accuracy and mathematical calculation and reasoning skills. By highlighting the underlying cognitive processes that impact later academic outcomes, appropriate educational provisions and intervention programs that address the specific needs of this population and maximise their learning and educational achievements are needed. These findings may direct thoughts to ways that executive and attentional impairments could be minimised in WS preschool children through interventions that are targeted to their specific deficits, as well as ways to minimise any functional impairments associated with EF delays or dysfunction. Furthermore, screening of early academic abilities (e.g., utilising either the Conners Early Childhood Pre-Academic/ Cognitive developmental milestone or the Conners 3rd Edition) is advised in order to identify the young WS children most at risk of poor academic attainment so that early intervention and preventative measures can be implemented [96,97].
Limitations and Future Research
A unique aspect of this study was the longitudinal design, which allowed exploration of the underlying cognitive processes that impact later academic outcomes. Furthermore, the current study employed a TD control group matched on chronological age, SES, and parental education. Nonetheless, the current study should be interpreted in the context of several limitations that need to be considered when interpreting the present findings and that need to be addressed in future research. For example, the WS sample size was small. Although this sample size (N = 20) is comparable to most WS studies to date, we acknowledge that a larger sample size would produce more robust results, less sampling error and improve the generalisability of the findings. Unfortunately, due to the rarity of the syndrome, it is very difficult to recruit large numbers, particularly for longitudinal studies and for a restricted age range. To overcome this, however, it is recommended that scholars engage in a collaborative, multi-site, and international research recruitment approach.
Another issue pertains to the reliance on caregiver reports of early attention and executive processes, which may lead to retrospective or subjective rater bias. To overcome this issue, it is recommended that future studies incorporate data from multiple informants and also utilise performance-based measures, like the Test of Everyday Attention for Children (TEA-Ch) [122]. This would be particularly useful in gaining an understanding of how the different aspects of early attention (e.g., sustained attention, divided attention, etc.) may impact on later academic outcomes. As self-report measures are not appropriate for such a young WS cohort, future research should combine these performance-based measures of EF and informant reports from multiple sources (e.g., caregivers and preschool teachers) to assess executive functioning and attention in WS preschool children across different environments, with the view that each form of assessment provides unique and specialised information. As specific skill deficits (e.g., phonological awareness and estimation abilities) have also been shown to impact academic outcomes in TD and WS individuals, it is recommended that future studies examine their role in the early development of academic difficulties in conjunction with the broad cognitive deficits outlined in this study. Finally, future research should also investigate academic functioning at different age groups in order to determine if these relationships change with age or development. Additionally, examination of how aspects of literacy and numeracy are accessed through the learning curriculum at the various educational/developmental stages would be beneficial within this population.
Conclusion
This is the first study to investigate the literacy and numeracy profile of young children with WS and identify the early cognitive and behavioural factors that impact their later academic functioning. Findings support a dissociation between reading and mathematical abilities in WS, with the former a relative strength in this population. Considerable variability was evidenced in early academic abilities, confirming the importance of individual assessments and developing individualised educational provisions and learning support for this neurodevelopmental population.
|
Composite Score |
Subscales |
Age Range |
Skills Measured |
|
Reading Composite Score |
|
|
General level of reading achievement |
|
|
Word Reading |
4 years to adult |
Phonological awareness, letter identification, decoding skills, and word recognition for regular and irregular words |
|
|
Pseudoword Decoding |
6 years to adult |
Phonological decoding (i.e., nonwords) |
|
|
Reading Comprehension |
6 years to adult |
Literal, inferential, lexical comprehension, reading rate, reading accuracy and fluency, and word recognition |
|
Mathematics Composite Score |
|
|
General level of mathematical achievement |
|
|
Numerical Operations |
5 years to adult |
Mathematical computation, including: identifying and writing numbers; counting; written calculation problems; and simple equations involving addition, subtraction, multiplication, and division; fractions, decimal, and algebra |
|
|
Maths Reasoning |
4 years to adult |
Quantitative concepts; multi-step problem solving; money, time, and measurement; geometry; interpreting charts and graphs; statistics and probability; estimation; identifying mathematical patterns |
|
Note. Adapted from “Examiner’s Manual” by Pearson, pp. 13 to 14, pp. 50 to 63, and pp. 144 to 145. Copyright 2007 by NCS Pearson, Inc. Bold typeface indicates the subtests and composites that were utilised in this study. |
|||
Table A: Description of the WIAT-II Reading and Mathematics Subtests and Composite Scores
Appendix B: Behaviour Rating Inventory of Executive Function
|
Clinical Scales |
Behaviour Measured |
|
Inhibit |
Ability to control impulses and behaviour |
|
Shift |
Ability to move from one situation to another, in a flexible manner |
|
Emotional Control |
Ability to modulate emotional responses appropriately |
|
Working Memory |
Ability to hold and manipulate information in mind |
|
Plan/Organise |
Ability to organise and guide behaviour in order to manage current and future task demands |
|
Note. Adapted from: “Behavior Rating Inventory of Executive Function-Preschool Version” by G. A. Gioia, K.A. Espy, and P. K. Isquith, 2003, p. 2. Copyright 2003 by the Psychological Assessment Resources, Inc.; and “Behavior Rating Inventory of Executive Function” by G. A. Gioia, P. K. Isquith, S. Guy, and L. Kenworthy, 2000, p. 2. Copyright 2000 by the Psychological Assessment Resources, Inc. |
|
Table B: Description of the Combined BRIEF Sub-Scales Utilised in the Current Study
Appendix C: Conners Early Childhood
|
Behaviour Scales |
Subscales |
Behaviour Measured |
|
Inattention/ Hyperactivity |
|
The extent a child controls their attention and hyperactive/impulsive behaviours |
|
Defiant/Aggressive Behaviour |
|
The level of aggressive, defiant, destructive, and/or dishonest behaviours |
|
|
Defiance/Temper |
The level of argumentative, defiant, or manipulative behaviours |
|
|
Aggression |
The level of aggressive, rude, destructive, and/or dishonest behaviour |
|
Social Functioning/ Atypical Behaviour |
|
The extent a child can function socially and levels of odd/unusual behaviour |
|
|
Social Functioning |
The ability to understand social cues and interact with peers in a functional way |
|
|
Atypical Behaviours |
The level of unusual interests, language, and behaviour. The extent a child displays repetitive or inflexible behaviour |
|
Anxiety |
|
Emotional and physical symptoms of anxiety |
|
Mood and Affect |
|
The level of irritability, low mood or self-esteem displayed day-to-day and in play |
|
Physical Symptoms |
|
Symptoms of pain, aches, sickness, eating difficulties, tiredness, sleep difficulties. May have either medical or emotional underpinnings |
|
Sleep Problems |
|
The length and quality of sleep |
|
Note. Adapted from “Conners Early Childhood Manual” by C. K. Conners, pp. 40. Copyright 2009 by Multi-Health Systems Inc. Bold typeface indicates the behavioural scale that was utilised in this study. |
||
Table C1: Description of the Full Length Conners EC Parent Response Booklet Behaviour Scales and Subscales
|
Developmental Milestone Scales |
Skills Measured |
|
Adaptive Skills |
Evaluates a child’s adaptive functioning skills, including their ability to dress, eat/drink, toileting behaviours, and personal hygiene |
|
Communication |
Evaluates a child’s receptive and expressive language |
|
Motor Skills |
Evaluates a child’s fine and gross motor skills |
|
Play |
Evaluates a child’s level of imaginative and pretend play |
|
Pre-Academic/Cognitive |
Evaluates a child’s knowledge of pre-academic concepts, pre-reading skills, and their early memory and reasoning skills |
|
Note. Adapted from “Conners Early Childhood Manual” by C. K. Conners, pp. 42. Copyright 2009 by Multi-Health Systems Inc. Bold typeface indicates the developmental milestone scale that was utilised in this study. |
|
Table C2: Description of the Full Length Conners EC Parent Response Booklet Developmental Milestone Scales
Appendix D: Conners 3rd Edition
|
Behaviour Scales |
Behaviour Measured |
|
Inattention |
Evaluates a child’s ability to concentrate and keep their mind on their work |
|
Hyperactivity/Impulsivity |
Assesses the level of hyperactive and impulsive behaviours that is exhibited by a child. For example, restlessness, excessive talking, or interrupting others |
|
Learning Problems |
Provides an indication of learning, memory, and academic challenges |
|
Executive Functioning |
Evaluates executive functioning deficits. For example, planning, organisation, and the of initiation of tasks |
|
Aggression |
The level of aggressive, rude, destructive, manipulative, and/or dishonest behaviour |
|
Peer Relations |
Assesses a child’s social skills |
|
Note. Adapted from “Conners 3rd Edition Manual” by C. K. Conners, pp. 69. Copyright 2008 by Multi-Health Systems Inc. Bold typeface indicates the scales that were utilised in this study. |
|
Table D: Description of the Conners 3 Short Form (Parent) Content Scales
Appendix E
|
Measures |
WS |
|
TD |
|
|
|
|
|
M (SD) |
Range |
n |
M (SD) |
Range |
n |
|
BRIEF (T scores) |
|
|
|
|
|
|
|
Inhibit |
69.20 (12.11) |
51-91 |
20 |
46.70 (9.13) |
36-78 |
40 |
|
Shift |
62.50 (13.34) |
43-90 |
20 |
43.38 (5.43) |
37-59 |
40 |
|
Emotional Control |
66.05 (12.40) |
38-86 |
20 |
45.17 (8.12) |
35-70 |
40 |
|
Working Memory |
77.15 (10.61) |
58-95 |
20 |
46.43 (9.48) |
36-81 |
40 |
|
Plan/Organise |
71.10 (14.28) |
39-100 |
20 |
46.03 (9.50) |
34-71 |
40 |
|
Global Executive Composite |
74.30 (12.19) |
53-93 |
20 |
44.38 (8.82) |
33-70 |
40 |
|
Conners (T scores) |
|
|
|
|
|
|
|
Inattention-Hyperactivity/ Impulsivity |
69.31 (13.23) |
51-90 |
20 |
48.58 (9.14) |
33-81 |
40 |
|
Early Academic Performance |
67.63 (13.04) |
43-90 |
20 |
46.15 (6.35) |
30-64 |
40 |
|
Note. T-scores (population M = 50, SD = 10). Bold typeface indicates group mean scores that fall within the elevated, very elevated, or clinically impaired range [2,94-97]. |
||||||
Table E: Between Group Descriptive Statistics for the BRIEF Data and Conners Data at Time 1
References
- Mullen, E. M. (1995). Mullen scales of early learning (pp. 58-64). Circle Pines, MN: AGS.
- Wechsler, D. (2007). Wechsler Individual Achievement Test-Second Edition Australian Edition. Sydney: NCS Pearson, Inc.
- Duncan, G. J., Dowsett, C. J., Claessens, A., Magnuson, K., Huston, A. C., Klebanov, P., ... & Japel, C. (2007). School readiness and later achievement. Developmental psychology, 43(6), 1428.
- Watts, T. W., Duncan, G. J., Siegler, R. S., & Davis-Kean, P. E. (2014). What’s past is prologue: Relations between early mathematics knowledge and high school achievement. Educational Researcher, 43(7), 352-360.
- Brawn, G., Kohnen, S., Tassabehji, M., & Porter, M. (2018). Functional basic reading skills in Williams syndrome. Developmental Neuropsychology, 43(5), 454-477.
- Laing, E. (2002). Investigating reading development in atypical populations: The case of Williams syndrome. Reading and Writing, 15(5), 575-587.
- Van Herwegen, J., & Simms, V. (2020). Mathematical development in Williams syndrome: A systematic review. Research in Developmental Disabilities, 100, 103609.
- Miezah, D., Porter, M., Batchelor, J., Boulton, K., & Veloso, G.C. (2020). Cognitive abilities in Williams syndrome. Research in Developmental Disabilities, 104, 103701.
- Mervis, C. B., Greiner de Magalhaes, C., & Cardoso-Martins, C. (2022). Concurrent predictors of word reading and reading comprehension for 9-year-olds with Williams syndrome. Reading and Writing, 35(2), 377-397.
- Pagon, R. A., Bennett, F. C., LaVeck, B., Stewart, K. B., & Johnson, J. (1987). Williams syndrome: Features in late childhood and adolescence. Pediatrics, 80(1), 85-91.
- Kozel, B. A., Barak, B., Kim, C. A., Mervis, C. B., Osborne, L. R., Porter, M., & Pober, B. R. (2021). Williams syndrome. Nature Reviews Disease Primers, 7(1), 42.
- Howlin, P., Elison, S., Udwin, O., & Stinton, C. (2010). Cognitive, linguistic and adaptive functioning in Williams syndrome: Trajectories from early to middle adulthood. Journal of Applied Research in Intellectual Disabilities, 23(4), 322-336.
- Ansari, D., Donlan, C., Thomas, M. S., Ewing, S. A., Peen, T., & Karmiloff-Smith, A. (2003). What makes counting count? Verbal and visuo-spatial contributions to typical and atypical number development. Journal of Experimental Child Psychology, 85(1), 50-62.
- Cragg, L., & Gilmore, C. (2014). Skills underlying mathematics: The role of executive function in the development of mathematics proficiency. Trends in neuroscience and education, 3(2), 63-68.
- Dekker, S., Krabbendam, L., Lee, N., Boschloo, A., De Groot, R., & Jolles, J. (2016). Dominant goal orientations predict differences in academic achievement during adolescence through metacognitive self-regulation. Journal of Educational and Developmental Psychology, 6(1), 47-58.
- Espy, K. A., McDiarmid, M. M., Cwik, M. F., Stalets, M. M., Hamby, A., & Senn, T. E. (2004). The contribution of executive functions to emergent mathematic skills in preschool children. Developmental neuropsychology, 26(1), 465-486.
- Steele, A., Karmiloff-Smith, A., Cornish, K., & Scerif, G. (2012). The multiple subfunctions of attention: Differential developmental gateways to literacy and numeracy. Child development, 83(6), 2028-2041.
- Fryssira, H., Palmer, R., Hallidie-Smith, K. A., Taylor, J., Donnai, D., & Reardon, W. (1997). Fluorescent in situ hybridisation (FISH) for hemizygous deletion at the elastin locus in patients with isolated supravalvular aortic stenosis. Journal of Medical Genetics, 34(4), 306-308.
- Porter, M. A., Dobson-Stone, C., Kwok, J. B., Schofield, P. R., Beckett, W., & Tassabehji, M. (2012). A role for transcription factor GTF2IRD2 in executive function in Williams-Beuren syndrome. PLoS One, 7(10), e47457.
- Schubert, C. (2009). The genomic basis of the Williams–Beuren syndrome. Cellular and Molecular Life Sciences, 66(7), 1178-1197.
- Tassabehji, M. (2003). Williams–Beuren syndrome: a challenge for genotype–phenotype correlations. Human Molecular Genetics, 12(suppl_2), R229-R237.
- Hillier, L. W., Fulton, R. S., Fulton, L. A., Graves, T. A., Pepin,K. H., Wagner-McPherson, C., ... & Wilson, R. K. (2003). The DNA sequence of human chromosome 7. Nature, 424(6945), 157-164.
- Korenberg, J. R., Chen, X. N., Hirota, H., Lai, Z., Bellugi, U., Burian, D., ... & Matsuoka, R. (2000). VI. Genome structure and cognitive map of Williams syndrome. Journal of cognitive neuroscience, 12(Supplement 1), 89-107.
- Strømme, P., Bjømstad, P. G., & Ramstad, K. (2002). Prevalence estimation of Williams syndrome. Journal of child neurology, 17(4), 269-271.
- Mervis, C. B., & Velleman, S. L. (2011). Children with Williams syndrome: Language, cognitive, and behavioral characteristics and their implications for intervention. Perspectives on language learning and education, 18(3), 98-107.
- Miezah, D., Porter, M., Rossi, A., Kazzi, C., Batchelor, J., & Reeve, J. (2021). Cognitive profile of young children with Williams syndrome. Journal of Intellectual Disability Research, 65(8), 784-794.
- Mervis, C. B. (2009). Language and literacy development of children with Williams syndrome. Topics in Language Disorders, 29(2), 149-169.
- Brock, J. (2007). Language abilities in Williams syndrome: A critical review. Development and psychopathology, 19(1), 97-127.
- Martens, M.A., Wilson, S. J., & Reutens, D. C. (2008). Research Review: Williams syndrome: a critical review of the cognitive, behavioral, and neuroanatomical phenotype. Journal of Child Psychology and Psychiatry, 49(6), 576-608.
- Mervis, C. B., & John, A. E. (2010, May). Cognitive and behavioral characteristics of children with Williams syndrome: implications for intervention approaches. In American Journal of Medical Genetics Part C: Seminars in Medical Genetics (Vol. 154, No. 2, pp. 229-248). Hoboken: Wiley Subscription Services, Inc., A Wiley Company.
- Mervis, C. B., & Klein-Tasman, B. P. (2000). Williams syndrome: cognition, personality, and adaptive behavior. Mental retardation and developmental disabilities research reviews, 6(2), 148-158.
- Porter, M. A., & Coltheart, M. (2005). Cognitive heterogeneity in Williams syndrome. Developmental neuropsychology, 27(2), 275-306.
- Dykens, E. M. (2003). Anxiety, fears, and phobias in persons with Williams syndrome. Developmental neuropsychology, 23(1-2), 291-316.
- Leyfer, O. T., Woodruff-Borden, J., Klein-Tasman, B. P., Fricke, J. S., & Mervis, C. B. (2006). Prevalence of psychiatric disorders in 4 to 16-year-olds with Williams syndrome. American Journal of Medical Genetics Part B: Neuropsychiatric Genetics, 141(6), 615-622.
- Cornish, K., & Wilding, J. (2010). Attention, genes, anddevelopmental disorders. Oxford University Press.
- Scerif, G., & Steele, A. (2011). Neurocognitive development of attention across genetic syndromes: inspecting a disorder's dynamics through the lens of another. Progress in brain research, 189, 285-301.
- Gallo, F. J. (2009). Executive functions in young children with Williams syndrome. The University of Wisconsin-Milwaukee.
- Greiner de Magalhães, C., Pitts, C. H., & Mervis, C. B. (2022). Executive function as measured by the Behavior Rating Inventory of Executive Function-2: children and adolescents with Williams syndrome. Journal of Intellectual Disability Research, 66(1-2), 94-107.
- Hocking, D. R., Reeve, J., & Porter, M. A. (2015). Characterising the profile of everyday executive functioning and relation to IQ in adults with Williams syndrome: is the BRIEF adult version a valid rating scale?. PloS one, 10(9), e0137628.
- Reeve, J. L., Porter, M. A. (2023). Executive Functioning in Young Children with Williams Syndrome: A Longitudinal Study. Glob J Intellect Dev Disabil. 12(2), 555834.
- Howlin, P., Davies, M., & Udwin, O. (1998). Cognitive functioning in adults with Williams syndrome. Journal of Child Psychology and Psychiatry and Allied Disciplines, 39(2), 183-189.
- Neale, M. D. (1966). Neale Analysis of Reading Ability Manual. London: Macmillan.
- Rust, J., Golombok, S., & Trickey, G. (1993). WORD Wechsler Objective Reading Dimensions. London: The Psychological Corporation.
- Udwin, O., Davies, M., & Hosylin, P. (1996). A longitudinal study of cognitive abilities and educational attainment in Williams syndrome. Developmental medicine & child neurology, 38(11), 1020-1029.
- Udwin, O., Yule, W., & Martin, N. (1987). Cognitive abilities and behavioural characteristics of children with idiopathic infantile hypercalcaemia. Journal of Child Psychology and Psychiatry, 28(2), 297-309.
- Cornish, K., Steele, A., Monteiro, C. R. C., Karmiloff-Smith, A., & Scerif, G. (2012). Attention deficits predict phenotypic outcomes in syndrome-specific and domain-specific ways. Frontiers in psychology, 3, 227.
- Steele, A., Scerif, G., Cornish, K., & Karmiloff-Smith, A. (2013). Learning to read in Williams syndrome and Down syndrome: Syndrome-specific precursors and developmental trajectories. Journal of child psychology and psychiatry, 54(7), 754-762.
- Howlin, P., & Udwin, O. (2006). Outcome in adult life for people with Williams syndrome–results from a survey of 239 families. Journal of Intellectual Disability Research, 50(2), 151-160.
- Laing, E., Hulme, C., Grant, J., & Karmiloff-Smith, A. (2001). Learning to read in Williams syndrome: Looking beneath the surface of atypical reading development. The Journal of Child Psychology and Psychiatry and Allied Disciplines, 42(6), 729-739.
- Levy, Y., Smith, J., & Tager-Flusberg, H. (2003). Word reading and reading-related skills in adolescents with Williams syndrome. Journal of Child Psychology and Psychiatry, 44(4), 576-587.
- Levy, Y., & Antebi, V. (2004). Word reading and reading-related skills in Hebrew-speaking adolescents with Williams syndrome. Neurocase, 10(6), 444-451.
- Becerra, A. M., John, A. E., Peregrine, E., & Mervis, C. B. (2008). Reading abilities of 9-17-year-olds with Williams syndrome: Impact of reading method. Symposium on Research in Child Language Disorders: Madison, WI.
- Menghini, D., Verucci, L., & Vicari, S. (2004).Reading and phonological awareness in Williams syndrome. Neuropsychology, 18(1), 29.
- Paterson, S. J., Girelli, L., Butterworth, B., & Karmiloff-Smith, A. (2006). Are numerical impairments syndrome specific? Evidence from Williams syndrome and Down's syndrome. Journal of Child Psychology and Psychiatry, 47(2), 190-204.
- O’Hearn, K., & Landau, B. (2007). Mathematical skill in individuals with Williams syndrome: Evidence from a standardized mathematics battery. Brain and Cognition, 64(3), 238-246.
- O'Hearn, K., & Luna, B. (2009). Mathematical skills in Williams syndrome: Insight into the importance of underlying representations. Developmental disabilities research reviews, 15(1), 11-20.
- Paterson, S. J., Brown, J. H., Gsodl, M. K., Johnson, M. H., & Karmiloff-Smith, A. (1999). Cognitive modularity and genetic disorders. Science, 286(5448), 2355-2358.
- Van Herwegen, J., Ansari, D., Xu, F., & Karmiloff-Smith,A. (2008). Small and large number processing in infants and toddlers with Williams syndrome. Developmental science, 11(5), 637-643.
- Dolscheid, S., & Penke, M. (2018). Quantifier comprehension is linked to linguistic rather than to numerical skills. Evidence from children with Down syndrome and Williams syndrome. PLoS One, 13(6), e0199743.
- O'Hearn, K., Hoffman, J. E., & Landau, B. (2011). Small subitizing range in people with Williams syndrome. Visual Cognition, 19(3), 289-312.
- Rousselle, L., Dembour, G., & Noël, M. P. (2013). Magnitude representations in Williams syndrome: Differential acuity in time, space and number processing. PloS one, 8(8), e72621.
- Steele, A., Brown, J., & Scerif, G. (2012). Integrating domain-general and domain-specific developmental processes: Cross-syndrome, cross-domain dynamics. Neurodevelopmental disorders across the lifespan: a neuroconstructivist approach, 338-362.
- Meyer-Lindenberg, A., Mervis, C. B., & Faith Berman,K. (2006). Neural mechanisms in Williams syndrome: a unique window to genetic influences on cognition and behaviour. Nature Reviews Neuroscience, 7(5), 380-393.
- Van Herwegen, J., Ranzato, E., Karmiloff-Smith, A., & Simms,V. (2020). The foundations of mathematical development in Williams syndrome and Down syndrome. Journal of Applied Research in Intellectual Disabilities, 33(5), 1080-1089.
- Wechsler, D. (2005). Wechsler Individual Achievement Test (WIAT-II UK). Harcourt Assessment.
- Krajcsi, A., Lukács, Á., Igács, J., Racsmány, M., & Pléh, C. (2009). Numerical abilities in Williams syndrome: Dissociating the analogue magnitude system and verbal retrieval. Journal of Clinical and Experimental Neuropsychology, 31(4), 439-446.
- Mervis, C. B., & Klein-Tasman, B. P. (2004). Methodological issues in group-matching designs: α levels for control variable comparisons and measurement characteristics of control and target variables. Journal of autism and developmentaldisorders, 34(1), 7-17.
- Wechsler, D. (1981). The psychometric tradition: developing the wechsler adult intelligence scale. Contemporary Educational Psychology.
- Wechsler, D. (1997). Wechsler Adult Intelligence Scale. The Psychological Corporation. San Antonio, TX .
- Avery, R. O., Slate, J. R., & Chovan, W. (1989). A longitudinal study of WISC-R and WAIS-R scores with students who are educable mentally handicapped. Education and Training in Mental Retardation, 28-31.
- Sattler, J. M. (1982). Assessment of children's intelligence and special abilities. Allyn & Bacon.
- Tassabehji, M., Metcalfe, K., Fergusson, W. D., Carette, M. J., Dore, J. K., Donnai, D., ... & Sheer, D. (1996). LIM–kinase deleted in Williams syndrome. Nature genetics, 13(3), 272-273.
- Ginsburg, H., & Baroody, A. J. (1983). Test of early mathematics ability: TEMA.
- Kim, H., & Cameron, C. E. (2016). Implications of visuospatial skills and executive functions for learning mathematics: Evidence from children with autism and Williams syndrome. AERA open, 2(4), 2332858416675124.
- Siegel, L. S. (1992). An evaluation of the discrepancy definition of dyslexia. Journal of learning disabilities, 25(10), 618-629.
- Wechsler, D. (2009). Wechsler Memory Scale (4th ed.). San Antonio, TX: NCS Pearson.
- Karmiloff-Smith, A., D’Souza, D., Dekker, T. M., Van Herwegen, J., Xu, F., Rodic, M., & Ansari, D. (2012). Genetic and environmental vulnerabilities in children with neurodevelopmental disorders. Proceedings of the National Academy of Sciences, 109(supplement_2), 17261-17265.
- Ginsburg, H., & Baroody, A. J. (1990). TEMA-2: Test of early mathematics ability. Pro-Ed.
- Uttal, D. H., Meadow, N. G., Tipton, E., Hand, L. L., Alden, A. R., Warren, C., & Newcombe, N. S. (2013). The malleability of spatial skills: a meta-analysis of training studies. Psychological bulletin, 139(2), 352.
- Zelazo, P. D., Blair, C. B., & Willoughby, M. T. (2016). Executive Function: Implications for Education. NCER 2017-2000. National Center for Education Research.
- Anderson, V. (1998). Assessing executive functions in children: Biological, psychological, and developmental considerations. Neuropsychological rehabilitation, 8(3), 319-349.
- Osorio, A., Cruz, R., Sampaio, A., Garayzabal, E., Martínez-Regueiro, R., Gonçalves, Ó. F., ... & Fernandez-Prieto, M. (2012). How executive functions are related to intelligence in Williams syndrome. Research in developmental disabilities, 33(4), 1169-1175.
- Waid-Ebbs, J. K., Wen, P. S., Heaton, S. C., Donovan, N. J., & Velozo, C. (2012). The item level psychometrics of the behaviour rating inventory of executive function-adult (BRIEF-A) in a TBI sample. Brain injury, 26(13-14), 1646-1657.
- Blair, C., Ursache, A., Greenberg, M., & Vernon-Feagans, L. (2015). Multiple aspects of self-regulation uniquely predict mathematics but not letter–word knowledge in the early elementary grades. Developmental psychology, 51(4), 459.
- Bull, R., Espy, K. A., Wiebe, S. A., Sheffield, T. D., & Nelson,J. M. (2011). Using confirmatory factor analysis to understand executive control in preschool children: Sources of variation in emergent mathematic achievement. Developmental science, 14(4), 679-692.
- Bull, R., & Lee, K. (2014). Executive functioning and mathematics achievement. Child development perspectives, 8(1), 36-41.
- Menon, V. (2010). Developmental cognitive neuroscience of arithmetic: implications for learning and education. Zdm, 42(6), 515-525.
- Strattman, K., & Hodson, B. W. (2005). Variables that influence decoding and spelling in beginning readers. Child Language Teaching and Therapy, 21(2), 165-190.
- Banales, E., Kohnen, S., & McArthur, G. (2015). Can verbal working memory training improve reading?. Cognitive Neuropsychology, 32(3-4), 104-132.
- Dally, K. (2006). The influence of phonological processing and inattentive behavior on reading acquisition. Journal of Educational Psychology, 98(2), 420.
- Cornish, K., Scerif, G., & Karmiloff-Smith, A. (2007). Tracing syndrome-specific trajectories of attention across the lifespan. Cortex, 43(6), 672-685.
- Rhodes, S. M., Riby, D. M., Matthews, K., & Coghill, D. R. (2011). Attention-deficit/hyperactivity disorder and Williams syndrome: shared behavioral and neuropsychological profiles. Journal of clinical and experimental neuropsychology, 33(1), 147-156.
- Conners, C. K. (1997). Conners' rating scales-revised: Technical manual. (No Title).
- Gioia, G. A., Espy, K. A., & Isquith, P. (2003). Behavior Rating Inventory of Executive Function-Preschool Version. Lutz, FL: Psychological Assessment Resources, Inc.
- Gioia, G. A., Isquith, P. K., Guy, S. C., & Kenworthy, L. (2000). Behavior Rating Inventory of Executive Function. Lutz, FL: Psychological Assessment Resources, Inc.
- Conners, K. C. (2008). Conners Rating Scales, 3rd Edition. Toronto, ON: Multi-Health Systems Inc.
- Conners, C. K., (2009). Conners Early Childhood (Conners EC) Manual. Toronto, ON: Multi-Health Systems Inc.
- Farmer, C., Golden, C., & Thurm, A. (2016). Concurrent validity of the differential ability scales, with the Mullen Scales of Early Learning in young children with and without neurodevelopmental disorders. Child Neuropsychology, 22(5), 556-569.
- Rogers, S. J., Estes, A., Lord, C., Vismara, L., Winter, J., Fitzpatrick, A., ... & Dawson, G. (2012). Effects of a brief Early Start Denver Model (ESDM)–based parent intervention on toddlers at risk for autism spectrum disorders: A randomized controlled trial. Journal of the American Academy of Child & Adolescent Psychiatry, 51(10), 1052-1065.
- Elliott, C. D. (2007). Differential Ability Scales-Second Edition: Introductory and technical handbook. San Antonio:Harcourt Assessment.
- Australian Bureau of Statistics. (2016). Census of population and housing: Socio-Economic Indexes for Areas (SEIFA), Australia, 2016. [Dataset]. Australian Bureau of Statistics.
- Mervis, C. B., Robinson, B. F., Bertrand, J., Morris, C. A., Klein-Tasman, B. P., & Armstrong, S. C. (2000). The Williams syndrome cognitive profile. Brain and cognition, 44(3), 604-628.
- Mervis, C. B., & Pitts, C. H. (2015, June). Children with Williams syndrome: Developmental trajectories for intellectual abilities, vocabulary abilities, and adaptive behavior. In American Journal of Medical Genetics Part C: Seminars in Medical Genetics (Vol. 169, No. 2, pp. 158-171).
- Kazzi, C., Porter, M., Zhong, Q., Veloso, G., & Reeve, J. (2021). The relationship between anxiety and executive functioning in children with Williams syndrome. Global Journal of Intellectual & Developmental Disabilities, 8(4), 555745.
- Bishop, S. L., Guthrie, W., Coffing, M., & Lord, C. (2011). Convergent validity of the Mullen Scales of Early Learning and the differential ability scales in children with autism spectrum disorders. American journal on intellectual and developmental disabilities, 116(5), 331-343.
- Ng-Cordell, E., Hanley, M., Kelly, A., & Riby, D. M. (2018). Anxiety in Williams syndrome: the role of social behaviour, executive functions and change over time. Journal of autism and developmental disorders, 48(3), 796-808.
- American Psychiatric Association. (2013). Diagnostic and statistical manual of mental disorders (5th ed.). Arlington, VA: American Psychiatric Publishing.
- Leader, G., Moore, R., Chen, J. L., Caher, A., Arndt, S., Maher, L., ... & Mannion, A. (2022). Attention deficit hyperactivity disorder (ADHD) symptoms, comorbid psychopathology, behaviour problems and gastrointestinal symptoms in children and adolescents with autism spectrum disorder. Irish Journal of Psychological Medicine, 39(3), 240-250.
- Ng, R., Heinrich, K., & Hodges, E. K. (2019). Brief report: Neuropsychological testing and informant-ratings of children with autism spectrum disorder, attention-deficit/hyperactivity disorder, or comorbid diagnosis. Journal of autism and developmental disorders, 49(6), 2589-2596.
- Rothman, K. J. (1990). No adjustments are needed for multiple comparisons. Epidemiology, 1(1), 43-46.
- Campbell, L. E., Daly, E., Toal, F., Stevens, A., Azuma, R., Karmiloff-Smith, A., ... & Murphy, K. C. (2009). Brain structural differences associated with the behavioural phenotype in children with Williams syndrome. Brain research, 1258, 96-107.
- Porter, M. A., Dodd, H., & Cairns, D. (2009). Psychopathological and behavior impairments in Williams-Beuren syndrome: the influence of gender, chronological age,and cognition. Child Neuropsychology, 15(4), 359-374.
- Rhodes, S. M., Riby, D. M., Park, J., Fraser, E., & Campbell,L. E. (2010). Executive neuropsychological functioning in individuals with Williams syndrome. Neuropsychologia, 48(5), 1216-1226.
- Nakagawa, S. (2004). A farewell to Bonferroni: the problems of low statistical power and publication bias. Behavioral ecology, 15(6), 1044-1045.
- Cohen, J. (1988). Statistical power analysis for the behavioural sciences. Hillsdale, NJ: Erlbaum.
- Dolean, D., Melby-Lervåg, M., Tincas, I., Damsa, C., & Lervåg, A. (2019). Achievement gap: Socioeconomic status affects reading development beyond language and cognition in children facing poverty. Learning and Instruction, 63, 101218.
- Best, J. R., Miller, P. H., & Naglieri, J. A. (2011). Relations between executive function and academic achievement from ages 5 to 17 in a large, representative national sample. Learning and individual differences, 21(4), 327-336.
- Kolkman, M. E., Kroesbergen, E. H., & Leseman, P. P. (2014). Involvement of working memory in longitudinal development of number–magnitude skills. Infant and Child Development, 23(1), 36-50.
- Lan, X., Legare, C. H., Ponitz, C. C., Li, S., & Morrison, F. J. (2011). Investigating the links between the subcomponents of executive function and academic achievement:Across-cultural analysis of Chinese and American preschoolers. Journal of experimental child psychology, 108(3), 677-692.
- Pingault, J. B., Tremblay, R. E., Vitaro, F., Carbonneau, R., Genolini, C., Falissard, B., & Côté, S. M. (2011). Childhood trajectories of inattention and hyperactivity and prediction of educational attainment in early adulthood: a 16-year longitudinal population-based study. American Journal of Psychiatry, 168(11), 1164-1170.
- Vivanti, G., Fanning, P. A., Hocking, D. R., Sievers, S., & Dissanayake, C. (2017). Social attention, joint attention and sustained attention in autism spectrum disorder and Williams syndrome: Convergences and divergences. Journal of autism and developmental disorders, 47(6), 1866-1877.
- Manly, T., Robertson, I. H., Anderson, V., & Nimmo-Smith,I. (1999). The Test of Everyday Attention for Children (TEA-Ch). Bury St. Edmunds: Thames Valley Test Company.
- Hatcher, P. J., Hulme, C., & Ellis, A. W. (1994). Ameliorating early reading failure by integrating the teaching of reading and phonological skills: The phonological linkage hypothesis. Child development, 65(1), 41-57.
- Elliott, C. D., Smith, P., & McCulloch, K. (1996). British ability scales II. Windsor. UK: Nfer-Nelson.
- Dunn, L. M., & Markwardt, F. C. (1970). Examiner’s manual: Peabody Individual Achievement Test. Circle Pines, MN: American Guidance Service.
Footnotes
1 The Howlin et al. study utilised identical measures to the Udwin et al. study [41,44]. The sample also included 23 WS individuals who were involved in the earlier Udwin et al. study [45]. Time 1: age range was 6 to 16 years, no mean age provided; Time 2: age range was 19 to 39 years, and mean age was 26.49 years.
2 Single word reading skills were measured using the Early Word Reading ability scale (EWR) and the British Ability Scale, Second Edition (BAS-II) [123,124]. As some children in the study fell out of the normed age range on these tests, a single word reading raw score was computed by calculating the number of correctly read words on each test. Of note, children were only administered the BAS-II if they achieved a raw score of 34 or above on the EWR. If they were administered both tests, raw scores were added and then 20 points was subtracted to allow for the overlap between reading level for the EWR and the first 20 items on the BAS-II. See Steele et al. for further details [47].
3 As measured by the individuals highest standard score on either the Reading Recognition [identifying sounds and single word reading] or Reading Comprehension subtests on the Peabody Individual Achievement Test [125].
4 Using the r values proposed by Cohen [115].
5 Either ≤ - 1.5 or ≥ + 1.5 standard deviations
6 The study found that WS children who were taught to read using a systematic phonics method showed significantly greater reading abilities than children taught with other methods of instruction.
7 The same non standardised tasks as those administered by Steele et al. described above [47].
8 Significant discrepancy was calculated by using a conservative approach of 1.5 standard deviations (i.e., either ≤ -1.5 or ≥ +1.5) based on the normative population (population mean = 100 and standard deviation = 15). This is in line with Brawn et al. [2,5].