
Petroleum and Chemical Industry International(PCII)
ISSN: 2639-7536 | DOI: 10.33140/PCII
Impact Factor: 0.719

Short Communication - (2025) Volume 8, Issue 1
Dynamics of Total Petroleum Hydrocarbon Content in the Surface Waters of Green Fjord (Greenland Sea)
2MGIMO University, Moscow, Russia
3North-West branch of FSBI “NPO Typhoon”, Russia
Received Date: Feb 14, 2025 / Accepted Date: Mar 10, 2025 / Published Date: Mar 18, 2025
Copyright: ©Ã???Ã??Ã?©2025 Alina Alexandrova, et al. This is an open-access article distributed under the terms of the Creative Commons Attribution License, which permits unrestricted use, distribution, and reproduction in any medium, provided the original author and source are credited.
Citation: Alexandrova, A., Aleksandrova, N., Demeshkin, A. (2025).Dynamics of Total Petroleum Hydrocarbon Content in the Surface Waters of Green Fjord (Greenland Sea). Petro Chem Indus Intern, 8(1), 01- 03.
Abstract
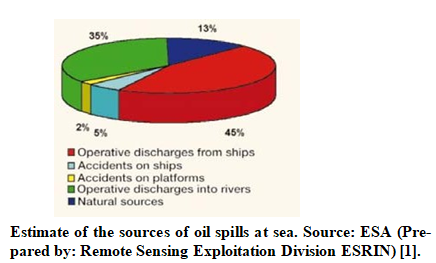
Oil pollution is one among the most dangerous factors of anthropogenic impact on aquatic ecosystems, the amount of oil spilled annually worldwide has been estimated at more than 4.5 million tons [1].
Introduction
Oil pollution is one among the most dangerous factors of anthropogenic impact on aquatic ecosystems, the amount of oil spilled annually worldwide has been estimated at more than 4.5 million tons [1].Wastewater discharge and local economic activities, namely, wastewater containing various hydrocarbons, makes a source of pollution not related to oil production. Leakage of oil products’ components also takes place due to migration and dispersion processes during operations of oilfield facilities. In this article in purpose to investigate spatial and temporal variability of petroleum hydrocarbon concentrations an overview is performed based on the data from the areas of high economic activity. Local sources may also contribute to some elevated PAH and THC levels in the sediments of the Green Fjord (Grønfjorden), the Greenland Sea). Waste disposals containing oil products bring about 10% of HC pollution recorded in coastal economic activities, which include oil storage and oil processing wastes as well. Some notable features of oil distribution in seawaters are the heterogeneity of its content in aquatic ecosystems, localization at the interface between water and atmosphere, in bottom sediments and along the coastline [2].
How different can be the features of distribution of petroleum hydrocarbons in different parts of the Green Fjord? Can the existing concentrations affect badly on the conditions of the marine environment and sedimentation? As noted, the identification of environmental factors of a cyclic nature is an important scientific task in oceanology and accounting to the cyclical nature of changes in the environment makes it possible to conduct a comparative analysis of transformations and substantiate the effect of polluting factor.
At present, there are sufficient long-term series of reliable obser- vations of physical characteristics of seawaters and only some fragmentary data on hydrochemical parameters of the aquatic envi- ronment (in regards to the content of oil hydrocarbons in seawater/ bottom sediments). It is very important that the specialized hydro- chemical data banks should be created for the purpose of environ- mental monitoring and assessment of pollution levels. The results of this study are supposed to be used in a comprehensive assessment of anthropogenic impact, accounting to oil pollution and can possibly help to identify the processes between ongoing changes and influ- encing factors. All samples have been processed and analyzed for levels of organic contaminants and the values of total hydrocarbon content (THC).
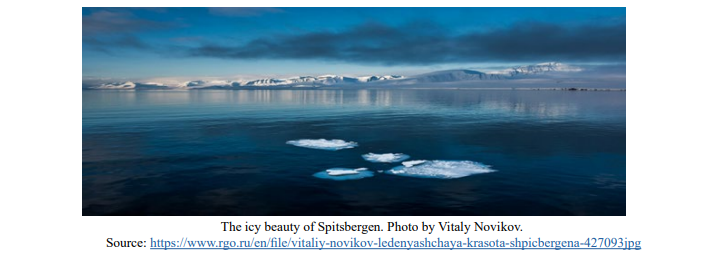
Study Area
The Green Fjord, located in the Western Svalbard, is a part of the East Fjord (Spitsbergen archipelago, Greenland Sea). Herein in purpose to determine the levels of pollutants, including petroleum hydrocarbons (THC) the North-Western Branch of the FSBI RPÃÃÂ?ÂÂÂÃÂ?ÂÂ «Typhoon» took samples in the surface and in the near-bottom horizons. The fjords of southwestern Spitsbergen (European Arctic) are a climatically sensitive area neighboring the mixing zone of warm Atlantic water-masses and cold Arctic Water. Owing to reasonably high accumulation rates, these settings are especially suitable for providing high-resolution sedimentary records of regional hydrological and environmental changes. There is also a considerable number of watercourses in the area, which contribute to the accelerated rate of sedimentation in the basin. The consequences of accidental spills and natural hydrocarbon discharges can have a negative impact on basin ecosystems and sedimentation. Sedimentation undergoes spatial and temporal changes associated with the dynamics of the aquatic environment. The Svalbard archipelago is located in the high Arctic (76°-80°N) within the northernmost reach of the West Spitsbergen Current (WSC), which is the continuation of the North Atlantic Current. In this specific setting close to the Polar Front, even small variations in the system of flows are expected to provide large and distinct signals in palaeoceanographic parameters [3]. The Greenland Sea is the deepest sea of the Arctic Ocean: its average depth is 1450m, maximum depth is about 4800 – 5527 m. In the central part of the sea WSC forms powerful cyclonic eddies. The Green Fjord gulf is located between 77°07´ and 77°58´ N. latitude and 13°56´ and 14°20´ E. longtitude in the western part of the archipelago and extends meridionally to the South-South-East. It constitutes the Southwestern branch of the East Fjord, goes far into the land, its southern coast borders on relatively large glaciers while the water area of the gulf is open to the Arctic basin. It extends southward for 17 km with the maximum depth – 155 m. Besides, the North European Basin (NEB) including the Norwegian Sea and the Greenland Sea plays a key role in exchange between the Arctic Basin (AB) and the North Atlantic (NA). The total area is more than 193 km2 and 60 km2 of it – a subject to glaciation [4].
At present, the region of the Norwegian and the Greenland Seas remains the object of intensive field research. The concentrations of most of the pollutants in the waters of the Green Fjord showed values typical for the coastal waters of the Norwegian Sea and the North Sea. Monitoring of the seawaters is maintained according to water quality requirements for fishery reservoirs. The results make it possible to classify the waters ofthe gulf in summer periods of 2019, 2020 as «moderately polluted» and classify them as quality class III with an average or insignificant level of impact of coastal sources of pollution on the sea, which is consistent with the Norwegian classification (moderat, klasse III) [5-8]. This study is performed to continue the previous studies.
Result and Discussion
Generally, samples of local monitoring were taken at stations adjacent to the territory of Barentsburg in the eastern part of the Green Fjord. The results of the work during the expeditions highlight the transition from the summer warming phase with the maximum influence river runoff to the autumn cooling phase with reduced river runoff. The location of the stations is chosen accounting to geomorphological characteristics of the bottom and the configuration features of the gulf. The results of THC study (µg/dm3) in the surface horizon (0.5 m) showed average concentrations in seaward direction differentiating from 5 to 22 µg/dm3 with a local maximum of 86 µg/ dm3 (at station 14) at the confluence of the stream flowing through Barentsburg. An increase in the concentration of hydrocarbons in the surface horizon is taking place in the range of 33 - 70 µg/dm3 (stations 28, 26) in the coastal areas of the Green Fjord. An overview of THC levels in surface waters is shown in Figure 1. The maximum values declined in the later period and reached 3 µg/dm3 (in 2021). In 2016 average concentrations were approximately at the level of 2015, but lower than those of the previous years, where their values in 2014, 2015 averaged 38-29 µg/dm3 and at the western margin of the Green Fjord gulf reaching up to 42 µg/dm3.
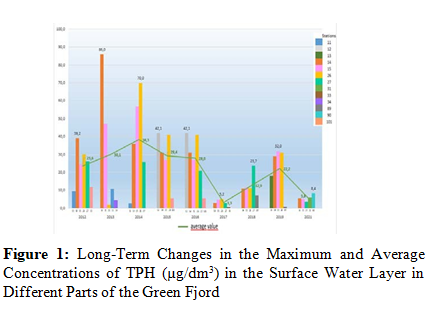
In this part of the basin, the content of hydrocarbons in the surface water layer varies on average from 5 to 22 µg/dm3, with a local maximum of up to 86 µg/dm3. In 2012 THC ranged from 9 to 39 µg/dm3, with an average value of 19 µg/dm3. In 2013 in the waters of the eastern part of the Green Fjord THC was in the range 2
- 86 ((in the water intake area and in the area of the confluence of the stream flowing through Barentsburg accordingly), with an average value of 10 µg/dm3. In 2014 THC varied within 2 - 70 µg/dm3 (in the northern part of the Green Fjord and in the area of the confluence of the stream flowing through Barentsburg accordingly), with an average value of 26 µg/dm3.In 2015 it varied within 5 - 70 µg/dm3, with an average value of 25 µg/dm3. In 2016, THC concentrations ranged within 5 – 42 µg/dm3, with an average value of 25 µg/dm3. In 2017 the range of THC – from 0.6 to 5 µg/ dm3 with an average value of 2 µg/dm3. In 2018 THC varied from 7 to 23 µg/dm3 ((in the adjacent water area of the Billefjorden to the North of Barentsburg), with an average value of 12 µg/dm3. In 2019, THC in the waters varied from 1 (in the water area of the Bill fjord Bay) to 32 µg/dm3 (in the water area of the Green Fjord in the area where the stream flows north of Barentsburg), with an average value of 15 µg/dm3. .
THC concentrations ranged from 3 - 5 µg/dm3 with an average value of 4 µg/dm3 in 2021. The average THC in the study area decreased for different areas in the sequence: waters of the Green Fjord at the confluence of a stream flowing through Barentsburg, station 14 (22 µg/dm3), to the water area of the gulf to the north of Barentsburg (9 µg/dm3) and to the gulf outlet (5 µg/dm3) (Western part < Central part). The highest values of THC (70-86 µg/dm3) are observed in 2019 in the surface waters. Maximum values of total hydrocarbons content, (µg/dm3) in surface waters for the period from 2012 to 2021 in different areas of the Green Fjord varied from 19 (in the open part) to 86 μg/dm3 in the area of the confluence of the stream flowing through Barentsburg.
Conclusion
The maximum content of THC was recorded at station 14 in the surface layer of seawaters at a depth of 87 m in the Greenland Sea in the area north of Barentsburg. There was a tendency to reduce the degree of pollution in the following five years since 2017.In 2021 lower concentrations of hydrocarbons in the gulf compared to previous years may occur due to a decrease in oil pollution and increased protection measures and supervisory activities. Local high concentrations for THC in the surface
horizon may be an evidence of the fact that economic activity has a marked anthropogenic impact on the water area along the coastline. The results of the work can be applied further in the development of measures for rehabilitation of water resources. Besides, the research works confirm that the Green Fjord is a rather representative area for conducting comprehensive observations in order to obtain estimates of the impact of economic activity on coastal environment, the state of sea hydrochemical balance and the level of pollution of seawater bodies.
Author Contributions
Authors all contributed to this work, took part in data processing.
A.A. conducted the research and wrote the paper; A.D. collected samples and participated in data analysis; N.A. participated in data analysis and visualized the results; all authors had approved the final version.
References
1. Oil pollution monitoring. ESA. https://www.esa.int/esapub/ br/br128/br128_1.pdf
2. Yu, K. T., Loginov, O. N. (2019). Oil pollution of the aquatic environment: features and impact on various objects of the hydrosphere, the main cleaning methods. Ecobiotech, 2(2):
pp. 157-174, 158.
3. Å?lubowska, M. A., Koç, N., Rasmussen, T. L., & Klitgaardâ? Kristensen, D. (2005). Changes in the flow of Atlantic water into the Arctic Ocean since the last deglaciation: Evidence from the northern Svalbard continental margin, 80 N. Paleoceanography, 20(4).
4. Nikolaev, Y., & Alekseev, G. V. (1989). Structures and variability of large-scale oceanologic processes and fields in the Norwegian energetically active zone. Gidrometteoizdat Publ. Ltd, 1-128.
5. Korshenko, A. N. (Ed.). (2019). Quality of Seawaters based on Hydrochemical Indicators. Yearbook 2018.
6. Korshenko, A. N. M. (2015). The quality of sea waters in terms of hydrochemical indicators.
7. Korshenko A.N. (Ed). (2022). The quality of sea waters by hydro chemical indicators. Yearbook 2021.
8. Boitsov, S., Jensen, H. K., & Klungsøyr, J. (2009). Geographical variations in hydrocarbon levels in sediments from the Western Barents Sea. Norwegian Journal of Geology/ Norsk Geologisk Forening, 89.