

Archives of Epidemiology & Public Health Research(AEPHR)
ISSN: 2833-4353 | DOI: 10.33140/AEPHR
Impact Factor: 1.98


Research Article - (2024) Volume 3, Issue 2
Disinfectant By-Product Formation Upon Water Treatment Using PUR
2Ministry of Health-Rwanda, Muhororo Hospital, Uganda
3Africa One Consult Limited, Entebbe, Uganda
4Health Quality Improvement Manager, Doctors without Borders/ West Africa and Central Africa, Abidjan, Uganda
5Médecins Sans Frontières, Uganda
6University of Rwanda, College of Medicine and Health Sciences, Uganda
7University of Rwanda, Regional Center of Excellence in Biomedical Engineering and E-Health, Uganda
8Ministry of Health-Rwanda, Community Health Department, Uganda
9Ndera Neuropsychiatric Teaching Hospital, Uganda
10University Teaching Hospital of Butare, Uganda
11Byumba Teaching Hospital, Uganda
Received Date: Sep 19, 2024 / Accepted Date: Oct 03, 2024 / Published Date: Jul 11, 2024
Copyright: ©Â©2024 NIZEYIMANA Fidele, et al. This is an open-access article distributed under the terms of the Creative Commons Attribution License, which permits unrestricted use, distribution, and reproduction in any medium, provided the original author and source are credited.
Citation: Nizeyimana, F., Faustino, M. O., Musoke. M., Nkurikiyintwali, J.M. V., Mutabazi, P., Niyitegeka, J. P., Mukeshimana, J. A, Niyonkuru, F., Butoya, P., Gatsinzi, M. J., Uwihoreye, P., Ndayisaba, C., Ngulube, D. J., Nyangezi, P. M., Girizina, D., Niyonsenga, T., Iradukunda, J. M. V. & Igirukwayo, I. (2024). Microbiological and Physico-Chemical Effectiveness of PUR Water Purifier on Different Water Sources. Arch Epidemiol Pub Health Res, 3(2), 01-05.
Abstract
The study determined the possibility of Disinfectant By-Products (DBP) formation when water sources of Akagera river marshy are treated using PUR.
A randomized control trial design was adopted where a total of 84 water samples were collected from 21 water sources selected purposively from Akagera river marshy in Juru sector. These were randomized into 42 controls and 42 for intervention with analytical treatment. Samples were tested for turbidity and ammonia. To determine the correct dose of PUR to be used, the effectiveness was tested using the dose recommended by the manufacturer and secondly, the dose of 2 sachets per 15 liters of raw water.
The results showed a statistically significant reduction of turbidity in treated water (p<0.02) for both dose 1 sachet and dose 2 sachets. No significant reduction of ammonia was observed (p<0.15 for the dose of 1 sachet and p<0.108 for the dose of 2 sachets).
It was, therefore, found that DBPs are likely to occur in water treatment using PUR based on the level of ammonia, the precursor, in water. To eliminate DBPs precursors, the study suggested two ways recommended by Zasouli Ali Mohammad and Kalankesh (2017) [1] to adopt: retention of raw water and the use of coal-based carbon.
Keywords
Disinfection By-Products (DBPs), Water Treatment, PUR, TurbidityIntroduction
Water purification is the process of adding chlorine or chlorine compounds such as sodium hypochlorite to water. This method is used to kill bacteria, viruses and other microbes in water. In particular, chlorination is used to prevent the spread of waterborne diseases such as cholera, dysentery, and typhoid [2]. Household water treatment is important to improve quality of water from different sources that are likely to have contaminants [3].
At pre- and post-disinfection step, chlorine reacts with the presence of natural organic matter in water source and it causes formation of Disinfection By-Products (DBPs), such as Trihalomethanes (THMs). DBPs levels can vary greatly within a single water supply, depending on both water quality (e.g., total organic carbon, pH, ammonia, carbonate alkalinity) and treatment conditions (e.g., disinfectant dose, contact time, Total Organic Compound (TOC) removal before disinfection) [4]. Th e use of low dosage of chlorine may lead to inefficient disinfection and the use of high dosage of chlorine may results in high concentrations of DBPs. HOCl reacts with many organic components and destroys efficiently many forms of bacteria and viruses. As a result of the chlorine reaction with organic matter, DBPs will be formed [5].
The formation of DBPs known as Halocetonitriles (HANs) is observed; when in chlorinated water nitrogen containing organic material is present. The nucleophile NH3 attacks the HOCl; formed by adding chlorine into water. DBPs which are formed during chloramination often contain nitrogen [6]. It was demonstrated that DBP formation is affected by the pH of treated water, its turbidity, its ambient temperature, the natural organic matter (NOM) concentration, the nature of disinfectant and its concentration [7].
The epidemiological studies have proved associations between DBPs and adverse health effects, including bladder cancer, stillbirths, and children born small for gestational age, miscarriages and serious birth defects [8]. The study conducted by Kelly and Reynold in 2012 revealed that humans exposed to DBPs could experience liver damage and decreased nervous system activity [9]. The most consistent association has been for bladder cancer where European males meta-analysis indicated that bladder cancer was 47% more prevalent among those consuming water with THMs > 50μg/L compared to those consuming water with THMs < 5μg/L. Given that pathogen inactivation is the primary goal of water treatment and that DBPs represent a widespread environmental exposure route to carcinogens, removing DBPs in water is difficult, but important challenge [8].
In the U.S., the Stage 1 and 2 Disinfectants and Disinfection By-Products Rules reduced the regulatory limits on THM4 to 80 μg/L and regulated HAA5 at 60 μg/L for the first time [10]. Viable techniques involving the usage of granular activated carbon or membranes to retain DBP precursors then add chlorine for killing pathogens [11]. The study was conducted to determine the possibility of Disinfectant By-Products formation when water sources of Akagera river marshy in Juru sector are treatment using PUR.
Materials and Methods
Study design and period
The study was experimental and collected quantitative data from selected water sources. The study adopted a randomized control trial design. The study was conducted from 2018 to 2023.
Population
The study was conducted on 21 water sources selected purposively from Akagera river marshy in Juru sector
Sampling methods
A purposive sampling technique was used to select the water sources making up the target population from which water samples was taken.
Sample size
A total of 84 samples (100ml for each) were collected and treated using PUR before being analyzed. Of them, 21 samples were treated using a dose of 1 sachet per 10 liters, 21 samples were treated using a dose of 2 sachets per 15 liters and 42 samples used as controls.

Figure 1: Sketch Showing the Adopted Randomized Control Trial Design
Study tools
To determine the correct dose of PUR to be used for each water source, researcher tested the effectiveness using the dose of PUR recommended by PUR manufacturer (1 sachet per 10 liters of raw water) and secondly, researcher tested the effectiveness using the dose of 2 sachets per 15 liters of raw water. For sample transporta-tion conditions, samples were collected in Whirl-pak® Thio-Bag® and kept in thermos with ice packs keeping the temperature less than 40C. Water samples were transported to the Laboratory of water analysis within approximately 5 hours. The collected 42 samples (21 samples treated using a dose of 1 sachet per 10 liters and 21 samples treated using a dose of 2 sachets per 15 liters) were tested for turbidity and ammonia using Wegtech Potatest FC Count Instruments Kit. Water turbidity and ammonia were measured by direct test using photometer instrument from Wegtech Potatest FC Count Instruments Kit.
Statistical analysis
Quantitative data were entered and processed in computer pro¬grams SPSS to test the level of significance, and excel to make fig¬ures showing the trends of changes. Due to the nature of this study, researchers preferred to use figures showing trends in variation of parameters (line showing the variation of parameters) during treatment process what allowed them to assess the effectiveness of PUR in water treatment.
Results
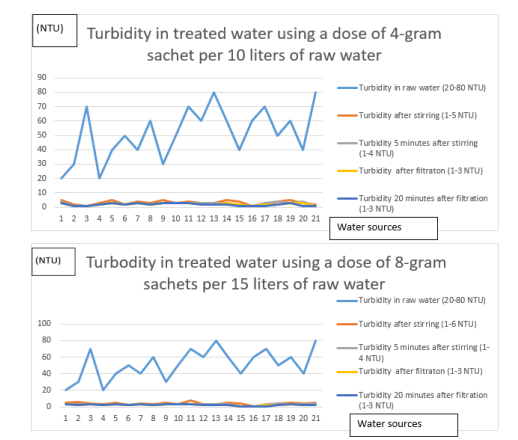
Figure 2: The Variation of Turbidity in PUR Water Treatment Process
As it is shown on Fig.2, important changes in turbidity values oc-cur in the first stage of water treatment and this especially occur in highly turbid water.
In the last three stages of treatment, there is a little change in tur-bidity levels and 100% of all samples have turbidity less than 5 NTU at the last stage of treatment.
At the beginning of the treatment, 100% of samples (raw water) had turbidity above the standard 5NTU. After filtration there was almost no change on turbidity and 20 minutes after filtration. There was statistically significant reduction of turbidity for turbid¬ity in treated water after stirring (p<0.02) for both dose 1 sachet (4-gram sachet) and dose 2 sachets (8-gram sachet). The turbidity in water is associated with organic matter load.

Figure 3: The Variation of Ammonia (mg/l) in PUR Water Treatment Process
As it is shown on Fig.3, tremendous changes in ammonia content in water occur in the first stage of water treatment. This is shown by lines representing other stages which have now merged apparently in one line for most of samples when a dose of 1 sachet ((4-gram sachet) is used. The removal of ammonia in treated water seems to move slowly when a dose of 2 sachets (8-gram sachet) where lines showing variations in changes tend to coincide. 85.7% (n=18/21) of samples before treatment were above 0.5mg/l and decreased around 0.2mg/l for a dose of 1 sachet. A strong correlation and no correlation in variation of ammonia in water sources were observed for a bivariate correlation of ammonia in raw water and Ammonia in treated water 20 minutes after filtration (r=0.626 for a dose of 1 sachet (4-gram sachet) of PUR and r=0.000 when a dose of 2 sachets (8-gram sachet) is used, respectively). Ammonia in raw water playing a critical role in DBP formation when chlorine (powder of PUR) is added to raw water before it gets removed from water. Organic matters which are then indicated by the presence of ammonia in water are precursors of DBPs formation. To prevent DBPs formation, it is important to pass raw water in the processes which remove organic matters before adding a powder of PUR. This study revealed that 85.7% (n=18/21) of the sampled water sources contain the level of ammonia (> 0.5mg/l) which is associated with DBPs formation when PUR is added before ammonia is removed. No significant reduction of ammonia was observed (p<0.15 for the dose of 1 sachet and p<0.108 for the dose of 2 sachets). It was, therefore, found that DBPs are likely to occur in water treatment using PUR based on the level of ammonia, the precursor, in water.
Discussion
The study found that important changes in turbidity values occurred in the first stage of water treatment and this especially occurs in highly turbid water. Changes were so important after stirring where almost all samples (85.7%) had values below 5NTU for sample treated using 2 sachets (8-gram sachet) of PUR and 100% had values below 5NTU for sample treated using 1 sachet (4-gram sachet) of PUR. A statistically significant reduction of turbidity for turbidity in treated water after stirring (p<0.02) was observed for both dose 1 sachet and dose 2 sachets. High turbid sample decreased more noticeably than low turbid water samples. 42.8% of samples treated using 2 sachets changed the turbidity value and 33.3% of samples treated using 1 sachet changed the turbidity value in 5 minutes after stirring. 33.4% of samples treated using 2 sachets changed the turbidity value and 28.5% of samples treated using 1 sachet changed the turbidity value after filtration. Only 4.8% of samples treated using 2 sachets changed the turbidity value and 14.3% of samples treated using 1 sachet changed the turbidity value in 20 minutes after filtration. The findings were similar to the results of the study conducted in western Kenya which demonstrated that for source waters over a range of turbidities, PUR product effectively reduces turbidity to <5 NTU [12].
No significant reduction of ammonia was observed (p<0.15 for the dose of 1 sachet and p<0.108 for the dose of 2 sachets). This means that the use of low dosage of chlorine may lead to inefficient disinfection and the use of high dosage of chlorine may results in high concentrations of DBPs and the formation of DBPs known as HANs is observed in chlorinated water organic material. Another important fact is that in post-chlorinated water, the concentration of formed THMs and HAAs is much lower than in pre-chlorinated water [13].
Free chlorine readily reacts with ammonia and other ammoniated compounds to form what are known as chloramines. These chloramines are known as monochloramine, dichloramine and trichloramine. Chloramines are also referred to, in industry, as combined chlorine. When chlorine is added to water containing ammonia (NH3), chlorine will replace one hydrogen ion on ammonia molecule with a chloride ion resulting in formation of monochloramine:
HOCl + NH3 NH2Cl (Monochloramine) + H2O [14]. If ammonia is present and the demand has been satisfied, some of free chlorine will react with ammonia to form chloramines or combined chlorine residual. As more chlorine is added, it will convert chloramines that have been formed from monochloramine to trichloramine. To explore the possibility of DBPs formation in samples, three clues were consider
 The level of ammonia where in raw water, 85.7% (n=18/21) of samples before treatment were above 0.5mg/l. Ammonia is known as the precursors of DBPs in chlorinated water and Water containing ammonia less than 0.5mg/l before chlorination is not a major source of exposure to DBPs [15].
The results of this study showed that the pH values varied between 6.5 and 8.5, the range in which DBPs are favored to form in chlorinated water. In that range chlorine is dissociated in HOCl and OCl- where HOCl is dominant in the solution and it reacts with organic matter to produce DBPs [16].
Measurement of the association between ammonia and residual chlorine. The clues allowed the researcher to conclude that there was possibility of DBPs formation in the samples of water taken. Studies suggest that humans exposed to unusually large amounts (> 80 μg/l) of some DBPs could experience liver damage and decreased nervous system activity. Many studies showed increased bladder cancer, stillbirths, miscarriages and serious birth defects [8]. In water treatment process using PUR, chlorine (PUR) is added in raw water without the step of removing any organic matter which are the major precursor of DBPs.
This study assessed the feasibility of removing organic matter in raw water before adding PUR. The step of removing organic matter using either retention of raw water and the use of coal-based carbon in raw water before using PUR was found effective.
Conclusion
The study found the possibility of DBPs formation resulting from the use of PUR in water treatment basing on the level of ammonia in water. DBPs formation are likely to occur for all two doses tested but it is more likely to occur when a dose of 8-gram sachets of PUR (2 sachets) per 15 liters of raw water is used. 57.1% (n=12/21) of samples treated using 2 sachets of PUR failed to reduce ammonia to the recommended less than 0.5mg/l which is not a source of exposure to DBPs health risks. 85.7% (n=18/21) of raw water from all water sources had the level of ammonia greater or equal to 0.5mg/l which mean that they have precursors of DBPs formation when treated using chlorine compounds. To eliminate DBPs, the study suggested two ways to adopt in order to remove DBPs precursors: retention of raw water to allow organic matter to settle and filtrate before adding PUR, and to pass raw water in coal-based carbon to trap organic matter before adding PUR. The use of one among the two suggested methods to organic matter in raw water is effective to prevent the occurrence of DBPs during water treatment.
References
- Zasouli, A. M. & Kalankesh. (2017). Removal of Presucrsors and Disinfectant By-Product (DPBs) by Membrane Filtration from Water; a review. J. Envron Health Sci Eng, 15(25): Published on Line.
- White, G. (1978). Current chlorination and dechlorination practices in the treatment of potable. In R. e. In: Jolley, Water chlorination: environmental impact and health effects. Vol. 1 (pp. 1-18). Ann Arbor, MI: Ann Arbor Science.
- Clasen, T. F., & Bastable, A. (2003). Faecal contamination of drinking water during collection and household storage: the need to extend protection to the point of use. Journal of water and health, 1(3), 109-115.
- Lantagne, D. S., Blount, B. C., Cardinali, F., & Quick, R. (2008). Disinfection by-product formation and mitigation strategies in point-of-use chlorination of turbid and non-turbid waters in western Kenya. Journal of Water and Health, 6(1), 67-82.
- Lantagne, D. S., Cardinali, F., & Blount, B. C. (2010). Disinfection by-product formation and mitigation strategies in point-of-use chlorination with sodium dichloroisocyanurate in Tanzania. The American Journal of Tropical Medicine and Hygiene, 83(1), 135.
- Cavallaro, E. C., Harris, J. R., Da Goia, M. S., dos SantosBarrado, J. C., Da Nobrega, A. A., de Alvarenga Junior, I. C., ... & Mintz, E. (2011). Evaluation of pot-chlorination of wells during a cholera outbreak, Bissau, Guinea-Bissau, 2008. Journal of water and health, 9(2), 394-402.
- Agency for Toxic Substances & Disease Registry. (1989). Toxicological Profile for N-Nitrosodimethylamine,' Prepared by the Syracuse Research Corporation for ATSDR in collaboration with the U.S. Environmental Protection Agency. Washington, D.C.: U.S: Public Health Service pp.119.
- Li, X. F., & Mitch, W. A. (2018). Drinking water disinfection byproducts (DBPs) and human health effects: multidisciplinary challenges and opportunities. Environmental Science & Technology, 52(4), 1681-1689.
- Kelly, A. & Reynolds, M. . (2012). Novel Study Improves Toxicity Analysis of Disinfection By products in Drinking Water. Journal of Hygiene and Tropical Medicine, 321-327.
- Cantor, K. P., Villanueva, C. M., Silverman, D. T., Figueroa,J. D., Real, F. X., Garcia-Closas, M., ... & Kogevinas, M. (2010). Polymorphisms in GSTT1, GSTZ1, and CYP2E1, disinfection by-products, and risk of bladder cancer in Spain. Environmental health perspectives, 118(11), 1545-1550.
- Ghernaout, D., & Elboughdiri, N. (2020). Disinfection By-Products Regulation: Zero ng/L Target. Open Access Library Journal, 7(5), 1-9.
- Crump, J. A., Okoth, G. O., Slutsker, L., Ogaja, D. O., Keswick, B. H., & Luby, S. P. (2004). Effect of point-of-use disinfection, flocculation and combined flocculation–disinfection on drinking water quality in western Kenya. Journal of Applied Microbiology, 97(1), 225-231.
- Collins, A. & Steelink, T. . (2017). Guidelines for Canadian drinking water quality, 6th edition; Hach water analysis hand Book, 3rd edition. Ottawa, health Canada: Quebec University, School of Public Health.
- Preston, K., Lantagne, D., Kotlarz, N., & Jellison, K. (2010). Turbidity and chlorine demand reduction using alum and moringa flocculation before household chlorination in developing countries. Journal of water and health, 8(1), 60-70.
- Valentine, R., Choi, J., & Chen, Z. (2006). Factors affecting the formation of NDMA in water and occurrence. AWWA Research Foundation.
- Black & Veatch Corporation. (2011). White's handbook of chlorination and alternative disinfectants. John Wiley & Sons.