

Journal of Applied Engineering Education(JAEE)
ISSN: 3066-3679 | DOI: 10.33140/JAEE


Research Article - (2026) Volume 3, Issue 2
Discourse on Middle Eastern Refugee Waves and War, Mainly in 2015, through "Greek" Tweets. The Semi-Fuzzy and Semi-Automated temporaLDA and TransGIS-LDA-SVM Approaches

2Researcher @ a little map laboratory, Greece
Received Date: Jul 29, 2026 / Accepted Date: Aug 24, 2026 / Published Date: Sep 07, 2026
Copyright: ©2026 Stathis G. Arapostathis. This is an open-access article distributed under the terms of the Creative Commons Attribution License, which permits unrestricted use, distribution, and reproduction in any medium, provided the original author and source are credited.
Citation: Arapostathis, S. G. (2026). Discourse on Middle Eastern Refugee Waves and War, Mainly in 2015, through "Greek" Tweets. The Semi-Fuzzy and Semi-Automated temporaLDA and TransGIS-LDA-SVM Approaches. J of App Eng Education, 3(2), 01-24.
Abstract
Current article is an extended version of a paper presented at the ITDRR-2023 conference on the spatiotemporal archiving of Greek tweets regarding the 2015 Middle Eastern refugee waves and related war conflicts. The paper further explores the spatial factor. Specifically, a semi-fuzzy approach based on Machine Learning and GIS is introduced. Location Entity Recognition (LER) using a transformer, geocoding, extensive GIS processing for geolocation extraction, Latent Dirichlet Allocation (LDA) models, and Support Vector Machine (SVM) classification were combined, creating an innovative methodology. Both the temporal aspect (Phase 1) and the spatial aspect (Phase 2) were examined through subsets generated from locations refered to specific countries. In total, 1,780 topics (Phase 1, temporal factor) and 1,131 topics (Phase 2, spatial factor) were generated from temporal and spatial subsets of a corpus comprising approximately 1.4 million Greek tweets.
Through GIS processing, 99.7% of approximately one million geolocations were validated or revised, resulting in a unique geodatabase containing the locations referred to the majority of Greek tweets discussing the Middle Eastern refugee waves and related war conflicts, primarily those of 2015.
GIS processing also provided location frequencies and subsets of tweets referring to each location. The importance of the spatial factor emerged from the unequal distribution of location references across the discussions in terms of both topic diversity and frequency. These distributions are presented in thematic maps, while the proportions of the two main classes, refugees and war, are presented for 15 countries, including Greece, Syria, Turkey, Iraq, North Macedonia, Jordan, Israel (including Palestine), Russia, and the USA.
The current research can be regarded as a highly innovative interdisciplinary approach, also considering the significance of the geographical area, as Greece was the main entry point for Middle Eastern refugees during that period. The proposed methodology successfully combines machine learning, other state-of-the-art methods, GIS techniques, and human expert assessment, resulting to the effective semi-fuzzy processing of more than one million social media posts concerning a topic of considerable social and geopolitical significance.
Keywords
Social Media, Topic Modeling, Location Entity Recognition, SVM, Refugees, War Conflicts, Middle East, GIS
Introduction
Social media have been emerged during the latest years as significant in a plethora of fields, including those of refugees, and wars (Section 1.1). There is plethora of research covering a wide range of different aspects of the field. They are utilized either as a mean of communication, that can alter the world for e.g. analyzing virals in various crises in various qualitative and quantitative approaches [1]. (See Section 1.1.1), In order cases they are simply treated as sources of information. Notions regarding the latter include the notion of Volunteered Geographic Information (VGI) and Citizen Journalism [2,3].
VGI is the production of geographic information, from citizens that do not necessarily have a related educational background. Social media posts containing geoinfo are considered as VGI.Similarly Citizen journalism’s definition could be accusative to VGI, as info posted or treated from citizens who do not necessarily have any related educational background, info that is conventionally utilized by journalists. Thus, the internet users who produce information, as social media users, can be identified as “human sensors”, as per VGI theory [4,5]. The most appropriate web spots for seeking that info is social media, in which the “neo-journalists”, accusative to the “neo-geographers” do not provide that info intentionally for that purpose though [6].
Citizen journalism is also promoted by the conventional media, for various reasons including their cost-effective nature of the produced data [7]. In some cases, citizen journalism provides insights that could never be revealed otherwise: i.e. Arabic Spring, Israel-Palestine debades, war conflicts etc.
One of the most significant characteristics of the referred notions is the extremely high rhythm of produced information which, in many cases, permits researchers to receive information regarding a variety of scientific topics, rapidly. The information is delivered in various forms (i.e. texts, photos, videos, URLs), by billions of users in several social media platforms. That massive volume led the scientific community to develop new and explore and adjust existing methods and techniques, for filtering and extracting information. Applications of machine learning (including deep learning) have been emerging since the latest years.
An important group of machine learning approaches suitable for discovering information from big data, is topic modeling or event detection [8,9]. Those methods provide an overview of the main info included in datasets. These important methods confront with the general challenge of researchers to have an overview of what are the main topics in thousands sets of documents, without having the time to read every single one of them.
Another important group of methods, are the Named Entity Recognition (NER) ones. NER methods are widely used in a variety of disciplines [10]. During the latest years, various methods have been developed in order to perform NER effectively. It is about identifying specific entities in texts. List based geoparsing is an accusative set of methods and techniques and has been proven very credible and effective in many cases. A significant limitation that need to be considered nowadays is that the list-dependent nature of the methods makes them weak to identify names that cannot be predicted in order to be added in the lists. When dealing with texts referring to plethora of geographic areas globally and the geonames can be spelled according to other language or idiomas, then list based geoparsing methods probably suffer from false positives. Large Language models (LLMs) have been emerged as a vital part of NER in texts, as they consider among other, the nearby words in order to detect the presence of a named entity.
Indicative Work
Social Media and Refugee-Related Events, Warfare not Limited to Quantitative Methods
In the international literature there is a lot of research regarding refugees and using social media as the latter are widely used from people who are moving from one place to another for various reasons including wars or migration in general [1]. Indicatively, indicated that refugees were constantly using social media as a “low budget” and “easy” way of keeping contact with their relatives and friends during the 2015, 2016 refugee waves [11]. The use of social media though was wider. Focused on further exploring that part [12]. Surveys were distributed to hotpots located in Greece, Italy, Turkey, Jordan and Iran. The findings of the research included that the vast majority used social media for seeking for destination in Europe. Moreover, the vast majority of refugees or asylum related migrants used social networks despite their level of trust to people that were trying to help them, even there was a statistical significance that justified that those who did not trust, used social media slightly more. Moreover, even it was not statistically justified that social media facilitate their mobility decisions, there was a quite high percentage of people confirming that social media were essential for that specific objective. Similarly, in the effective use of Facebook is exploited through the distribution of related questionnaires, while in the author explored, among other ICT, the usage of social media from Somalian refugees in France, through the distribution of questionnaires by using a multi-site ethnographical approach [1,13]. Among the findings presented in the paper is that Social Media can be used for mobility, for cultural preservance and maintenance, and for a bunch of other reasons, including marriage with Somalian girls with European citizenship.
In the authors analyzed how the Syrian refugee crisis was unfolding in Twitter [14]. They measured the activeness of the event by selecting seven different indicators: tweet count, retweet count, follower count or original tweeters, sentiment both positive and negative, user change and sparseness of community. They applied an extensive set of statistical methods, to english and german tweets classified in two different groups: Refugee and Syrian. The indicators were validated through the two different measurements: principal component analysis (PCA) which combined all the indicators and through measuring their internal consistency.
Regarding sentiment extraction, in a research is presented regarding the sentiment in X (during that period the official name was Twitter) regarding refugee incidents during 2015 [15]. The spatiotemporal analysis identified among other, various important events of the crisis and sentiment tracking per country through time. Among the results, it could be clearly identified that there was a differentiation of the general sentiment across countries and in different time periods, while in Greece despite of being the No. 1 reaching point, and the financial problems that the country was facing during that period, there was a very positive sentiment towards the refugees.
Regarding virals and not only limited to them, in there was a focus on specific photos posted in social media [16]. Alan Kurdi was three years old in 2015, when he was found drowned at a beach. His photos were posted in social media and were spread in the conventional media, newspapers globally. Omran Daqneesh in 2016, was five years old, when he was captured full of dust and blood in the back of an ambulance. The photos became virals, and they were also front-pages in well known newspapers globally. The case of Alan Kurdi was characterized with a lot of compassion and caused immediate solidarity actions at a global level emerging thus the involvement of social media as an influential factor that affects attitudes and political decisions. While the influence tends to increase, support towards the refugees, the overexposure of the problems in social media might bring the opposite result. That is called compassion fatigue. Researchers in presented the general concept of the compassion fatigue as a result of media hypes in social media [7]. The focus of the research was on Syrian refugees located in Turkey and Jordan and in specific on how do those cope with the compassion fatigue and in general what is the effect of social media in their lives. The analysis was based on two group discussion participants.
Regarding various other topics, in the involvement of the tourists to the matter, emphasized, as those, during the 2015-2016 incidents, had been sharing info through social media when the European media actually started to focus on the refugee matters [17].
In research focused on the influence of specific labels used in social media that describe the “refugee crisis” [18,19]. Emphasized on various wrongly placed labels during 2015-2016 [19]. Some of those included the “European migration crisis” or “European refugee crisis”. They emphasized on the negative attitude that some of those labels had, and through the use of them people in the host countries and general might perceive them in a less friendly way. They also researched on patterns of different labels used, the sentiment linked to them, the level of influence of the sentiment considering agency, economic cost, permanence and threat of criminality, and ways of those labels are used within the online discussions. The sentiment extraction was based on thousands of comments posted in specific YouTube videos which are related to refugee incidents. Their approach also included the estimation of sentiment, intensity, and involved the use of regression models and LDA topic modeling. Among their findings is that all the labels examined from the thematic YouTube videos were found to have negative sentiment and that the threat factor was the most influential followed by agency (migrant or immigrant), permanence and cost. In research focused on the effectiveness of detecting hate speech in social media, focusing on refugee related data [20]. They created a hate speech corpus in German language by collecting tweets using specific hashtags that can be characterized as offensive and assessed them manually. They also distributed online questionnaires regarding the comprehension of hate-related content.
Solidarity expressed through social media was researched in, regarding Ukrainian refugees, in comparison to the solidarity that was demonstrated on the Syrian refugees during the big refugee waves of 2015 [21]. They collected about 2.3M tweets from twitter from 2015 up to 2022 in English and German language. The English tweets had a European location. They classified the dataset in three categories: I. Solidarity, II. Anti-solidarity, III. Other. They interpreted the results considering various incidents occurred in reality (i.e. political statements, violent incidents etc).
Research in analyzed the public discourse in social media regarding refugees, in Netherlands [22]. The authors use both qualitative and quantitative approaches, while in they paid attention to the structure of anti-refugee waves formed by a various interacting actors. Regarding Netherlands, in various qualitative aspects of the Syrian refugees who live in the country were tracked, with a focus on Social Media usage [23]. The latter is emerged as essential means of communication that can provide significant aid in a variety of challenges that refugees face.
Finally, various other aspects were researched in various papers. Indicatively, those include the digital discourse of gay refugees in Belgium or studying the behaviors and general characteristics of refugees and natives on social media [24,25]. The latter also considered privacy related issues which are often raised through the use and analysis of social media data. Further studies focus on specific actors of social media: indicatively, researched on the effects of NGO posts through Social Media while those are aspiring to “advocate” the refugees [26].
The use of social media on war conflicts is also receiving attention in the international literature. Indicatively, presented a descriptive overview of various war conflicts and debades, discussed through social media, regarding Israel and Palestine [3]. Among other, they refer to various limitations that are often applied from the governments to conventional media emerging thus social media as a valuable source of information. Moreover the article addresses various aspects, including that the people of Palestine were able to express their own thoughts and points of view raising thus awareness that would not be revealed otherwise and that sometimes there is some kind of “unofficial competition” about which side will be able to influence more people. Author in described a landscape of emerging Palestinian-Arab violence within Israel, as a result among other of the country’s social structure and general neglect, while focused on how that landscape is reflected and also influenced by Tik-Tok and Instagram posts, by analyzing specific video posts [27].
It is also worth mentioning the NATO report of the “NATO communications excellence” [28]. The report highlighted the use of social media during warfare for a variety of reasons, including among other, attempts to influence beliefs and attitudes, to mobilize for action and for other coordinative actions.
Topic Modeling
Topic modeling is a very effective approach applied in a variety of scientific topics and it is considered as extremely useful, especially when confronting with high volume of text information that is not possible or time effective to read it [29]. In terms of social media texts, the high volume of information is considered as a common characteristic of the thematic datasets. Therefore topic modeling is widely used.
Some of the methods available in the international literature include the non-negative matrix factorization (NMF), the top2vec and the Bertopic, while the most commonly used is the Latent Dirichlet Allocation (LDA) [30,31]. LDA is considered an evolution of the pLSA which was sequentially considered as an evolution of LSA. it is a statistical approach while the remaining are using embeddings. Authors in presented a comparison of LDA, NMF, Top2Vec and Bertopic [30]. Their assessment was based on a 50k tweet dataset, containing the hashtags: #covid, #travel or #covidtravel, in order to assess the strengths and weaknesses of each technique.
In an innovative approach was presented, based on LSA topic modeling and BERT for further embedding of the LSA data extraction [32]. They compared their approach with LDA and concluded that their approach performed better in a news dataset available on Kaggle. Applied topic modeling on Moroccan tweets [33]. The authors assessed the performance of LDA and NMF, concluding that LDA achieved higher coherence and had more meaningful topics.
Presented a framework for automatically annotating tweets [34]. As it is mentioned, it can be used for training deep learning models. The approach was based on extracting topics through LDA and through a novel TF-IDF algorithm it was possible to extract the dominant topic of each tweet. Upon feature extraction, using BERT embeddings they were also able to train various deep leaning models including CNN, ANN and LSTM. The general performance of their approach was significant and better than other presented approaches. The dataset used for applying and evaluating the approach were disaster and covid19 related tweets.
Highlighted, as one of the disadvantages of both NMF and Bertopic, the absence of any topic distribution within a single document [30]. That means that each document (in current case each tweet) is assigned to only one topic. Considering the political nature of the data, that sounds the main disadvantage for using embedding topic models for current research. It was also stated that on Top2Vec and BertTopic cannot generate topic distributions (even though probabilities can be extracted as in pp. 12) of each document, while NMF frequently delivers incoherent topics. The latter though is characterized as more suitable [30,35]. Other research though, finds LDA better [29,34].
Proposed a method for aggregating similar topics and generating new ones, increasing thus their coherence [36]. Moreover, in an approach was presented that was making use of LDA on various datasets including social media data [37]. The approach also included NER techniques while the results were clustered in R environment.
Reviewed existing research, regarding LDA and presented a simulation of LDA topic modeling, while they highlighted key points for effective parametrization [35]. The simulation was based on harvesting hundreds thousands of web pages regarding food safety. Their experimentation was evaluated by estimating four metrics: Rank-1, Coherence, Relevance and the Hirschman-Herfindahl Index (HHI) as a concentration measure.
In addition, the effectiveness of NMF and LSA was assessed in [38]. The assessment was based on a news dataset acquired from kaggle (source:https://www.kaggle.com/datasets/therohk/million-headlines). LSA was able to perform better in that dataset. Even currently the assessment of the various topic modeling algorithms is out of the topic of current article, future steps of current research could include a comparison of various topic modeling methods in related datasets.
Finally, Topic modeling has been emerged as a useful approach, for scientific review purposes as well. Used LDA for literature review on return migration studies, analyzing thus more than 3,000 related studies, indexed in Scopus, emerging thus the plethora of related research of that specific topic [39].
Geolocation
The extraction of geographic information from social media texts is an important component of the international research. That information might be related to geotweets, or geoposts in general or the widely known “check-ins” usually posted to a city or a specific place. Another way of extracting geolocations is by detecting them within the descriptive texts of each social media post (geoparsing). Similar and not identical term to geoparsing is location entity recognition (LER) as a sub-section of NER. According to the focus, there is published research focusing on both types of geographic information [40,41].
The first referred set of geoinformation is characterized of limited availability as a small percentage of the total volume of social media posts has that type of information. Especially in twitter the range varies from less than 1% to 4-5%, sometimes up to 7.9% [42,43]. The second referred set provides a really bigger volume of information. Descriptive geolocations though are not often too precise, at least comparing i.e. to geotweets which include x y coordinates of the area that the tweet was posted. The conventional geoparsing procedures are mostly list-based, while during the latest years language models are improving the general process. Language models suitable for those processes are widely referred as Transformers, as they have that type of decoder architecture, or machine learning models based on attentions mechanisms [44].
Especially regarding the latter, Bert language models were introduced by google in 2018. Their significant comparative advantage for extracting Named Entities (NER) in general is that they consider the previous and sequential words in order to assess and classify further. Initially the BERT models used for NER of geolocations were of medium performance. During the time period in which the research was initiated the latest versions were starting to perform better than the initial literature findings. Evolutions of BERT expanded the language model in 118 languages providing ability to apply NER in various languages.
In NER for detecting geolocations was applied in Spanish tweets [44]. A Spanish Bert model based on BETO was fine-tuned with impressive performance metrics, accuracy: 98.6%, precision: 93.7%, F1: 93.9%. Similarly, in NER using Bert was applied, for identifying geolocations in tweets regarding transportation disasters [43]. An AdamW optimizer was also used, achieving thus accurate results (acc: 82%) than the original BERT (81%). Presented research linked to extracting crisis information and geolocation using BERT transformer model and hugging-face transformer toolkit [45]. The approach was applied in six different datasets of english tweets, covering various disastrous events including the 2014 war events in Pakistan, Israel and Palestine. The processed output led to the development of related maps. The accuracy results regarding location extraction varied from 83% up to 94.1% for each disastrous event. Other interesting related research aspires to predict the geolocation of the users, including the research in which the authors applied Bi-LSTM and CNN based approach on geolocated tweets, harvested through twitter API, for predicting the users’ geolocation confronting thus with the limited geolocation problem [42].
Contribution of Current Research
Current research article is an extended version of research work that was presented during the ITDRR 2023 conference [46]. The approach analyzed big data, Greek tweet texts, and extracted information regarding the refugee waves and war conflicts of 2015-early 2016. The approach utilized machine learning, like topic modeling and NER of locations using large language models, geocoding services and GIS in a dataset consisted of 1.4M thematic tweets. Manual classification and validation along with the automated methods and techniques was a mandatory due to the complication of the topic and the actual explorative needs of the research. The research therefore is characterized as semi-fuzzy and semi-automated.
Respecting other published research, the topics and the corresponding n-grams were extracted on temporal and spatial subsets, emerging thus spatiotemporal findings. The extracted topics and ngrams of the temporal approach were reflected into a more coherent schema considering among other, their topic distribution value (1): Wi=d(φi) ∑n 1 d (φi) (1) Where W is the weight, φ is the n-gram, d(φ) is the topic distribution’s value of the ith n-gram, and n = 10.
The manual classification of the temporal topics was a vital procedure that could not be replaced by automation, due to the demanding exploration that would not lead to a predefined schema, and to interdisciplinary reasons. After all, LDA topics, are not always formed according a human logic and they cannot be reflected in prior according to what a researcher needs. So, in international literature, there is plenty of discussion for effective topic classification and interpretation [47].
Regarding the location dimension of the paper, in current extended version an innovative TransGIS-LDA-SVM approach validated the geolocations, and strengthened the topic extraction in spatial subsets, generating thus topics per country. Moreover, due to the completion of phase I, Machine Learning was used for classifying 1131 topics, using an SVM classifier and a much simplified classification schema. That part was also supported by manual classification, and validation in order to increase accuracy to almost 100% for the applied needs of the research.
The next sections of the manuscript present related research to: 1. Social Media and refugee-ness, war conflicts (section 2.1), 2. regarding topic modeling (section 2.2), 3. regarding geocoding (section 2.3). Section 3 presents Data and Material Used along with the author’s approach, while Section 4 the results and discussion. The last section, (section 5) presents the Conclusion.
In general, current approach, is an extremely innovative approach, the latter of which should be only assessed by recognizing the interdisciplinary character of the research. Current research, efficiently combines multiple research topics, Machine Learning algorithms, GIS, Social Media data for extracting information, and for performing assessments in a vital topic like the Middle-Easterns refugee waves of 2015. Greece during that time had a significant geopolitical role, as the country was the main EU entrance point.
Data Material and Methodology
Data and Material Used
As mentioned in introduction, a dataset consisted of 1,480,208 tweets, written mainly in Greek, was used for the analysis. The tweets were collected through the use of the Twitter API v2.0. During that period the popular social media platform was still called twitter and not X as it is called since July 2023. The authors were granted a related academic license. The library used for collecting the tweets was the “AcademicTwitter” in R programming language [48]. The time-frame was defined from 2015-01-01 00:00:01 GMT up to 2016-04-30 23:59:59 GMT. That time period includes the first signs of the refugee waves up to few weeks after the March 2016 agreement among the UN, EU and Turkey, while it covers various war incidents in Middle East and Africa. It is worth mentioning that during that period the length of each tweet was limited to 140 characters only. Various keywords were used including among other various forms of the words refugee and war in Greek, along with various countries that were in war or in civil war in the areas of Middle East and Africa. That included Syria, Iraq, Somalia, Erithraia etc. Current version of the dataset did not include tweets as a result of specific queries regarding Libya, Africa. However, it is expected that partial information is included through the use of general keywords.
The authors used various libraries in R and Python programming languages, for collecting and analyzing the dataset. The libraries used included: “academic-twitter”, “textminerR”, “qdapRegex”, “stringi”, “stringr”, “lubridate”, “RtextTools” for machine learning in R and “pandas”, “numpy”, “csv” and “gr-nlp-toolkit” in python.
The open source software qGIS was widely used for GIS processing. Libre Office Calc was used for either checks and spreadsheet-based editing of the geolocations. GGplot R library were used for GIS analysis and processing evaluation procedures and for graph and map creation. Every aspect of current research is GenAI free: From references, writing, up to methodology, results, mapping and R/Python scripting.
Methodology
The methodology is consisted of two phases. The first phase (temporal phase) focused on classifying the topics’ n-grams, which were extracted from subsets of equal time interval, on a classification schema that was dynamically developing according to the findings of the classification. That demanding procedure aspired to reflect as precise as possible the extracted topics and n-grams in war and refugee classes (Figure 1). The second phase (spatial phase) focused on location, as already mentioned. An approach based on combined Machine Learning methods, GIS and manual validations is presented, providing interesting insights with geographic variations. In this phase, the topic classification schema was simplified, in comparison to the complicated one of the first phase, in order to be more automatically processed. Topics were extracted per country, and classified through a SVM classifier and manual validations. The following subsections 3.2.2 and 3.2.3 describe in detail each one of the phases of the methodology. A subsection prior to those, 3.2.1 describes initial common, for both phases, steps.
Initial Steps
Regarding tweet collection, as already mentioned the twitter API v2.0 (year 2022). The author was granted an academic license during that time. Various related keywords were used (e.g. refugees, migrants, Syria, middle East, in Greek and various grammatical forms), in different queries. The selected time period was from 1st of January 2015 up to 30th of April 2016. For each query, a corresponding data-frame was generated, in R environment. Then all the data-frames were binded into one and validations were ran in order to ensure that all duplicates have been eliminated, based on the generation of an id, consisted of various fields of each row. The uniquely identified tweets were finally exported in a .csv file.
Phase 1: Focusing on Temporal Aspect and to Precise Classification of the Extracted Topics and n-grams
The next step of phase I was to create data subsets of tweets posted in time intervals of equal length. A weekly time period was set as interval. In current phase 52 weekly intervals were defined for 2015. Week 52 of 2015 had one more day, the 31st of December. The year 2016 was divided in 18 weekly intervals, while the last interval was of very few days.
After dividing temporally, the next step was related to topic extraction. The well known Latent Dirichlet Allocation (LDA) was used. The development of LDA included data preparation procedures related to NLP. In specific, a list of stop words was defined. The stop words were words met in high frequency but with no essential meaning for the topic modeling. Internet search initiated the stop-word list. That list upon experimentation was enriched with various other words that appeared in LDA results and also had reduced to almost zero meaning. Moreover, the text corpus was converted to lowercase and punctuation was removed along with the URLs. Various additional parameters were assessed. Regarding NLP, the experiments involved I. Word stemming, ii. Word lemmatization, iii. Removal of numbers. As the usefulness of those NLP procedures, is theme-dependent, there was some experimentation. Experiments also researched on the n-gram range the k value and the number of iterations (section 4.1).
Sequentially, the approach focused on the extraction of the topics, along with the corresponding n-grams, for each LDA model and their aggregation into a data-frame. That data-frame was used for reflecting the extracted info to a classification schema consisted of subclasses classes regarding I. “Refugee-ness” and II. “War”. A third category accumulated all the not related to war or refugees content. Special commenting regarding the interpretation is provided in the Results and Discussion section.
The reflection of the classification schema included the use of the normalized distribution of the most frequent 2-3grams to topics as weights. Regarding the schema, tables 1, 2 present the basic description of the classes.
|
Class |
Description |
|
Refugee movement and accommodation |
Refugee arrival, movement, accommodation including hotpots. |
|
Solidarity to refugees |
Collection of food, clothes, every specific act of solidarity. |
|
Human loss / life in danger |
Human losses and injuries or people missing including potential shipwrecks or other events related to human loss. |
|
Politics and Management |
Announcements, statements of politicians or other official entities including religion. Actions for confronting managing with crisis including arrests of smug-dealers. Description of status or of a situation linked to tracking not included in other classes, info regarding amount of refugees or sentiment related topics like polls. |
|
Celebrity Visits |
Presence of celebrities to areas affected by refugees. Politicians and journalists are excluded. |
|
Negative event |
Violent protesting regarding the hospitality or violence against refugees or refugees against refugees or bad conditions of accommodation or protesting regarding ineffective management or bad incidents. |
|
Opinions, worries and scenarios |
Worries regarding danger, scenarios, or opinions or comments that cannot be classified as against or support, including irony. |
|
Support to refugees |
General messages of solidarity, protesting for supporting refugees, compassion messages, peaceful symbolic actions or messages which support refugees against negative actions or recommendations to people to help or support to people who support and help refugees. |
|
Against refugees |
General messages or Opinions against refugees and/or against the lives of the refugees or irony. |
|
Saved Lives |
Saved lives or Missing people found. |
|
Positive event |
Solidarity or supporting actions from the refugees which prove the value of human life including refugee births, refugee success stories or symbolic actions of refugees to locals. |
|
Other/General |
Everything not defined in previous cats. |
Table 1: Conceptual Schema of Refugee-Related Classes [46]
|
Class |
Description |
|
Politics |
War politics, statements or actions that prepare, coordinate war, elections or defining new leaders etc or pausing battles for negotiations. |
|
Actions |
War bombing, war attacks, terrorist attacks or other battles / actions air conflicts or surrender actions or citizens evacuation or forced evacuation. |
|
Destroyed premises |
War destroyed premises or equipment. |
|
Human Loss / Danger |
War human losses and injuries or missing or war crimes regarding living or hostages. |
|
Saved lives |
War saved lives or missing people found or hostages being let free. |
|
Opinions, worries and scenarios |
War Worries or war scenarios or war danger or war opinions or war comments. |
|
Against war |
Against war. |
|
Support to Syrians |
Support messages to Syrians and/or Syria regarding war or terrorist victims. |
|
Humanitarian Aid |
War humanitarian aid. |
|
Tracking |
war tracking: war identification, war status, numbers or info regarding the war other than human losses, equipment, war related actions and status description that are not bombing, attacks or battles or terrorist attacks. |
|
Other |
general other info not related to the defined cats including war opinions. |
Table 2: Conceptual Schema of War-Related Classes [46]

Figure 1: Phase 1: Topic Extraction and Reflection to Classification Schema [46]
Phase 2: Focusing on Location: The TransGIS-LDA-SVM Approach As mentioned, the spatial phase of the methodology is a TransGIS-LDA-SVM approach
As mentioned, the spatial phase of the methodology is a TransGIS-LDA-SVM approach (Figure 2). In current section the components are separately described.
LER, Geocoding and GIS processing
The first step was related to extracting the locations from the tweet texts. The GR-NLP-Toolkit was used for extracting locations, referred in tweet texts [49]. A python script was developed for that purpose. All of the corresponding tags for each tweet text (row) that were identified by the model, were binded in a new column of the data-frame. Sequentially that dataframe was further processed in R, and only the location-related identified entities were kept. Then according to the number of identified locations, each row was replicated N times, where N was the number of geolocations.
Sequentially the HERE geocoding API was employed in order to add lat lon coordinates for each one of the locations. After having initial lat lon added per each replicated row, the data-frame was exported as .csv and was imported in a Geographic Information Systems Environment (GIS). The software used was the open source qGIS. Then the .csv file was converted to ESRI ShapeFile. Through a pleathora of GIS methods and techniques, 99.7% of the geolocations were checked and revised where necessary, ensuring the credible output of the geo-referencing procedure.
A conventional list-based geoparsing procedure identified missing locations from the tweet text corpus that did not have any locations identified. The list was consisted of all the country names, the capitals of each country and in Middle East, the biggest cities of the countries. That step was imported in order to limit geolocations that were not identified through the LER GR-NLP-Toolkit based process.
Finally, after ensuring that all geolocations were geocoded properly, validations and various queries were used in order to eliminate any potential duplicates, identify any important geocoding errors, and finally generate data subsets. Those eliminated any potential duplicates that were accidentally kept or generated during the geocoding procedure. Then, various other queries isolated the more general geolocations (e.g. Greece, Italy, Europe). Those were isolated for various reasons. In the results and discussion section the reader can find relevant information.
Topic Extraction at Country Level
In current step, various subsets of the data were created based on the geocoding output. In specific the author created separate subsets of the data that were located in different countries. 15 different countries were selected for that process: Syria, Greece, Turkey, Cuprus, Israel (including Palestine), Iraq, Iran, Jordan, Germany, USA, UK, Russia, France, North Macedonia (during that time: FYROM) and Lebanon. The criteria of selecting those countries were either quantitative (frequency of geolocations) or of geopolitical interest (e.g. Russia was very important during those war events). Then LDA models were generated for extracting topics, and corresponding ngrams for each one of the countries. One LDA model for each country was generated, despite the differences of the text corpus.
Classifying topics using Machine Learning and Manual Validation/Revision
The final step of the TransGIS-LDA-SVM approach employed a Machine Learning classifier for classifying all of the topics and corresponding n-grams as 1. related to War 2. related to Refugees. In contrary to phase 1, current approach had a different logic. It was more simplified in order to be efficiently processed with automated procedures, ensuring though that vital information can be revealed. Some topics could be associated to either war or refugee classes. Therefore the author trained in a binary logic two SVM models, one per main class, in which the data were classified as “related” if they their meaning was within the scope of the corresponding class.
By combining the output of both classifiers, the topics and corresponding ngrams were classified as related to refugee class, or to war class, or of both classes. In cases that the ngram received zero score from both classifiers, then it was classified as not related to the scope of the research. In total topics of 15 different countries were processed. The reasons for selecting SVM instead of other ML/DL candidates, (e.g. Transformers, NNET, LSTM-RNN, RF) had to do with previous research of the author in which SVM after iterating the procedures was able to perform extremely well, while in the same time was the less hardware consuming and fastest in terms of training and classification, regarding tweet and social media texts in general [50,51]. Even in current research the SVM classifier did not classify tweets but n-gram rows generated by multiple tweets.

Figure 2: Focusing on Spatial Dimension: The TransGIS-LDA-SVM Approach
Result and Discussions
Phase 1: Temporal and Classification Schema
Results presented in current manuscript include: I. the experimental assessment of various parameters (Section 4.1), II. the topic modeling results and their reflection to the classification schema (Section 4.2), III. the results of the geocoding which was based on NER, and an experimental reflection of tweets containing Syria, based on the topic distribution of each tweet which was est
imated by using the corresponding LDA topic models and each tweet as a predict input (Section 4.3). The total number of extracted topics from the 70 LDA models was 1780. Each of the topics had the 10 most frequent n-grams with n in a range of 2-3. The 17800 n-grams were weighted as described in methodology section, and were classified according to the conceptual classification schema (Tables 1, 2). 4.1.1. Experimental Setup This section presents findings of the experimental setup of the topic modeling parametrization of phases I and II.
An important parameter in LDA was the n-gram range. In international research n-grams were varied to either unigrams, bigrams or trigrams while setting an n-gram range is also an option in various LDA algorithms [52]. In current research the range of n-grams was decided considering the mean coherence of the weekly created LDA models (Figure 3) along with empiric checks. Coherence is a common metric which aspired to measure the performance of the models. The higher the value, the more coherent the corpus, the more consistent the results were considered. The metric estimated a value for each topic. In general, the topic modeling metrics are not always considered reliable and manual empiric checks need to be performed in many cases [47].
In current research the 2-3grams increased the performance of the topic modeling in overall (Figure 3). The above assumption was also verified empirically as in manual checks, the 2-3grams were more understandable and less doubtful (checked in 1.7k topics).

Figure 3: Mean Coherence per Weekly Interval, Same Parameters,Varied n-gram, in Temporal Subsets [46]
Moreover, even quantitatively there was no obvious evidence in terms of log likelihood metric, manual check assessment revealed that numbers were increasing the fragmentation of some topics and n-grams i.e. posts regarding the arrival of 2,000 refugees, 1,800 refugees, or 3,000 refugees in the same week were fragmenting the topic: “many refugees arrived in Greece in that week”. In many cases “thousands” appeared in a textual presence in the corpus so it appeared in many n-grams.
Another important parameter was related to the number of iterations: Initially the author used a relatively low number of iterations: 600, and assessed with that setting the n-gram ranges, and the presence of numbers. The final number of iterations used for producing results, was 2200 considering the minimum value suggested by [47] for both phases.
Finally, the alpha and beta values were set as a = 0.1 and b = 0.01 for all the generated models. Those two values are hyper-parameters. There was not too much experimentation regarding a and b values up to the latest years [47]. In general it could be said that a, and b affect the diversity of labels and n-grams. In current stage of the research though, the b value was the default one, while the a value was auto-adjusted by the algorithm used [52]. Finally, the k parameter was customized for each subset, and was defined as the round of the total volume, divided by 650.
|
Country |
Mean coherence |
Country |
Mean coherence |
|
Syria |
0.43 |
North Macedonia (FYROM) |
0.27 |
|
Greece |
0.5 |
Germany |
0.51 |
|
Turkey |
0.34 |
UK |
0.79 |
|
Cyprus |
0.34 |
USA |
0.54 |
|
Israel (including Palestine) |
0.46 |
Russia |
0.30 |
|
Iraq |
0.35 |
Lebanon |
0.49 |
|
Iran |
0.42 |
Jordan |
0.58 |
Table 3: Mean Coherence of the Topics, per Country. During 2015 North Macedonia was recognized as FYROM
It should be mentioned, that even the parameters in both phases, were the same, the location-based subsets had less mean coherence than the temporal ones. Moreover, as already mentioned, the classification was not performed in such a depth, since the approach involved Machine learning classification, with reduced manual classification. However, the topics and the corresponding ngrams were very effectively interpretable.
|
Label (translated from greek) |
coherence |
prevalence |
|
incident_aegean* |
0.9 |
11.2 |
|
chios_refugees |
0.98 |
10.83 |
|
refugees_immigrants |
0.27 |
10.47 |
|
country_can |
0.38 |
10.38 |
|
villa_pantelidis |
0.35 |
10.15 |
|
greek_fisher |
0.72 |
10.03 |
|
invaded_parliament |
0.09 |
9.73 |
|
parliament_iraq |
0.47 |
9.68 |
|
because_violates |
0.99 |
9.03 |
|
turkish_aegean |
0.83 |
8 |
Table 4: Phase I: indicative Sample of Extracted Topics. The Labels were Translated from Greek
|
n_grams |
|
|
incident_aegean |
serious_incident |
|
greek_fisher |
threatened_greek |
|
turkish_threatened_greek |
turkish_threatened |
|
escalate_turks |
serious_incident_aegean |
|
threatened_greek_fisher |
aegean_escalate |
Table 5: Phase I: Sample of ngrams of a topic*. Ngrams are Translated in English
Topic Modeling, Results, Phase I (temporal)
Figure 4 displays the frequency of the tweets at weekly intervals for the whole time period. The day 1 of our dataset was Thursday 1st of January 2015. As a result, each weekly interval was set from Thursday to Wednesday.
In terms of volume, the pick of the year 2015 was about 50k tweets, during week 45, while for the year after, in week 9 there were about 62k tweets. The last weekly subset of year 2015 had one day more, the 31st of December, while the last weekly subset of 2016 was limited as included only the tweets of the 29th and 30th of April 2016.

Figure 4: Tweet Frequency Per Seven-Day Intervals. 52nd and 18th of 2016 Intervals are Proportioned to Seven Day period, phase I
|
N |
Accuracy |
|
40 |
0.98 |
|
N |
Accuracy |
|
40 |
0.98 |
|
N |
Accuracy |
|
40 |
0.98 |
|
N |
Accuracy |
|
40 |
0.98 |
Table 6: Evaluation of Reflection to Classes [46]

Figure 5: Number of war and Refugee Topics per Week [46]
As it can be seen in Figure 5, during the first weeks, the refugee related topics were really few, while the war related topics were more. As time unfolded the refugee topics were getting increased while after week 30 they were more than the war topics.

Figure 6: War Summary, Total Period: Topics are either Partially or Completely in Each Class, Temporal Subset
Figure 6 displays the normalized percentages of the discussion classes regarding war of the whole time period. The war scenarios dominated followed by discussions regarding human losses and war actions. Discussions useful to tracking were estimated as 11.27% of the total

Figure 7: Distribution of Refugee Classes: Experimental Results, Normalized Percentages
Figure 7 displays the normalized shares of the refugee related classes for the whole time period. The most dominant class was the one of politics/management of the refugee incidents, followed by various worries and scenarios. The third most frequent set of discussions was about supporting refugees, an important finding which could provide empiric evidence that in general the refugees were welcome in Greece during that period. Discussions about mobility of the refugees and about various negative events that occurred complete the top classes. More info, of how the discussions unfolded during time can be found in figures 8 and 9, Especially regarding mobility, we can see that those discussions started after few weeks along with scenarios/worries. Moreover, we can see discussions regarding support to refugees, also started few weeks after 01/01/2015. Moreover, when they started they were dominating the social media their frequency seems to be reduced overtime.

Figure 8: Frequent Refugee Related Classes as Time Unfolds, Normalized Values [46]
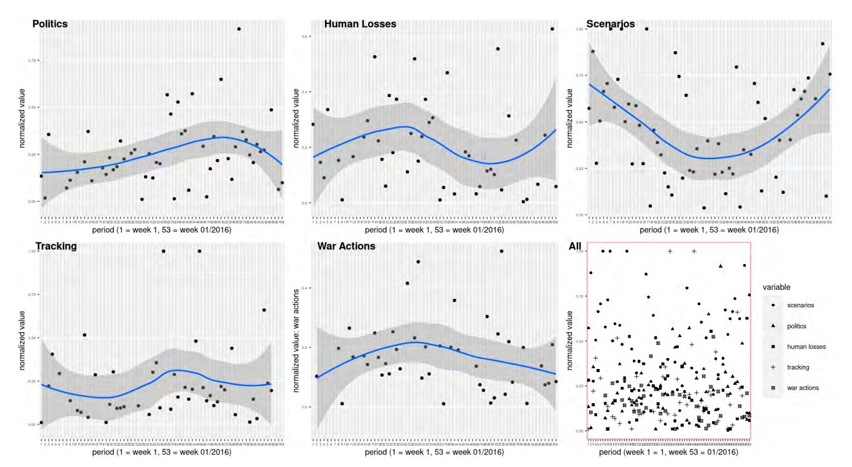
Figure 9: Frequent War Related Classes Through Time, Normalized Values [46]
Figure 9 displays the frequency of war subclasses in various plots. War scenarios dominated in various weekly intervals especially during the start and the end of the time period of analysis, having though abnormalities in terms of weekly frequencies. Moreover, discussions about danger of human life or human loss were occurring quietly often while some of their picks was during weeks 18, 22, 52. Indicatively, in week 18 there were incidents regarding war victims as a result of bombings in Iraq, along with the death of jihadists in Syria. During week 22 the human losses were linked to a fire in a hospital which resulted to deaths, to a school bombing, to the death of many policemen, along with reports that many civilians were getting dead in Syria and to car explosions in Iraq, causing deaths. Discussions regarding humanitarian aid and destroyed premises seem not to discussed a lot, at least in tweets written in Greek language. Support to Syrians dominates the tweet discussions in some weeks: i.e., week40, week 15/2016, week 27.
Phase 2, Location Extraction and Mapping
The evaluation logic of the python library named as GR-NLP-Toolkit was based considering its’ actual ability to be used for extracting geolocations, even after some processing. That means in case that partial name extraction has been performed (e.g. York, instead of New York) even it might refer to different area, or Ital instead of Italy, and any similar case were counted as correct, since during GIS processing all of those cases were successfully resolved.
As already mentioned, through various GIS processing techniques, more than 99,7% of the extracted geolocations were validated, a demanding work task which resulted to the generation of a pretty rare geodatabase. Providing specific count for each geolocation it might not be so accurate. That is because of the nature of the extracted geolocations and of the actual output of the model. Initially within a tweet, the same location can be referred multiple times. Moreover, in many other cases the model, extracts separately locations in a text string like: “Naousa city of Paros island, Greece”. And the count in that case is was ambiguous. A more accurate measurement would be tweet counts, mentioning a specific area, identified by a GIS system. Those numbers, are presented in Table 8, for each country.
|
Country |
freq |
Country |
Freq |
Country |
freq |
|
Greece |
434088 |
Portugal |
459 |
Gilvratar |
40 |
|
Syria |
248078 |
Qatar |
434 |
Panama |
37 |
|
Turkiye |
79087 |
Cuba |
429 |
Antarctica |
32 |
|
Iraq |
38819 |
Vatican City |
367 |
Turkmenistan |
32 |
|
North Macedonia |
36392 |
Morocco |
314 |
Cameroon |
31 |
|
Russian Federation |
34665 |
South Korea |
280 |
Bolivia |
28 |
|
Germany |
31165 |
Romania |
251 |
Caribbean Sea |
27 |
|
Afghanistan |
19339 |
Argentina |
238 |
Philippines |
25 |
|
Cyprus |
9447 |
India |
229 |
Sri Lanka |
25 |
|
Austria |
9083 |
Mali |
226 |
Sierra Leone |
24 |
|
France |
8586 |
Algeria |
220 |
Thailand |
24 |
|
Belgium |
7932 |
Zambia |
216 |
Central African Republic |
20 |
|
Hungary |
6526 |
Seychelles |
213 |
Singapore |
20 |
|
Somalia |
5823 |
Tunisia |
191 |
Greenland |
17 |
|
United Kingdom |
5395 |
Ethiopia |
186 |
Oman |
17 |
|
Italy |
5082 |
Azerbaijan |
184 |
Liechtenstein |
16 |
|
Serbia |
5018 |
Laos |
178 |
Guinea |
15 |
|
Jordan |
4939 |
british sovereign area |
173 |
Brunei Darussalam |
14 |
|
Iran |
4405 |
arctic sea |
172 |
Chad |
14 |
|
Palestinian Territory |
4375 |
Japan |
152 |
Madagascar |
13 |
|
Mediterranean |
4104 |
Black Sea |
143 |
Vietnam |
13 |
|
Finland |
3655 |
pacific ocean |
134 |
Moldova |
12 |
|
Libya |
3335 |
Cambodia |
130 |
Brazil |
11 |
|
China |
3225 |
Montenegro |
128 |
Andorra |
11 |
|
Denmark |
2748 |
Niger |
125 |
Namibia |
11 |
|
Croatia |
2496 |
Iceland |
123 |
Uzbekistan |
11 |
|
Albania |
2480 |
sea |
119 |
Pakistan |
8 |
|
Sweden |
2462 |
Congo |
115 |
Togo |
8 |
|
Lebanon |
2299 |
Tajikistan |
110 |
Papua New Guinea |
7 |
|
Bulgaria |
2281 |
South Sudan |
108 |
Kiribati |
7 |
|
Saudi Arabia |
1988 |
north pole and surroundings |
107 |
Canarias |
6 |
|
Spain |
1902 |
Malaysia |
104 |
Faroe Islands |
6 |
|
Yemen |
1890 |
Latvia |
98 |
Kyrgyzstan |
6 |
|
Slovenia |
1771 |
Tanzania |
94 |
Djibouti |
5 |
|
United States |
1602 |
Georgia |
93 |
North Pole |
5 |
|
North Korea |
1550 |
Bahrain |
87 |
Myanmar |
4 |
|
Norway |
1490 |
Indonesia |
84 |
North Sea |
4 |
|
Mexico |
1395 |
Israel |
83 |
Atlantic Ocean |
4 |
|
Poland |
1326 |
Peru |
82 |
Vanuatu |
4 |
|
Sudan |
1175 |
Belarus |
80 |
Ghana |
3 |
|
Zimbabwe |
1151 |
South Sea |
79 |
Turkish invaded part of Cyprus |
3 |
|
Switzerland |
1088 |
Nepal |
77 |
Lesotho |
3 |
|
Canada |
1081 |
Estonia |
77 |
Mauritania |
2 |
|
Netherlands |
1026 |
United Arab Emirates |
76 |
Paraguay |
2 |
|
Bosnia and Herzegovina |
992 |
Ecuador |
75 |
Angola |
1 |
|
Ukraine |
988 |
Lithuania |
73 |
Bangladesh |
1 |
|
Czech Republic |
977 |
Uganda |
66 |
Fiji |
1 |
|
Egypt |
952 |
Rwanda |
66 |
Guinea-Bissau |
1 |
|
Luxembourg |
874 |
Armenia |
64 |
New Caledonia |
1 |
|
Australia |
765 |
Burundi |
64 |
Trinidad and Tobago |
1 |
|
Kazakhstan |
692 |
Burkina Faso |
56 |
MediterraneanMediterranean |
1 |
|
Ireland |
658 |
Costa Rica |
52 |
Gambia |
1 |
|
Slovakia |
613 |
Liberia |
52 |
Grenada |
1 |
|
Venezuela |
498 |
Chile |
51 |
Christmass islands |
1 |
|
Eritrea |
464 |
Nigeria |
43 |
Bahamas |
1 |
|
Malta |
460 |
Senegal |
41 |
|
|
Table 7: Frequency of geolocations up to country level, per country. There are also other areas indicated with an asterisk.
*Aegean locations were included in Greece while Turkish coast locations were included in Tyrkiye
|
Country |
Tw freq |
Country |
Tw freq |
Country |
Tw freq |
|
Greece |
378353 |
Malta |
438 |
Gibraltar |
40 |
|
Syria |
235097 |
Qatar |
433 |
Panama |
37 |
|
Turkiye |
76535 |
Cuba |
419 |
Antarctica |
32 |
|
Iraq |
38098 |
Vatican City |
352 |
Turkmenistan |
32 |
|
North Macedonia |
35602 |
Morocco |
310 |
Cameroon |
31 |
|
Russian Federation |
33777 |
South Korea |
277 |
Bolivia |
28 |
|
Germany |
30437 |
Romania |
246 |
Caribbean Sea |
27 |
|
Afghanistan |
18454 |
Argentina |
235 |
Sierra Leone |
24 |
|
Austria |
8940 |
India |
226 |
Thailand |
24 |
|
Cyprus |
8679 |
Mali |
226 |
Philippines |
23 |
|
France |
8422 |
Algeria |
220 |
Sri Lanka |
22 |
|
Belgium |
7646 |
Zambia |
216 |
Central African Republic |
20 |
|
Hungary |
6479 |
Seychelles |
213 |
Singapore |
20 |
|
Somalia |
5807 |
Ethiopia |
186 |
Greenland |
17 |
|
United Kingdom |
5314 |
Tunisia |
183 |
Oman |
17 |
|
Italy |
4992 |
Azerbaijan |
180 |
Liechtenstein |
16 |
|
Serbia |
4910 |
Laos |
174 |
Guinea |
15 |
|
Jordan |
4797 |
british sovereign area |
172 |
Brunei Darussalam |
14 |
|
Iran |
4307 |
arctic sea |
172 |
Chad |
14 |
|
Palestinian Territory |
4170 |
Black Sea |
143 |
Madagascar |
13 |
|
Mediterranean |
4100 |
Japan |
135 |
Vietnam |
13 |
|
Finland |
3619 |
pacific ocean |
132 |
Moldova |
12 |
|
Libya |
3312 |
Cambodia |
130 |
Brazil |
11 |
|
China |
3118 |
Montenegro |
128 |
Andorra |
11 |
|
Denmark |
2736 |
Niger |
124 |
Namibia |
11 |
|
Croatia |
2465 |
Iceland |
123 |
Uzbekistan |
11 |
|
Albania |
2410 |
sea |
119 |
Pakistan |
8 |
|
Sweden |
2393 |
Congo |
113 |
Togo |
8 |
|
Bulgaria |
2275 |
Tajikistan |
110 |
Papua New Guinea |
7 |
|
Lebanon |
2270 |
South Sudan |
108 |
Kiribati |
7 |
|
Saudi Arabia |
1959 |
north pole and surroundings |
107 |
Canarias |
6 |
|
Yemen |
1881 |
Malaysia |
104 |
Faroe Islands |
6 |
|
Spain |
1868 |
Georgia |
93 |
Kyrgyzstan |
6 |
|
Slovenia |
1734 |
Latvia |
93 |
Djibouti |
5 |
|
United States |
1571 |
Tanzania |
88 |
North Pole |
5 |
|
North Korea |
1530 |
Bahrain |
87 |
Myanmar |
4 |
|
Norway |
1486 |
Indonesia |
83 |
North Sea |
4 |
|
Mexico |
1388 |
Peru |
82 |
Atlantic Ocean |
4 |
|
Poland |
1297 |
Belarus |
80 |
Vanuatu |
4 |
|
Sudan |
1175 |
Israel |
79 |
Ghana |
3 |
|
Zimbabwe |
1151 |
Nepal |
77 |
Turkish invaded part of Cyprus |
3 |
|
Switzerland |
1088 |
Estonia |
77 |
Lesotho |
3 |
|
Canada |
1065 |
United Arab Emirates |
76 |
Mauritania |
2 |
|
Netherlands |
1014 |
Ecuador |
75 |
Paraguay |
2 |
|
Czech Republic |
959 |
South Sea |
73 |
Angola |
1 |
|
Egypt |
932 |
Lithuania |
72 |
Bangladesh |
1 |
|
Ukraine |
917 |
Uganda |
66 |
Fiji |
1 |
|
Luxembourg |
874 |
Rwanda |
66 |
Guinea-Bissau |
1 |
|
Australia |
745 |
Armenia |
64 |
New Caledonia |
1 |
|
Bosnia and Herzegovina |
729 |
Burundi |
64 |
Trinidad and Tobago |
1 |
|
Kazakhstan |
690 |
Burkina Faso |
56 |
MediterraneanMediterranean |
1 |
|
Ireland |
658 |
Costa Rica |
52 |
Gambia |
1 |
|
Slovakia |
592 |
Liberia |
52 |
Grenada |
1 |
|
Venezuela |
495 |
Chile |
51 |
Christmass islands |
1 |
|
Eritrea |
463 |
Nigeria |
43 |
Bahamas |
1 |
|
Portugal |
458 |
Senegal |
41 |
|
|
Table 8: Tweets per country. In asterisk the countries selected for topic modeling. Some countries, including Czech Republic, include tweets that mention wider areas that country level. E.g. the Czech Republic measurement includes a lot of “Europe” Geolocations. Those countries are indicated with an asterisk. Those tweets have been excluded from the LDA corpus, in cases that they were more than 0.01% – 0.02% of the total (i.e. Middle East Geolocations were located within Iraq’s territory
Locations in Greece were widely referred in Greek tweets, followed by locations in Syria, Turkey, Iraq and North Macedonia (known as FYROM in that time, Tables 7, 8). Figures 10-15 present thematic maps visualizing the distribution of the geolocations at Global, European and Country level respectively. In the map of Greece, Figures 12-13 islets and sea-level geolocation are also demonstrated, many of them linked to shipwrecks or other incidents, which occurred close to them. The points within the sea were sea locations e.g. Aegean, Central Aegean, North Aegean, Mediterranean, South East Mediterranean. Finally, figures 14 and 15 display frequencies of locations in proportional symbols, and clusters for Iraq and Syria respectively.

Figure 10: Frequencies: World map. Clusters at 17mm distance, divided by 1000

Figure 11: Frequencies: Map of Europe, clusters of 11mm distance, divided by 100
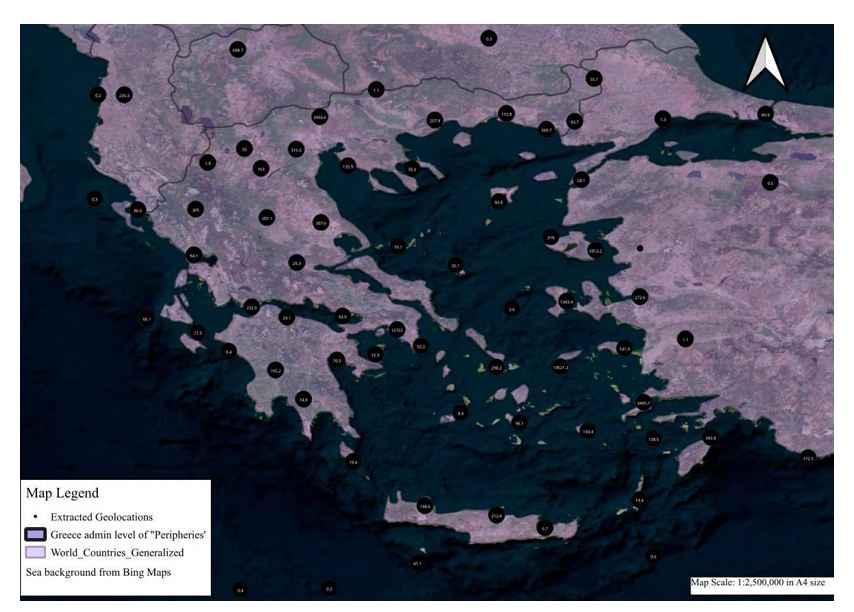
Figure 12: Map of Greece with clusters at 15mm distance, divided by 10
Figure 13: Actual geocoded locations, focusing in Greece. All the maps focus on displaying the extremely vast amount of geocoded locations
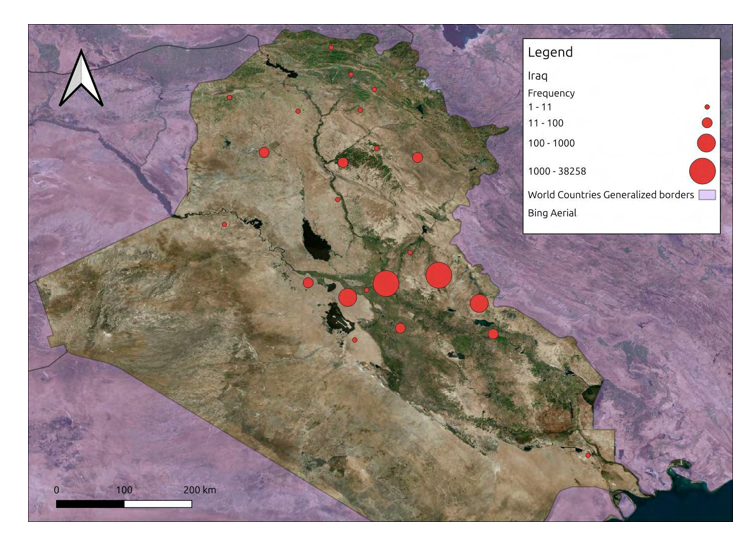
Figure 14: Frequency of Geolocations, identified in Iraq, Mapped as Proportional Symbols. Displayed Geolocations at Less than Country Level

Figure 15: 11mm clusters of geolocations in Syria, full Processing
Figure 15: 11mm clusters of geolocations in Syria, full Processing
Phase 2: Topic Modeling
In total 1,131 topics were extracted from the location-based subsets, for 15 countries. Table 9 presents the number of topics per country. The same LDA parameters as of phase I were used.
|
Country |
Number of topics |
Country |
Number of Topics |
|
Syria |
315 |
North Macedonia (FYROM) |
49 |
|
Greece |
477 |
Germany |
40 |
|
Turkey |
107 |
UK |
6 |
|
Cyprus |
9 |
USA |
2 |
|
Israel (including Palestine) |
5 |
Russia |
47 |
|
Iraq |
52 |
Lebanon |
2 |
|
Iran |
5 |
Jordan |
5 |
Table 9: Number of topics per country, in 15 countries of interest
A topic modeling related finding is that the mean coherence, estimated at spatial subsets (Table 9), was less than the coherence of the temporal subsets which can provide some interesting feeds for though, regarding the spatial and temporal dimension.
Machine Learning Classification of Local Topics
As already mentioned, the output of the research was semi-automated as it combined Machine learning and manual validations/revisions. The SVM classifier alone, trained in a da-taset, that was enriched after each attempt, in 5 different executions received a maximum accuracy to 75.5% for War related topics, and 80.9% (Figure 15) for Refugee related topics. In order to provide more accurate output, the 1,131 topics were validated and revised manually, maximizing the accuracy to almost 100% (Table 10). The manual revisions were considered as a significant component, in order to have actual results, and they are incorporated as a sub-module of the semi-fuzzy methodology, since checking, is vital for the credibility of the final output. Respecting the machine learning classification, SVM did not have the same performance as it had in previous research when tweet texts were classified [50].
In specific, the enrichment of the training dataset with the false negatives and false positives did not steadily increase the accuracy and precision metrics. That is an interesting and significant finding in terms of Machine Learning classification with SVM classifiers, and it is compliant to international literature as it is well known that the data properties differentiate the performance of the machine/ deep learning models [53]. In the previous published research mentioned the SVM classified tweet texts, while in current case was classifying topics according to n-grams with no grammatical structure. Even the schema was simplified, the simultaneous presence of both refugee and war related ngrams in the same row probably “confused” the algorithm causing a performance quite less than 90%.

Figure 16: Evolution of SVM Accuracy During Binary Classification for both classes. Sample Size was 110 rows, in a Dataset of 1126 Topics
|
War: SVM Max Acc |
SVM + Manual Validation |
Refugee: SVM max Acc |
SVM + Manual Validation |
|
75.5% |
99.9% |
80.9% |
99.9% |
Table 10: Maximum Accuracy per class, in 5 iterations for SVM, and for SVM + Sample Validation
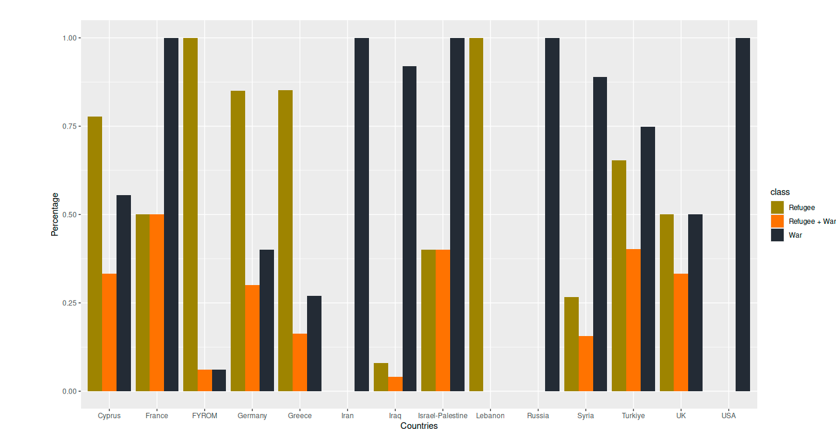
Figure 16 Shares of topic classification through SVM + Manual validation for 15 countries. Absence of some classes in some countries reflect the low frequency of potentially posted tweets, up to a threshold that related discussion did not reach at least one n-gram. The total volume of mapped locations in that area could be or could be not a case.
Figure 16 demonstrates the shares of topic classification, as a result of SVM classification and manual validation for 15 countries. Absence of some classes in some countries reflected the low frequency of potentially posted tweets, up to a threshold that related discussion did not reach at least one n-gram. The volume of generated topics in a country, could affect or not. For instance Russia is related mostly to War related topics: Discussions and scenarios about war, statements or actions of Putin, Lavrof, military actions, and communication with other political leaders. On the other hand locations in the US generated only two topics. In general UK and USA locations appeared less in the Greek discussions, while Russia appeared more. In Germany, Greece and Cyprus the locations were mostly involved in Refugee-related posts, while in Lebanon the few topics were related to refugees only. That apparently does not mean that there were zero tweets mentioning Lebanon, linked to War, but that their frequency wasn’t enough for extracting n-gram within the first ten. That is a limitation to the topic modeling approaches in general, and that is one of the reasons of characterizing the approach as semi-fuzzy.
It should be also referred, that by assessing both phases 1 and 2, the location dimension has been emerged as an important factor as it can be seen that the shares of war related and refugee related tweet discussions are distributed unequally in the geographic space (Figure 16).
In overall, the paper contributes to both presenting a novel method and actual experimental output, by integrating empirical checks and revisions to the automatically generated output as a sub-module of the methodology. That was an additional reason that it was decided to be characterized as a semi-fuzzy approach in current status. Other reasons include that it uses topic modeling which is by default, fuzzy in comparison to binary or multi-classification methods, that treat each single tweet separately. However, it has significant comparative advantages in respect to other methods, including the exploration dimension. Reasons of selecting SVM, as already mentioned classifiers instead of deep-learning or other machine learning classifiers included the speed of classification and model training, the low computer resources and proven effectiveness in similar, but not identical types of classifications [46,50]. Reasons of using LDA, according to section 2, included the fact that it is widely used in similar research, and it’s structure was assessed as more effective, respecting other methods for the processing needs of the current complicated interdisciplinary topic in current approach [30].
Finally the effective use of social media as a VGI source is validated in current research as well, in a thematic topic with a plethora of geopolitical implications and from a perspective of Greek discourse regarding the refugee waves and war incidents, differing thus the topic, considering other interesting published research [54-56].
Conclusion and future steps
Current article is an extended version of a research initially introduced during the ITDRR 2023 conference [46]. The research focused on spatiotemporal aspects of topic modeling in order to explore Greek discussions in Twitter about the refugee waves of 2015, along with the related war events. The research focused mainly on the Middle East events of that time. A credible approach regarding time and an innovative semi-fuzzy, semi-automated TransGIS-LDA-SVM method were presented for fuzzy topic extraction at temporal and spatial level. The dataset was granted from Twitter (now known as X), and was consisted of 1.4 million tweets in Greek. 2,911 topics in total were generated, from temporal and location-based subsets of the tweet texts corpus.
Coherence metric of topic modeling between temporal and spatial subsets was varied. Moreover, the SVM classifier had a maximum accuracy of 75.5% and 80.9% for war and refugee related main classes respectively, at a simplified classification logic, on the location based LDA topics. Upon manual validations the classification accuracy reached 99.9%. Empirically can be stated that validations were necessary, and not so time consuming, considering the whole approach.
The location part was processed in detail in GIS environment, through corresponding techniques and methods which led to the validation of the 99,7% of approximately 1 million geolocation.
The results, revealed interesting variations of the topics of the tweet topics both, temporally and spatially. The whole approach and current results can be useful to researchers in a variety of related scientific research fields.
The future steps of current research will include the more accurate classification by using other approaches than topic modeling, on spatiotemporal mapping providing mapping info as time unfolds. Various scripts of the approach, LDA data will be available at the lab’s repository (www.alittlemap.gr).
Acknowledgements
• The first phase of current research was presented and published in the ITDRR2023 conference: https://doi.org/10.1007/978-3-031-64037-7_8
• The R and Python scripts along with lda data can be found at author’s lab web page: www.alittlemap.gr.
• The research and the paper are GenAI free apart from some English language revisions in which GenAI assisted. • There is no conflict of interest.
• The 1.4 million tweets were granted in 2022 for academic purposes by Twitter. Data can be provided upon request for replicability purposes, to the extend that LDA permits that.
• Samples of the tweet dataset have been cross-checked, few years after 2022 with Groc of X, url checks and post content validations through internet blogging and web pages during the processing of phase II, and no problems were detected, ensuring that the initial sources were not somehow harmed during the five year time period of researching.
• The research did not receive any other grant or funding up to the date of publication.
References
- Charmarkeh, H. (2012). Social media usage, tahriib (migration), and settlement among Somali refugees in France. Refuge, 29, 43.
- Goodchild, M. F. (2007). Citizens as sensors: the world of volunteered geography. Geo Journal, 69(4), 211-221.
- Alakklouk, B., & Gülnar, B. (2023). The impact of citizen journalism and social media in news coverage of the israeli attacks on gaza. South Asian Journal of Social Sciences and Humanities, 4(4), 76-100.
- Guo, B., Chen, C., Zhang, D., Yu, Z., & Chin, A. (2016).Mobile crowd sensing and computing: when participatory sensing meets participatory social media. IEEE Communications Magazine, 54(2), 131-137.
- Doran, D., Severin, K., Gokhale, S., & Dagnino, A. (2015). Social media enabled human sensing for smart cities. AI Communications, 29(1), 57-75.
- Wilson, M. W., & Graham, M. (2013). Situating neogeography.Environment and planning A, 45(1), 3-9.
- Aldamen, Y. (2023). Can a negative representation of refugees in social media lead to compassion fatigue? An analysis of the perspectives of a sample of Syrian refugees in Jordan and Turkey. Journalism and Media, 4(1), 90-104.
- Vayansky, I., & Kumar, S. A. (2020). A review of topic modeling methods. Information Systems, 94, 101582.
- Fedoryszak, M., Frederick, B., Rajaram, V., & Zhong, C. (2019, July). Real-time event detection on social data streams. In Proceedings of the 25th ACM SIGKDD international conference on knowledge discovery & data mining (pp. 2774-2782).
- Giorgi, J., Wang, X., Sahar, N., Shin, W. Y., & Bader, G. D.,et al. (2019). End-to-end named entity recognition and relation extraction using pre-trained language models. arXiv preprint arXiv:1912.13415.
- Coletto, M., Esuli, A., Lucchese, C., Muntean, C. I., & Nardini, F. M., et al. (2016, August). Sentiment-enhanced multidimensional analysis of online social networks: perception of the mediterranean refugees crisis. In 2016 IEEE/ACM International Conference on Advances in Social Networks Analysis and Mining (ASONAM) (pp. 1270-1277). IEEE.
- Yantseva, V. (2020). Migration discourse in Sweden: Frames and sentiments in mainstream and social media. Social Media+ Society, 6(4), 2056305120981059.
- Baú, V. (2025). Posting “what” on social media? The (mis-) use of Facebook by young people in refugee camps. Journal of Information, Communication and Ethics in Society, 23(1), 134-147.
- Ladner, K., Ramineni, R., & George, K. M. (2019). Activeness of Syrian refugee crisis: an analysis of tweets. Social Network Analysis and Mining, 9(1), 61.
- Kelling, C., & Monroe, B. L. (2023). Analysing community reaction to refugees through text analysis of social media data. Journal of Ethnic and Migration Studies, 49(2), 492-534.
- Sajir, Z., & Aouragh, M. (2019). Solidarity, social media, and the" refugee crisis": Engagement beyond affect. International Journal of Communication, 13, 550-577.
- Guribye, E., & Mydland, T. S. (2018). Escape to the island: International volunteer engagement on Lesvos during the refugee crisis. Journal of Civil Society, 14(4), 346-363.
- Lee, J. S., & Nerghes, A. (2017, July). Labels and sentiment in social media: On the role of perceived agency in onlinediscussions of the refugee crisis. In Proceedings of the 8th International Conference on Social Media & Society (pp. 1-10).
- Lee, J. S., & Nerghes, A. (2018). Refugee or migrant crisis? Labels, perceived agency, and sentiment polarity in online discussions. Social Media+ Society, 4(3), 2056305118785638.
- Ross, B., Rist, M., Carbonell, G., Cabrera, B., & Kurowsky, N., et al. (2017). Measuring the reliability of hate speech annotations: The case of the european refugee crisis. arXiv preprint arXiv:1701.08118.
- Weber, M., Grunow, D., Chen, Y., & Eger, S. (2024). Social solidarity with Ukrainian and Syrian refugees in the twitter discourse. A comparison between 2015 and 2022. European Societies, 26(2), 346-373.
- Sutkute R. (2024). Public discourse on refugees in social media: A case study of the Netherlands. Discourse & Communication, 18(1), 72-97.
- Montes, N. M., Yang, Y., & Visser, M. (2026). Navigating integration in The Netherlands: Syrian refugees, digital practices, and inclusive communication. Social Inclusion, 14.
- Dhoest, A. (2020). Digital (dis) connectivity in fraught contexts: The case of gay refugees in Belgium. European Journal of Cultural Studies, 23(5), 784-800.
- Kim, J., Pratesi, F., Rossetti, G., Sîrbu, A., & Giannotti, F. (2022). Where do migrants and natives belong in a community: a Twitter case study and privacy risk analysis. Social Network Analysis and Mining, 13(1), 15.
- Kim, M. D. (2022). Advocating “refugees” for social justice: Questioning victimhood and voice in NGOs’ use of Twitter. International Journal of Communication, 16, 21-21.
- Katz, N. (2026). The Medium is the Murder": Discourse, Power, and the Contested Reality of Violence on Palestinian-Arab Social Media in Israel. Int J Med Net, 4(1), 01-08.
- Svetoka, S. (2016). Social media as a tool of hybrid warfare. NATO Strategic Communications Centre of Excellence.
- Preetham, S., Reddy, B. R., Reddy, D. S. T., & Gupta, D. (2022, November). Comparative analysis of research papers categorization using LDA and NMF approaches. In 2022 IEEE North Karnataka Subsection Flagship International Conference (NKCon) (pp. 1-7). IEEE.
- Egger, R., & Yu, J. (2022). A topic modeling comparison between lda, nmf, top2vec, and bertopic to demystify twitter posts. Frontiers in sociology, 7, 886498
- Blei, D. M., Ng, A. Y., & Jordan, M. I. (2003). Latent dirichlet allocation. Journal of machine Learning research, 3(Jan), 993-1022.
- Gupta, H., & Patel, M. (2021, March). Method of text summarization using LSA and sentence based topic modelling with Bert. In 2021 international conference on artificial intelligence and smart systems (ICAIS) (pp. 511-517). IEEE.
- Habbat, N., Anoun, H., & Hassouni, L. (2020, October). Topic modeling and sentiment analysis with LDA and NMF on Moroccan tweets. In The Proceedings of the Third International Conference on Smart City Applications (pp. 147-161). Cham: Springer International Publishing.
- Wahid, J. A., Shi, L., Gao, Y., Yang, B., & Wei, L., et al.(2022). Topic2Labels: A framework to annotate and classify the social media data through LDA topics and deep learning models for crisis response. Expert Systems with Applications, 195, 116562.
- Dessai, N. S. F., & Laxminarayanan, J. A. (2019, July). A topic modeling based approach for mining online social media data. In 2019 2nd International Conference on Intelligent Computing, Instrumentation and Control Technologies (ICICICT) (Vol. 1, pp. 704-709). IEEE.
- Blair, S. J., Bi, Y., & Mulvenna, M. D. (2020). Aggregated topic models for increasing social media topic coherence. Applied intelligence, 50(1), 138-156.
- Abinaya, G., & Winster, S. G. (2014, February). Event identification in social media through latent dirichlet allocation and named entity recognition. In Proceedings of IEEE international conference on computer communication and systems ICCCS14 (pp. 142-146). IEEE.
- Reddy, B. R., Reddy, D. S. T., Preetham, M. S., Rajasekhar,A. H. N., & Subramani, R. (2022, October). Comparative study analysis on news articles categorization using LSA and NMF approaches. In 2022 13th International Conference on Computing Communication and Networking Technologies (ICCCNT) (pp. 1-6). IEEE.
- Fortunato, C., Ambrosetti, E., & Iacobucci, A. (2026). The Evolution of Return Migration Studies: A Systematic Literature Review with Text Mining and Topic Model-ling. International Migration, 64(1), e70128.
- Hu, T., She, B., Duan, L., Yue, H., & Clunis, J. (2019). Asystematic spatial and temporal sentiment analysis on geotweets. Ieee Access, 8, 8658-8667.
- Middleton, S. E., Kordopatis-Zilos, G., Papadopoulos, S., & Kompatsiaris, Y. (2018). Location extraction from social media: Geoparsing, location disambiguation, and geotag-ging. ACM Transactions on Information Systems (TOIS), 36(4), 1-27.
- Mahajan, R., & Mansotra, V. (2021). Predicting geolocation of tweets: using combination of CNN and BiLSTM. Data Science and Engineering, 6(4), 402-410.
- Prasad, R., Udeme, A. U., Misra, S., & Bisallah, H. (2023). Identification and classification of transportation disaster tweets using improved bidirectional encoder representations from transformers. International journal of information management data insights, 3(1), 100154.
- Ambrosio-Aguilar, A. D., Bárcenas, E., Molero-Castillo, G., & Aldeco-Pérez, R. (2021, October). Geolocation of tweets in Spanish with transformer encoders. In 2021 9th InternationalConference in Software Engineering Research and Innovation (CONISOFT) (pp. 227-231). IEEE.
- Fotouhi, M., Wang, H., Arabshahi, P., & Cheng, W. (2022, September). Extraction of reliable and actionable information from social media during emergencies. In 2022 IEEE GlobalHumanitarian Technology Conference (GHTC) (pp. 461-464). IEEE.
- Arapostathis, S. G. (2023, December). Archiving social media discussions in time and space: A focus on refugees from Middle East and related war conflicts during Jan 2015–Apr 2016. In International Conference on Information Technology in Disaster Risk Reduction (pp. 115-132). Cham: Springer Nature Switzerland.
- Maier, D., Waldherr, A., Miltner, P., Wiedemann, G., & Niekler, A., et al. (2018). Apply-ing LDA topic modeling in communication research: Toward a valid and reliable methodology. Communication methods and measures, 12(2-3), 93-118.
- Barrie, C., & Ho, J. C. T. (2021). academictwitteR: an R package to access the Twitter Academic Research Product Track v2 API endpoint. Journal of Open Source Software, 6(62), 3272.
- Smyrnioudis, N., & Koutsikakis, J. (2021). A Transformer-based natural language processing toolkit for Greek–Named entity recognition and multitask learning.
- Arapostathis, S. G. (2021). A methodology for automatic acquisition of flood-event management information from social media: the flood in Messinia, South Greece, 2016. Information Systems Frontiers, 23(5), 1127-1144.
- Arapostathis, S. G. (2025). Exploiting Multiple Social Media Sources and Multiple Modelling for Severe Weather Management: The Case Study of the Medicane Ianos. Open Access Journal of Applied Sciences and Technology.
- Pilacuan-Bonete, L., Galindo-Villardón, P., & Delgado-Álvarez, F. (2022). HJ-Biplot as a tool to give an extra analytical boost for the latent Dirichlet assignment (LDA) model: with an application to digital news analysis about COVID-19. Mathematics, 10(14), 2529.
- Hernandez-Suarez, A., Sanchez-Perez, G., Toscano-Medina, K., Perez-Meana, H., & Por-tillo-Portillo, J., et al. (2019). Using twitter data to monitor natural disaster social dynamics: A recurrent neural network approach with word embeddings and kernel density esti-mation. Sensors, 19(7), 1746.
- Arapostathis, S. G. (2020). Fundamentals of volunteered geographic information in disaster management related to floods. In Flood Impact Mitigation and Resilience Enhancement. IntechOpen.
- Feng, Y., Huang, X., & Sester, M. (2022). Extraction and analysis of natural disaster-related VGI from social media: review, opportunities and challenges. International Journal of Geographical Information Science, 36(7), 1275-1316.
- Havas, C., Wendlinger, L., Stier, J., Julka, S., & Krieger, V., et al. (2021). Spatio-temporal machine learning analysis of social media data and refugee movement statistics. ISPRS International Journal of Geo-Information, 10(8), 498.