

Advances in Bioengineering and Biomedical Science Research(ABBSR)
ISSN: 2640-4133 | DOI: 10.33140/ABBSR
Impact Factor: 1.7

Research Article - (2021) Volume 4, Issue 4
Determination and Profiling of Secondary Metabolites in Aloe vera, Aloe arborescens and Aloe saponaria
2KimJeongMoon Aloe Ltd., 15 Saimdang-ro, Seocho-gu, Seoul, 06649, Korea
Received Date: Dec 14, 2021 / Accepted Date: Dec 20, 2021 / Published Date: Dec 29, 2021
Copyright: ©Copyright: ©2021 Dong-Myong Kim, et al. This is an open-access article distributed under the terms of the Creative Commons Attribution License, which permits unrestricted use, distribution, and reproduction in any medium, provided the original author and source are credited.
Citation: Dong-Myong Kim, Ju-Yeong Jung, Hyung-Kon Lee, Yong-Seong Kwon, and Yeon-Mea Choi (2021) Determination and Profiling of Secondary Metabolites in Aloe Vera, Aloe Arborescens and Aloe Saponaria. Adv Bioeng Biomed Sci Res 4(4): 129-136 .
Abstract
Metabolomics is as an innovative technique for discriminating plant species. The objective of this study was to investigate the secondary metabolites of three different Aloe species, A. vera, A. arborescens, and A. saponaria profiled by 1 H-NMR analysis. Principal component analysis (PCA) derived from the 1 H-NMR spectra indicated a clear discrimination among the Aloe species, providing high predictability and good fitness of the PCA model (R2 = 0.928 and Q2 = 865). As observed in the PLS-DA score plot, discrimination was observed in the Aloe species with respect to primary metabolites including sugar and organic acid and secondary metabolites such as phenylpropanoids and carotenoids. A. vera was characterized by high levels of malate. On the other hand, as compared to the other Aloe species, A. arborescens was characterized by higher levels of aloenin and sugar metabolites such as sucrose and glucose. Furthermore, the secondary metabolites were quantitatively analyzed by HPLC, and the amounts of carotenoids including zeaxanthin, α- and β-carotene, and phenylpropanoids in A. arborescens were found to be significantly higher than those in the other Aloe species. In conclusion, we demonstrated that 1 H-NMR-based metabolomics with chemometric analysis can be used for the facile discrimination of Aloe species.
Keywords
Aloe vera, Aloe arborescens, Aloe saponaria, 1 H-NMR, Phenylpropanoid, Carotenoid
Introduction
Aloe is a very common Liliaceae family, native to Africa, con-taining approximately 400 species of tropical plants. Throughout history, it has long been used for medical purposes. Meanwhile, from the 400 species of Aloe, only a few have been traditionally used as herbal medicine. In this regard, A. vera is the commonly used form of Aloe for medical purposes. Aloe contains several classes of secondary metabolites such as phenolic compounds, saponins, sterols, and several anthraquinones. Aloin and emo-din are the most important anthraquinones, and they exhibit an-ti-bacterial, anticancer, anti-viral, and analgesic activities [1-3]. Metabolomics has been demonstrated to be an appropriate tool for the composition analysis of plants and foods [4]. Thus far, some studies have reported the use of gas chromatography mass spectrometry (GC–MS) and high-performance liquid chroma-tography (HPLC) for the analysis of Aloe species [5, 6]. On the other hand, the metabolite profiles of Aloe species based on 1H-nuclear magnetic resonance (NMR) spectroscopy have not been reported.
Metabolomic analysis techniques are preferable for obtaining metabolite profiles as they are rapid and reproducible; moreover, the preparation procedures of samples are simple [7, 8]. A tech¬nique based on NMR can satisfy those requirements, considering that NMR has been broadly employed as a fingerprinting tool for the quality control analysis of natural and synthetic products. The use of 1H-NMR spectroscopy for metabolite profiling and fingerprint analyses has been reported for the characterization and analysis of comparative amounts of specific herbal extracts. Recently, several metabolic profiling techniques have been re¬ported in general, and new methods have also been reported for metabonomic and metabolomic studies [9-13]. Metabolite fin¬gerprinting using 1H-NMR has been extensively used for various plant-derived products such as green tea, ginseng, wine, olive oil, Angelica gigas, and others [14-25].
Carotenoids, mainly found in photosynthetic organism including plant, bacteria, and fungi, are diverse groups of organic com¬pounds derived from the 2-C-methyl-D-erythritol 4-phosphate pathway (Figure 1). The group contains more than approx¬imately 600 naturally occurring pigments responsible for yel¬low, orange, and red colors, being part of various physiological processes in plants [26]. Meanwhile, in human, several carot¬enoids are considered essential nutrients, and the others exhibit protective effects against some diseases. For instance, α- and β-carotene are precursors of vitamin A, which are essential for the prevention of xerophthalmia, and blindness, and premature death [27, 28]. In addition, the consumption of other carotenoids has been reported to significantly decrease the risk of lung and prostate cancer, photosensitivity disease, cataract, and cardio-vascular [29-32].
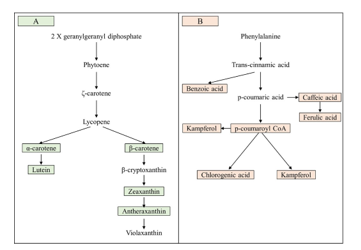
Figure 1: (A) Biosynthetic pathway of carotenoid in plants (B) Biosynthetic pathway of phenylpropanoid in plants.
Meanwhile, phenylpropanoids are organic compounds that are synthesized from phenylalanine in plants (Figure 1). It is also widely distributed in nature and is one of the highest secondary metabolites in the plant kingdom. The biosynthesis of various secondary metabolites such as antioxidants, light protectants, coumarins, hydroxyl-cinnamic amides, salicylic acid, lignins, flavonoids and pigments has been reported to follow the phenyl-propanoid pathway [33, 34]. However, while previous metabolic studies for Aloe species have mainly focused on biosynthesis of anthraquinones, which is represent one class of secondary me¬tabolites in Aloe, the biosynthesis of carotenoid and phenylpropanoid remains neglected.
In this study, 1H-NMR-based metabolite profiles of Aloe species such as A. vera, A. arborescens, and A. saponaria were inves-tigated. Their secondary metabolites such as carotenoids and phenylpropanoids were also separated and quantified by HPLC. The present study is to give insight into metabolite profiling us¬ing 1H-NMR as a reliable approach for obtaining complemen¬tary description on primary and secondary metabolites among three different species of Aloe
Materials and Methods
Plant Materials
For chemical analysis, three species of one-year-old Aloe was supported by Jeju aloe farm of KimJeongMoon Aloe (Jeju, Ko-rea). First, the leaves of the three species of Aloe were harvested, respectively. Next, fresh samples were dipped into liquid nitro-gen and stored at −80OC in DF8510 deep-freezer (Ilshin Lab Co., Ltd., Daejeon, Korea) until further use. Finally, all the samples were freeze-dried at −80OC for 72 h, and lyophilized samples were ground into a fine powder.
Sample Preparation for NMR Analyses
The sample preparation and NMR analysis were performed us-ing a method reported in a previous study [35]. First, Aloe pow-ders were weighed into 100 mg. Second, 500 µL of methanol (d4) (99.8%), 400 μL of a 0.2 M phosphate buffer solution (0.2 M Na2HPO4, 0.2 M NaH2PO4 in deuterium oxide (D2O), pH 7.0), and 100 μL of 5 mM 2,2-dimethyl-2-silapentane-5-sulfonic acid (DSS, 97%) as extraction solvents were transferred to the sam¬ple powders. Third, DSS was used for the internal standard with a chemical shift (δ) of 0.0 ppm, and D2O was employed for the internal lock signal. Next, the extracts were adjusted to pH 7.0 using 1 mM HCl and NaOH solutions after sonication for 20 min and were centrifuged at room temperature at 13,000 rpm for 10 min. Finally, 600 μL of the extract was transferred to 5 mm NMR tubes (Norell, Landisville, NJ, USA) for NMR analysis.
NMR Spectroscopy
1H-NMR spectra were recorded on a VNMRS 600 MHz NMR spectrometer (Agilent Technology, Santa Clara, CA, USA) using a triple-resonance 5 mm HCN salt-tolerant cold probe (Agilent Technology). A NOESY PRESAT pulse sequence, suppressing signals of the residual water, was used to obtain the spectra. 64 K data points were acquired from 32 scans using following pa¬rameters: spectral width, 8445.9 Hz; a relaxation delay, 2.0 s; and an acquisition time, 4.0 s; and a mixing time, 100 ms. All the spectra were Fourier-transformed with a line-broadening value of 0.5 Hz line, followed by phase-adjusting and baseline correc¬tion using Chenomx NMR suite 6.0 software (Chenomx Inc., Edmonton, Canada). The signal assignments of samples were fa¬cilitated with Chenomx NMR suite 6.0, a 600 MHz (pH 6.0−8.0) NMR database and comparison with literature values [36, 37].
1H-NMR Data Analysis
1H-NMR data analysis was performed using a method reported in a previous study. Each NMR spectrum was bucketed by inte¬grating regions containing an equal bin size of 0.01 ppm over a δ range of 0.8–7.70. All shifts associated with the solvent (i.e., between 3.25–3.33 and 4.73–4.92 ppm) and DSS were removed. The normalization of spectra was achieved with the standard (DSS) peak area, and the spectra was converted to the ASCII for¬mat. ASCII files were imported into MATLAB (R2006a; Math-works, Inc., Natick, MA, USA), and all spectra were aligned using the correlation optimized warping (COW) method. For multivariate data analysis, SIMCA-P+ version 12.0 (Umetrics, Umea, Sweden) was used, and then the files were Pareto-scaled to minimize the effect of baseline noise and deviations. Principal component analysis (PCA) and partial least squares discriminant analysis (PLS-DA) were carried out to investigate the intrinsic variation in the data set and acquired an overview of variation among the groups. Variables with variable importance in projec¬tion (VIP) values > 1 in the PLS-DA model were sorted and heat map was generated from VIP values > 1 using Multi Experiment Viewer Ver. 4.9.0 (Mev, http://www.tm4.org/mev/). The metab¬olites of Aloe extracts with VIP values > 1 were quantitated with the Chenomx NMR suite 6.0 software, comparing the integral of the DSS signal with the equivalent from a library of compounds including peak multiplicities and chemical shifts for all the com¬pound resonances.
Extraction and HPLC Analysis of Carotenoids
The extraction and analysis method used for carotenoid analysis was similar to the previous studies [38, 39]. Briefly, 300 mg of powders from samples of the three species was transferred to 3 mL of 0.1% ascorbic acid/ethanol (w/v) and then vortexed for 30 s. The mixture was incubated in a water bath set at 85 °C for 5 min. Next, 120 L of 80% potassium hydroxide (w/v) was loaded to saponify any potentially interfering oils and incubated set at 85 °C for 10 min. Subsequently, each sample was placed on ice to stop the reaction for 5 min, and then 50 μL of β-Apo-8’-carotenal (25 ppm), as an internal standard was added, Next, the sample was extracted with 1.5 mL cold distilled water and 1.5 mL of hexane (Sam-Chun Chemical, Pyeongtaek, Korea), and then centrifuged at 1,200 rpm at 4 °C to obtain supernatants. The above-mentioned procedure was performed twice more. Then, the collected extract was dried under nitrogen gas and re-sus¬pended in 300 μL of dichloromethane/methanol (50:50 v/v). An Agilent Technologies 1100 series (Palo Alto, CA, USA), HPLC system combined with a C30 YMC column (250 × 4.6 mm, 3 m; Waters Corporation, Milford, MA) and with a photodiode array (PDA) detector was used to separate carotenoid contents. HPLC condition was set as follows: detection wavelength, 450 nm; flow rate, 1.0 mL/min; injection volume, 20 μL. The gradi¬ent program was established: Solvent (A), methanol/water (92:8 v/v) with 10 mM ammonium acetate; Solvent (B); 0 min, 83% A; 23 min, 70% A; 29 min, 59%; 35 min, 30% A; 40 min, 30% A; 44 min, 83% A; and 55 min, 83% A. Each compound was identified and quantitated primarily compared with UV-visible spectrum data and retention times with that of standards.
Extraction and HPLC Analysis of Phenylpropanoid
Phenylpropanoid analysis was performed using a method report-ed in a previous study [40]. External standards, hydrochloric acid, acetic acid and methanol were purchased from Extrasynthese (Genay, France), Sam-Chun Chemical (Pyeongtaek, Korea), Sigma-Aldrich Co., Ltd. (St. Louis, MO, USA) and J.T Baker® Chemicals (Phillipsburg, NJ, USA), respectively. Firstly, 6 mL of 62.5% aqueous methanol (v/v) composed of 2 g/L tert-bu-tylhydroquinone was injected to a total of 100 mg of sample of the three species. After the addition of 1.5 mL 6 N hydrochloric acid, each sample was incubated at 90 °C for 2 h for hydrolysis and centrifuged at 3,000 rpm for 10 min. The supernatant was diluted 2 x was filtered through a 0.22 μm PTFE syringe filters into brown vials prior to HPLC-UV anaylsis. Each phenylpro-panoid was identified and quantitated on a C18 column (250 × 4.6 mm, 5 μm; RStech; Daejeon, Korea) in a HPLC system (NS-4000, Futecs Daejeon, Korea) combined with an UV−Vis detector. HPLC condition was set as follows: detection wave-length, 280 nm; oven temperature, 40 °C; flow rate, 1.0 mL/min; injection volume, 20 μL. The gradient program was established: Solvent (A), Acetic acid/methanol/water (2.5:5.0:92.5 v/v/v); Solvent (B), Acetic acid/methanol/water (2.5:95:2.5 v/v/v); 0-48 min, 0-80% B; and 0% 48-58 min (total 58 min). Each com¬pound was quantified according to peak areas and calculated as the equivalents of representative standard compounds.
Statistical Methods
GraphPad PRISM (ver. 5.0; GraphPad Software, Inc.) for Krus-kal-Walli’s test was used to test the significant differences in lev¬els of metabolite among the three species of Aloe. Mann-Whit¬ney tests were performed to reveal pairwise differences with the critical p value set at 0.05.
Results
1H-NMR and Chemometric Data Analysis
Figure 2 indicated 1-dimensional 1H-NMR spectra of the aque¬ous extracts from A. arborescens, A. saponaria, and A. vera. Predominance of several metabolites such as fructose, glucose, isocitrate, malate, and sucrosewas observed. In particular, pre¬dominant signals of sugar compounds and organic acids were observed. A visual comparison revealed that signals of aloenin were observed along with predominant signals of sugars such as glucose and sucrose in the spectrum of A. arborescens.

Figure 2: Representative 1H NMR spectra of Aloe species (A) A. arborescens, (B) A. saponaria (C) A. vera.
First, PCA score plot was employed to determine if the metabol¬ic fingerprint of Aloe samples was unique enough to discern the difference among the three species and identify the biomarkers for each species. Each point in the score plot describes an indi-vidual sample, and the samples indicating that similar variances are clustered together. The PCA score plot exhibited a clear sep¬aration among the three species (R2 = 0.928 and Q2 = 0.865). The model parameters for the explained variation, R2, and predictive capability, Q2, were significantly high (R2, Q2 > 0.5), indicating excellent model fitting. To identify the underlying variables con¬tributing to the differentiation, we sorted VIP values from the PLS-DA model (Figure 3A, R2X= 0.882, R2X= 0.986, and Q2 = 0.973). In particular, A. arborescens was separated from two other species along the principal component 1, indicating that A. arborescens has the most different character, such as signals of aloenin, in its aqueous extract.
Variables with VIP values > 1 were represented using heat map (Figure 3B). Heat map showed different patterns among three aloe species and each variable with VIP values > 1 were identi¬fied as malate, isocitrate, sucrose, glucose, aloenin, and fructose
Figure 3: PLS-DA score plot and heat map derived from 1H NMR spectra of Aloe species (A) PLS-DA score plot derived from 1H NMR spectra of A. arborescens, A. saponaria, and A. vera (B) Heat map of variables bucketed from 1H NMR spectra with VIP values > 1. Each value in the heat map is a colored representation of a calculated Z-score.
Quantitative Analysis of Metabolites
Concentrations of identified malate, isocitrate, sucrose, glucose, and fructose were determined using the 600 MHz library from Chenomx NMR Suite 6.0 and exhibited significant differences among three Aloe species (Figure 4). On the other hands, aloenin couldn’t be quantified because aloenin weren’t included in Chenomx library.

Figure 4: Quantitative analysis of sugar and organic acid metabolites. Data are represented as means of replicates with error bars indicating standard deviations. Statistical analysis are carried out using Mann-Whitney tests and significant difference are indicated as asterisks (* p<0.05, ** p<0.01).
A. vera was characterized by the highest levels of organic acid metabolites such as malate which are related to raw materials for cosmetics, health foods, and medicine, whereas A. arborescens was characterized by the lowest levels of organic acid metabo-lites such as isocitrate and malate. However, it was characterized by the highest levels of sugar metabolites such as sucrose and glucose.
The isocitrate, malate, glucose and sucrose levels significantly differed between A. arborescens and A. saponaria. In addition, A. arborescens and A. vera showed differences in malate, glu-cose, and sucrose levels. A. saponaria and A. vera exhibited dif-fering levels of isocitrate, malate, fructose, glucose, and sucrose.
Carotenoid Analysis
Carotenoids from A. vera, A. arboresens, and A. saponaria were analyzed. As shown in Table 1, different patterns were observed depending on the amount of carotenoid in the three species. A total of five carotenoids (α-carotene, lutein, zeaxanthin, anthe¬raxanthin, and β-carotene) were detected. Among the detected carotenoids in all species, the amount of lutein was the highest, while that of antheraxanthin was the lowest. Although, all Aloe species contained almost similar amounts of carotenoid com¬pounds, the amount of zeaxanthin in A. arborescens was 2 times higher as compared with that in the other two species. Further¬more, this species contained more α-carotene (3.55 ± 0.10 μg/g) and β-carotene (55.57 ± 1.36 μg/g) compounds than in the other species: The amount of β-carotene was 1.6 times higher in A. arborescens than that in the others. The amounts of the different carotenoids in the three species were observed in the order of lutein > β-carotene > α-carotene > zeaxanthin > antheraxanthin.
Table 1: Content of carotenoids in the three Aloe species
|
(μg/g) |
A. arborescens |
A. saponaria |
A. vera |
|
Antheraxanthin |
0.53±0.01* |
0.51 ± 0.01 |
0.44 ± 0.01 |
|
Lutein |
98.83 ± 2.08 |
102.85 ± 1.85 |
93.48 ± 1.95 |
|
Zeaxanthin |
1.12 ± 0.00 |
0.42 ± 0.02 |
0.46 ± 0.01 |
|
α-Carotene |
3.55 ± 0.10 |
2.61 ± 0.18 |
2.13 ± 0.11 |
|
β-Carotene |
55.57 ± 1.36 |
34.49 ± 0.22 |
33.44 ± 1.69 |
|
Total |
159.60 ± 3.55 |
140.88 ± 2.29 |
129.95 ± 3.76 |
|
Kaempferol |
- |
35.16 ± 5.54 |
- |
|
Total |
383.47 ± 49.5 |
461.55 ± 16.13 |
180.83 ± 5.1 |
*Each values represent mean ± SD.
Phenylpropanoid Analysis
Table 2 lists the differences in the amounts of the accumulated phenylpropanoid observed in the three Aloe species. After HPLC analysis, seven phenylpropanoids (p-coumaric acid, chlorogen-ic acid, benzoic acid, caffeic acid, quercetin, ferulic acid, and kaempferol) were detected. A. saponaria contained the highest amount of the total phenylpropanoid compounds (461.55 ± 16.13 μg/g), while as compared to A. saponaria, A. arborescens con¬tained more phenylpropanoids (A. arborescens - 6, A. saponaria - 5, A. vera - 4). All Aloe species contained p-coumaric acid, fe-rulic acid, and benzoic acid. A. vera contained marginal amounts of the total phenylpropanoid compounds (180.83 ± 5.18 μg/g) compared to the other species. The highest amount of benzoic acid was observed in A. saponaria (372.79 ± 9.91 μg/g). Mean¬while, A. vera contained higher amounts of benzoic acid (83.78 ± 2.88 μg/g) as compared to other phenylpropanoid compounds. The amount of chlorogenic acid was higher in A. vera (72.05 ± 1.00 μg/g) as compared with that in A. arborescens (42.01 ± 0.34 μg/g), while no chlorogenic acid was detected in A. saponaria. The highest amount of caffeic acid (129.25 ± 20.78 μg/g) was observed in A. arborescens, with marginal amounts observed in A. saponaria (36.95 ± 0.48 μg/g); caffeic acid was not observed in A. vera. Quercetin and kaempferol were detected only in A. arborescens and A. saponaria, respectively.
Table 2. Content of phenylpropanoids in the three Aloe species
|
(μg/g) |
A. arborescens |
A. saponaria |
A. vera |
|
Chlorogenic acid |
42.01 ± 0.34* |
- |
72.05 ± 1.00 |
|
Caffeic acid |
129.25 ± 20.78 |
36.95 ± 0.48 |
- |
|
p-Coumaric acid |
44.31 ± 7.91 |
1.81 ± 0.01 |
17.25 ± 0.42 |
|
Ferulic acid |
4.88 ± 0.73 |
14.84 ± 0.19 |
7.75 ± 0.80 |
|
Benzoic acid |
76.88 ± 12.20 |
372.79 ± 9.91 |
83.78 ± 2.88 |
|
Quercetin |
86.14 ± 7.54 |
- |
- |
|
Kaempferol |
- |
35.16 ± 5.54 |
- |
|
Total |
383.47 ± 49.5 |
461.55 ± 16.13 |
180.83 ± 5.1 |
*Each values represent mean ± SD.
Discussion
Aloe is one of the most useful and widely used plants for var-ious purposes. Typically, A. vera is the most used commercial form of Aloe in pharmaceuticals because it has been studied ex¬tensively, and several researchers have reported that it exhibits more chemical properties than the others. However, now, the other forms, A. arborescens and A. saponaria, are also attracting attention caused by their different chemical characteristics and medicinal uses. In particular, A. saponaria and A. arborescens not only have similar, but also a higher content of, metabolites as compared with A. vera. HPLC was conducted to analyze secondary metabolite in the three Aloe species.
Unfortunately, studies with respect to carotenoids in Aloe are very limited. Merzlyak et al. [41] have reported that the accumu-lation of rhodoxanthin (red keto-carotenoid) in A. arborescens was induced under strong sunlight and its combination with drought environment. As shown in Figure 4, five carotenoids were present in the Aloe species, with lutein being present in the highest amount, which is a well-known carotenoid used as main-tenance of eye health and eye-related diseases. Several studies have also described that the reduction in the risk for eye diseases was attributed to an increase in macular pigmentation [42, 43]. Meanwhile, α, β-carotene, being the most common precursors for vitamin A carotenoid, was abundant in A. arborescens (Table 2).
Phenylalanine is a precursor of phenylpropanoid, which is an extensively used compound. Based on the observed results, phenylalanine was not detected in A. arborescens. In this study, only seven compounds were analyzed. However, it may contain many other phenylpropanoids besides these seven compounds. Nicolson has reported that phenylalanine is not detected from the nectar of A. arborescens, which is supported by the results of this study [44].
All Aloe species have similar secondary metabolites, albeit dif¬fering in various amounts and patterns. In our results, the three species of Aloe had different phenylpropanoids. In particular, quercetin and kaempferol were specifically observed in A. arborescens and A. saponaria, respectively. A. greatheadii var. davyana extracts and A. ferox contained pyrimidine, ketone, al-dehyde, alkane, dicarboxylic acid, organic acid, alcohol, fatty acid, phenolic acid, indole, phytosterol, alkaloid, and phytoster¬ol by GC–MS analysis [45, 46]. Because of its phytochemical composition, it shows promise in alleviating symptoms related to the prevention of cancer, diabetes, neurodegeneration, and cardiovascular diseases.
By LC–MS analysis, chlorogenic acid, caffeic acid, 5-p-couma-roylquinic acid, caffeoylshikimic acid, 5-p-cis-coumaroylquinic acid, p-coumaric acid, and ferulic acid as well as apigenin, quer¬cetin, luteolin, isovitexin, kaempferol, saponarin, isoorientin, and lutonarin have been identified in the flowers of A. vera [47]. Further investigation of metabolic analysis and profiling could reveal the chemical properties of the Aloe species, and clinical trials would be necessary regarding the claims before accurate conclusions can be made.
Conclusion
In this study, the metabolic differences of three different Aloe species, A. vera, A. arborescens, and A. saponaria, were inves-tigated by 1H-NMR-based metabolite profiling. The PCA de-rived from the 1H-NMR spectra indicated a clear discrimination among the Aloe species, providing high predictability and good fitness of the PCA model (R2 = 0.928 and Q2 = 865). As observed in the PLS-DA score plot, discrimination was observed in the Aloe species with respect to primary metabolites including sug¬ar and organic acid and secondary metabolites such as phenyl¬propanoids and carotenoids. A. vera was characterized by high levels of malate, whereas A. arborescens was characterized by higher levels of aloenin and sugar metabolites such as sucrose and glucose. Furthermore, the secondary metabolites were quan-titatively analyzed by HPLC, and the amounts of carotenoids in¬cluding zeaxanthin, α- and β-carotene, and phenylpropanoids in A. arborescens were found to be significantly higher than those in the other Aloe species. It is demonstrated that 1H-NMR-based metabolomics with chemometric analysis can be used for the facile discrimination of Aloe species.
Acknowledgement
This work was supported by the Technology Development Pro-gram [grant number S3049433] funded by the Ministry of SMEs and Startups (MSS, Korea).
References
- Hamman JH (2008) Composition and applications of Aloe vera leaf gel. Molecules 13: 1599-1616.
- Reynolds T (1985) The compounds in Aloe leaf exudates: a review. Botanical Journal of the Linnean society 90: 157-177.
- Shelton RM (1991) Aloe vera: its chemical and therapeutic properties. International journal of dermatology 30: 679-683.
- Allwood JW, Erban A, de Koning S, Dunn WB, Luedemann A, et al. (2009) Inter-laboratory reproducibility of fast gas chromatography–electron impact–time of flight mass spectrometry (GC–EI–TOF/MS) based plant metabolomics. Metabolomics 5: 479-496.
- ElSohly MA, Gul W, Murphy TP (2004) Analysis of the anthraquinones aloe-emodin and aloin by gas chromatography/mass spectrometry. International immunopharmacol-ogy 4: 1739-1744.
- Okamura N, Asai M, Hine N, Yagi A (1996) High-performance liquid chromatographic determination of phenolic compounds in Aloe species. Journal of Chromatography A 746: 225-231.
- Choi HK, Yoon JH, Kim YS, Kwon DY (2007) Metabolomic profiling of Cheonggukjang during fermentation by 1H NMR spectrometry and principal components analysis. Process Biochemistry 42: 263-266.
- Sumner LW, Mendes P, Dixon RA (2003) Plant metabolomics: large-scale phytochemistry in the functional genomics era. Phytochemistry 62: 817-836.
- Lindon JC, Holmes E, Bollard ME, Stanley EG, Nicholson JK (2004) Metabonomics technologies and their applications in physiological monitoring, drug safety assessment and disease diagnosis. Biomarkers 9: 1-31.
- Nicholson JK, Connelly J, Lindon JC, Holmes E (2002) Metabonomics: a platform for studying drug toxicity and gene function. Nature reviews Drug discovery 1: 153-161.
- Nicholson JK, Lindon JC, Holmes E (1999) ‘Metabo-nomics’: understanding the metabolic responses of living systems to pathophysiological stimuli via multivariate statistical analysis of biological NMR spectroscopic data. Xe-nobiotica 29: 1181-1189.
- Kell DB (2004) Metabolomics and systems biology: making sense of the soup. Current opinion in microbiology 7: 296-307.
- Weckwerth W, Fiehn O (2002) Can we discover novel pathways using metabolomic analysis? Current opinion in biotechnology 13: 156-160.
- Lee JE, Lee BJ, Chung JO, Hwang JA, Lee SJ, et al. (2010) Geographical and climatic dependencies of green tea (Ca-mellia sinensis) metabolites: a 1H NMR-based metabolomics study. Journal of agricultural and food chemistry 58: 10582-10589.
- Tarachiwin L, Ute K, Kobayashi A, Fukusaki E (2007) 1H NMR based metabolic profiling in the evaluation of Japanese green tea quality. Journal of agricultural and food chemistry 55: 9330-9336.
- Kim SH, Hyun SH, Yang SO, Choi HK, Lee BY (2010) 1H-NMR-Based discrimination of thermal and vinegar treated ginseng roots. Journal of food science 75: C577-C581.
- Lee EJ, Shaykhutdinov R, Weljie AM, Vogel HJ, Facchini PJ, et al. (2009a) Quality assessment of ginseng by 1H NMR metabolite fingerprinting and profiling analysis. Journal of agricultural and food chemistry 57: 7513-7522.
- Lee JE, Hwang GS, Van Den Berg F, Lee CH, Hong YS (2009b) Evidence of vintage effects on grape wines using 1H NMR-based metabolomic study. Analytica Chimica Acta 648: 71-76.
- Son HS, Hwang GS, Ahn HJ, Park WM, Lee CH, et al. (2009a) Characterization of wines from grape varieties through multivariate statistical analysis of 1H NMR spectroscopic data. Food Research International 42: 1483-1491.
- Son HS, Hwang GS, Kim KM, Ahn HJ, Park WM, et al. (2009b) Metabolomic studies on geographical grapes and their wines using 1H NMR analysis coupled with multivariate statistics. Journal of agricultural and food chemistry 57: 1481-1490.
- Rezzi S, Axelson DE, Héberger K, Reniero F, Mariani C, et al. (2005) Classification of olive oils using high throughput flow 1H NMR fingerprinting with principal component analysis, linear discriminant analysis and probabilistic neural networks. Analytica Chimica Acta 552: 13-24.
- Kim EJ, Kwon J, Park SH, Park C, Seo YB, et al. (2011) Metabolite profiling of Angelica gigas from different geographical origins using 1H NMR and UPLC-MS analyses. Journal of agricultural and food chemistry 59: 8806-8815.
- Choi HK, Choi YH, Verberne M, Lefeber AW, Erkelens C, et al. (2004) Metabolic fingerprinting of wild type and transgenic tobacco plants by 1H NMR and multivariate analysis technique. Phytochemistry 65: 857-864.
- Consonni R, Cagliani L, Stocchero M, Porretta S (2009) Triple concentrated tomato paste: discrimination between Italian and Chinese products. Journal of agricultural and food chemistry 57: 4506-4513.
- Tarachiwin L, Katoh A, Ute K, Fukusaki E (2008) Quality evaluation of Angelica acutiloba Kitagawa roots by 1H NMR-based metabolic fingerprinting. Journal of pharmaceutical and biomedical analysis 48: 42-48.
- Paiva SA, Russell RM (1999) β-carotene and other carotenoids as antioxidants. Journal of the American college of nutrition 18: 426-433.
- Council NR, Council NR (2000) Dietary reference intakes for vitamin C, vitamin E, selenium, and carotenoids. Washington DC: National Academy Press.
- Mayne ST (1996) Beta-carotene, carotenoids, and disease prevention in humans. The FASEB Journal 10: 690-701.
- Giovannucci E (1999) Tomatoes, tomato-based products, lycopene, and cancer: review of the epidemiologic literature. Journal of the national cancer institute 91: 317-331.
- Holick CN, Michaud DS, Stolzenberg Solomon R, Mayne ST, Pietinen P, et al. (2002). Dietary carotenoids, serum β-carotene, and retinol and risk of lung cancer in the al-pha-tocopherol, beta-carotene cohort study. American Journal of Epidemiology 156: 536-547.
- Botella Pavía P, Rodríguez Concepción M (2006) Carotenoid biotechnology in plants for nutritionally improved foods. Physiologia plantarum 126: 369-381.
- Kritchevsky SB (1999) β-Carotene, carotenoids and the prevention of coronary heart disease. The Journal of nutrition 129: 5-8.
- Boudet AM (2000) Lignins and lignification: selected issues. Plant physiology and biochemistry 38: 81-96.
- Dixon RA, Paiva NL (1995) Stress-induced phenylpropanoid metabolism. The plant cell 7: 1085.
- Jung JY, Jung Y, Kim JS, Ryu DH, Hwang GS (2013) Assessment of peeling of Astragalus roots using 1H NMR-and UPLC-MS-based metabolite profiling. Journal of agricultural and food chemistry 61: 10398-10407.
- Du X, Bai Y, Liang H, Wang Z, Zhao Y, et al. (2006) Solvent effect in 1H NMR spectra of 3′-hydroxy-4′-methoxy isofla-vonoids from Astragalus membranaceus var. mongholicus. Magnetic Resonance in Chemistry 44: 708-712.
- Ryu SY, Lee HS, Kim YK, Kim SH (1997) Determination of isoprenyl and lavandulyl positions of flavonoids from So-phora flavescens by NMR experiment. Archives of Pharma-cal Research 20: 491-495.
- Park CH, Chae SC, Park SY, Kim JK, Kim YJ, et al. (2015) Anthocyanin and carotenoid contents in different cultivars of chrysanthemum (Dendranthema grandiflorum Ramat.) flower. Molecules 20: 11090-11102.
- Park WT, Kim JK, Park S, Lee SW, Li X, et al. (2012) Metabolic profiling of glucosinolates, anthocyanins, carotenoids, and other secondary metabolites in kohlrabi (Brassica ol-eracea var. gongylodes). Journal of agricultural and food chemistry 60: 8111-8116.
- Huang S, Liu Z, Yao R, Li D, Feng H (2015) Comparative transcriptome analysis of the petal degeneration mutantpdm in Chinese cabbage (Brassica campestris ssp. pekinen-sis) using RNA-Seq. Molecular genetics and genomics 290: 1833-1847.
- Merzlyak M, Solovchenko A, Pogosyan S (2005) Optical properties of rhodoxanthin accumulated in Aloe arborescens Mill. leaves under high-light stress with special reference to its photoprotective function. Photochemical & Photobiological Sciences 4: 333-340.
- Berendschot TT, Goldbohm RA, Klopping WA, van de Kraats J, van Norel J, et al. (2000) Influence of lutein supplementation on macular pigment, assessed with two objective techniques. Investigative ophthalmology & visual science 41: 3322-3326.
- SanGiovanni JP, Chew EY, Agron E, Clemons TE, Ferris FL, et al. (2008) The relationship of dietary ω-3 long-chain polyunsaturated fatty acid intake with incident age-related macular degeneration: AREDS report no. 23. Archives of ophthalmology 126: 1274-1279.
- Nicolson SW (2007) Amino acid concentrations in the nectars of southern African bird-pollinated flowers, especially Aloe and Erythrina. Journal of chemical ecology 33: 1707-1720.
- Botes L, Van der Westhuizen FH, Loots DT (2008) Phytochemical contents and antioxidant capacities of two Aloe greatheadii var. davyana extracts. Molecules 13: 2169-2180.
- Loots DT, van der Westhuizen FH, Botes L (2007) Aloe ferox leaf gel phytochemical content, antioxidant capacity, and possible health benefits. Journal of agricultural and food chemistry 55: 6891-6896
- Keyhanian S, Stahl Biskup E (2007) Phenolic constituents in dried flowers of Aloe vera (Aloe barbadensis) and their in vitro antioxidative capacity. Planta medica 73: 599-602.