
Archivos de Ciencia e Investigación(ADCI)
ISSN: 3068-014X | DOI: 10.33140/ADCI


Research Article - (2025) Volume 1, Issue 1
Determinants of Under-Five Child Mortality in Rwanda: Analysis of the 2019/20 Rwanda Demographic and Health Survey
2University of Rwanda, College of Medicine and Health Sciences, School of Public Health, Rwanda
Received Date: Mar 02, 2025 / Accepted Date: Apr 07, 2025 / Published Date: Apr 10, 2025
Copyright: ©©2025 Jean Marie Vianney NIYONSENGA, et al. This is an open-access article distributed under the terms of the Creative Commons Attribution License, which permits unrestricted use, distribution, and reproduction in any medium, provided the original author and source are credited.
Citation: NIYONSENGA, J. M. V., Andegirogish, A. K., Mochama, M. (2025). Determinants of Under-five Child Mortality in Rwanda: Analysis of the 2019/20 Rwanda Demographic and Health Survey. Arch Cienc Investig, 1(1), 01-10.
Abstract
Background: Under-five child mortality (U5M) is a critical indicator of public health, particularly in regions with limited healthcare access. This study aimed to identify the socioeconomic and healthcare of U5M in Rwanda using data from the 2019/20 Rwanda Demographic and Health Survey (RDHS).
Methods: This study utilized secondary data from the 2019/20 RDHS, a nationally representative survey. A weighted sample of 8,324 children under five was analyzed. Both bivariate and multivariate analyses were conducted to assess the relationships between U5M and a range of socioeconomic and healthcare-related factors. The dependent variable was child mortality status, while independent variables included Maternal age at birth, Maternal education level, Maternal employment status, Household wealth index, Place of residence, Sex of the child, Birth order, Birth interval, Size at birth, Mode of delivery, Multiple births, Antenatal care visits, Place of delivery and Breastfeeding initiation time. Multivariate logistic regression was applied to control for confounders.
Results: The national under-five mortality rate (U5MR) was 38 deaths per 1,000 live births, with significant regional variations. The highest mortality rate was observed in the Northern region (44 deaths per 1,000 live births), while Kigali had the lowest rate (27 deaths per 1,000 live births). Key determinants of U5M included maternal employment (AOR = 2.23, 95% CI: 1.25-3.95), non- cesarean delivery (AOR = 1.84, 95% CI: 1.04-3.28), delayed breastfeeding initiation (AOR = 7.20, 95% CI: 4.93-12.72), multiple births (AOR = 2.19, 95% CI: 1.09-4.43), smaller-than-average birth size (AOR = 2.96, 95% CI: 1.83-4.78), and birth intervals shorter than 18 months (AOR = 1.91, 95% CI: 1.06-3.44).
Conclusion: The findings highlight the need for targeted interventions, particularly in regions with higher mortality rates. Public health policies should focus on maternal and child health interventions, including breastfeeding promotion, maternal care, and addressing the needs of working mothers.
Keywords
Under-Five Mortality, Rwanda, Demographic and Health Survey, Child Health, Determinants
Introduction
Child mortality remains a major public health challenge globally, with under-five mortality rate (U5MR) serving as a key indicator of child health and overall development. Over the past three decades, substantial progress has been made in reducing U5MR worldwide, declining from 90 deaths per 1,000 live births in 1990 to 37.7 per 1,000 in 2019. However, this progress has been uneven, with sub-Saharan Africa accounting for more than 50% of all under- five deaths globally [1]. The leading causes of under-five deaths include neonatal conditions such as preterm birth complications, birth asphyxia, and infections, as well as pneumonia, diarrhea, and malnutrition While medical interventions such as immunization, oral rehydration therapy, and improved prenatal care have contributed to mortality reduction, many preventable deaths persist due to socioeconomic disparities, limited healthcare access, and gaps in maternal education [2].
Rwanda has made remarkable progress in reducing child mortality over the past two decades due to expanded healthcare coverage, improved maternal and child health programs, and government investments in community health. The under-five mortality rate (U5MR) declined from 238 deaths per 1,000 live births in 1994 to 50 per 1,000 in 2015, reflecting a nearly 75% reduction [3,4]. This success coincided with malaria control interventions, integrated community case management (iCCM) of childhood illnesses, and expanded access to healthcare services. The implementation of iCCM led to a 38% decline in child mortality, while insecticide- treated net distribution increased from 4% to 70% among children under five, and indoor residual spraying covered 1.3 million people in high-burden districts by 2010 [5-7]. Interestingly, by 2010, disparities in U5MR between urban and rural areas had significantly narrowed, suggesting that Rwanda's efforts effectively reached marginalized populations [4]. However, socioeconomic and educational disparities persist, with children of mothers with no formal education still experiencing higher mortality rates. While Rwanda is among Africa’s top-performing countries in child survival, it has not yet met the Sustainable Development Goal (SDG) target of reducing U5MR to 25 per 1,000 live births by 2030 [8]. Addressing these remaining disparities requires a deeper understanding of the determinants influencing child survival.
Existing studies on child mortality in Rwanda have primarily focused on national-level trends, with limited research examining specific risk factors and regional disparities [9]. Furthermore, there is a gap in knowledge regarding how maternal, socioeconomic, and health-related factors influence U5M in Rwanda. This study aims to identify key determinants of under-five mortality using the latest 2019/20 RDHS data. Understanding these factors is critical for designing targeted interventions that can accelerate progress toward SDG child survival targets.
Methods
Study Design and Data Source
This study employed a cross-sectional analytical design using secondary data from the 2019/20 Rwanda Demographic and Health Survey (RDHS), a nationally representative survey conducted by the National Institute of Statistics of Rwanda (NISR) in collaboration with ICF International. The RDHS used a two-stage stratified cluster sampling method to ensure national representation. The study sample consisted of 8,324 children under the age of five, after applying sample weights to account for the complex survey design. Data sets used in the analysis are publicly available and can be accessed online through https://dhsprogram. com/data/available-datasets.cfm. 2.2 Variables and Data Collection
Dependent Variable
The outcome variable of interest in this study was under-five mortality (U5M), which was defined as the survival status of a child under five years old. This variable was dichotomized as a binary outcome, where children who were alive at the time of the survey were coded as “0” (Alive), while those who had died before reaching their fifth birthday were coded as “1” (Deceased). The data for this variable were extracted from the birth history section of the RDHS, where mothers reported the survival status and age at death of each child they had given birth to.
Independent Variables and Selection Criteria
The selection of independent variables was guided by the Mosley and Chen analytical framework for child survival, which categorizes determinants of child mortality into proximate (biological and health-related) and distal (socioeconomic and environmental) factors [10]. Maternal and household characteristics considered in this study included maternal age at birth, categorized as ≤19 years, 20–34 years, and ≥35 years, as maternal age has been shown to influence child survival outcomes. Maternal education level was classified into no education, primary, secondary, and higher education, as previous studies have demonstrated a strong link between maternal literacy and child health. Additionally, maternal employment status was included as a binary variable (employed vs. unemployed) to assess the potential impact of working mothers on child survival. Socioeconomic status was measured using the household wealth index, which was divided into five quintiles: poorest, poor, middle, rich, and richest. Place of residence was also included as a key variable, categorized into urban and rural areas, as rural populations often have reduced access to healthcare services.
Child-related factors included sex of the child (male vs. female), birth order (first child, second–third, fourth or higher), and birth interval (<18 months, 18–35 months, and ≥36 months), as these factors influence neonatal and infant survival. Birth size (small, average, large) was considered as a proxy for fetal growth and potential health complications at birth. Additionally, mode of delivery (cesarean vs. vaginal) was examined to assess whether surgical deliveries offered a survival advantage. Given that twins and multiple births are associated with higher mortality risks, multiple births (singleton vs. twin/multiple) was included as a variable. Health service utilization and nutrition-related variables included antenatal care visits (0, 1–3, and 4+ visits), as adequate prenatal care is critical for reducing neonatal complications. Place of delivery (health facility vs. home) was analyzed to understand the impact of skilled birth attendance on child survival. Additionally, breastfeeding initiation time (immediate [≤1 hour] vs. late [>1 hour]) was included, given its well-documented role in neonatal health and immunity.
Statistical Analysis
Data analysis was performed using STATA 17.0, with survey- weighted procedures applied to account for the complex sampling design of the RDHS. Descriptive statistics were generated to summarize the characteristics of the study population. Categorical variables were expressed as frequencies and percentages, and bivariate associations between under-five mortality (U5M) and independent variables were assessed using Chi-square tests. Variables found to be statistically significant (p < 0.05) in the bivariate analysis were selected for inclusion in the multivariate model.
To examine the adjusted effects of independent variables on U5M, multivariate logistic regression was conducted. This statistical approach was selected as the outcome variable (U5M) is binary, making logistic regression the most appropriate method for estimating the likelihood of child mortality while controlling for potential confounders. Adjusted odds ratios (AORs) with 95% confidence intervals (CIs) were reported to quantify the strength and direction of associations. To ensure the robustness of the model, multicollinearity was assessed using the Variance Inflation Factor (VIF), with a VIF threshold of <10 indicating the absence of significant multicollinearity. The Hosmer-Leme show goodness- of-fit test was conducted to evaluate model adequacy, with a p-value > 0.05 signifying a well-fitting model. All statistical tests were two-tailed, and a p-value < 0.05 was considered statistically significant.
Results
Participant Characteristics
Of the 8,324 children included, 96.34% were alive, while 3.66% had died. Higher mortality rates were observed among children of young mothers (<19 years), mothers with no antenatal care visits, and those from poorer households (Table 1).
Unweighted N=8092 Weighted N=8324
Variables N(%) N(%) Alive (%) Dead(%)
|
The survival status of the child |
|
|
8019(96.34) 305(3.66) |
|
age of the respondent |
|
|
|
|
<19 Years |
125(1.54) |
127(1.52) |
121(95.54) 6(4.46) |
|
20 -34 years |
5111(63.16) |
5277(63.4) |
5092(96.50) 185(3.50) |
|
35-49 Years |
2856(35.29) |
2920(35.08) |
2806(96.09) 114(3.91) |
|
Mother's age at birth |
|
|
|
|
< 19 years |
467(5.77) |
485(5.82) |
460(94.97) 24(5.03) |
|
≥ 20 years |
7625(94.23) |
7839(94.18) |
7559(96.43) 280(3.57) |
|
Marital Status |
|
|
|
|
never in union |
719(8.89) |
713(8.57) |
684(95.90) 29(4.10) |
|
in union |
7373(91.11) |
7611(91.43) |
7336(96.38) 275(3.62) |
|
Highest educational level of the mother |
|
|
|
|
No education |
918(11.34) |
957(11.5) |
913(95.46) 43(4.54) |
|
Primary |
5277(65.24) |
5400(64.88) |
5197(96.22) 204(3.78) |
|
Secondary + Husband/partner's education level |
1897(23.44) |
1967(23.63) |
1909(97.09) 57(2.91) |
|
no education |
893(13.3) |
916(13.25) |
879(95.94) 37(4.06) |
|
primary |
4500(67.01) |
4654(67.31) |
4477(96.22) 176(3.78) |
|
secondary + |
1322(19.69) |
1344(19.44) |
1318 (98.10) 25(1.90) |
|
Respondent's occupation (grouped) |
|
|
|
|
not-working |
1426(17.62) |
1461(17.56) |
1425(97.48) 36(2.52) |
|
working |
6666(82.38) |
6863(82.44) |
6595(96.10) 268(3.90) |
|
Husband/partner's occupation (grouped) |
|
|
|
|
not-working |
437(6.53) |
432(6.28) |
415(96.13) 17(3.87) |
|
working |
6251(93.47) |
6451(93.72) |
6231(96.60) 219(3.40) |
|
wealth index categorized |
|
|
|
|
poor |
3576(44.19) |
3584(43.06) |
3408(95,09) 176(4.91) |
|
middle |
1518(18.76) |
1607(19.3) |
1560(97.07) 47(2.93) |
|
rich |
2998(37.05) |
3133(37.64) |
3052(97.39) |
82(2.61) |
|
type of place of residence Had antenatal visits during pregnancy |
|
|
|
|
|
No ANC visits |
2054(25.38) |
2166(26.02) |
1996(92.16) |
170(7.84) |
|
Had at least one ANC |
6038(74.62) |
6158(73.98) |
6024(97.81) |
135(2.19) |
|
timing of 1st antenatal check (weeks)) |
|
|
|
|
|
less than 12 weeks |
3668(45.33) |
3696(44.40) |
3612(97.72) |
84(2.28) |
|
greater than 12 weeks |
4424(54.67) |
4628(55.6) |
4408(95.24) |
220.24(4.76) |
|
Delivery by caesarean section |
|
|
|
|
|
No |
6858(84.75) |
7080(85.06) |
6809(96.18) |
271(3.82) |
|
Yes |
1234(15.25) |
1244(14.94) |
1210(97.28) |
34(2.720 |
|
place of residency |
|
|
|
|
|
Institutional delivery |
7532(93.08) |
7754(93.15) |
7497 (96.69) |
257(3.31) |
|
Home delivery |
560(6.92) |
571(6.85) |
523(91.65) |
47(8.35) |
|
when child put to breast |
|
|
|
|
|
Not-immediately |
2848(35.20) |
2960(35.56) |
2727(92.11) |
233(7.89) |
|
Immediately |
5244(64.80) |
5364(64.44) |
5293(98.67) |
71(1.33) |
|
sex of child |
|
|
|
|
|
male |
4095(50.61) |
4205(50.52) |
4045(96.20) |
160(3.80) |
|
female |
3997(49.39) |
4119(49.48) |
3974(96.48) |
145(3.52) |
|
plurality of birth |
|
|
|
|
|
single |
7851(97.02) |
8078(97.05) |
7813(96.71) |
265(3.29) |
|
multiple |
241(2.98) |
246(2.95) |
207(84.06) |
39(15.94) |
|
size of child at birth |
|
|
|
|
|
smaller than average |
1464(18.20) |
1505(18.20) |
1406(93.44) |
99(6.56) |
|
average |
4188(52.06) |
4299(51.98) |
4168(96.96) |
131(3.04) |
|
larger than average |
2393(29.75) |
2466(29.82) |
2401(97.38) |
65(2.62) |
|
preceding birth interval (months) |
|
|
|
|
|
≥ 24 months |
5145(85.58) |
5285(85.17) |
5098(96.46) |
187(3.54) |
|
18-23 months |
582(9.68) |
615(9.91) |
593(96.45) |
22(3.55) |
|
< 18 months |
285(4.74) |
305(4.92) |
285(93.45) |
20(6.60) |
|
(birth order number) |
|
|
|
|
|
≤ Three |
5342(66.02) |
5487(65.92) |
5302(96.62) |
185(3.38) |
|
≥ Four |
2750(33.98) |
2837(34.08) |
2718(95.80) |
119(4.20) |
Table 1: Frequency Distribution of Study Variables
Under-Five Mortality Rates
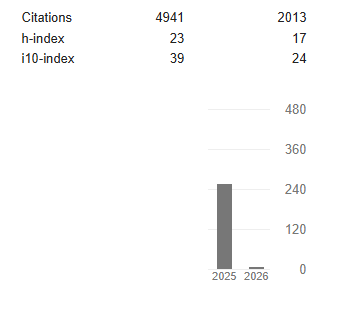
The overall U5MR in Rwanda was 38 deaths per 1,000 live births (Figure 1). Regional disparities were evident, with Kigali recording the lowest U5MR (27 deaths per 1,000), while the Northern region had the highest rate (44 deaths per 1,000) (Figure 2).
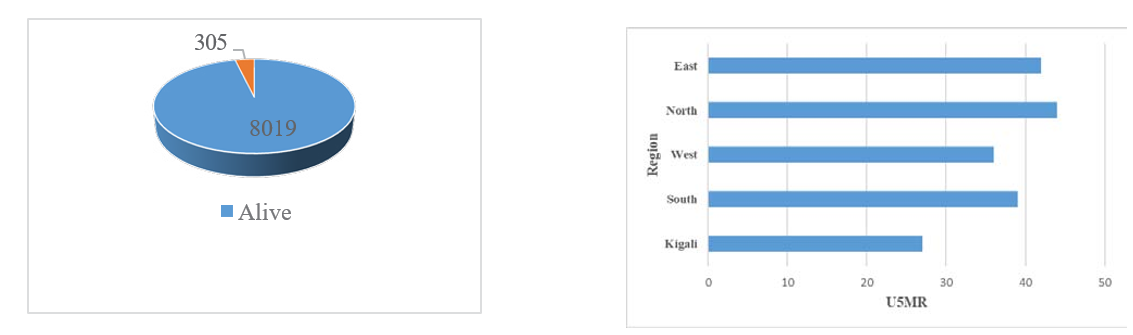
Figure 1: Under five Mortality Rate Figure 2: Geographical Distribution
Determinants of Under-Five Mortality
Bivariate Analysis of Determinants of Under Five Mortality in Rwanda
In bivariate analysis age of respondents, age of mother at birth, paternal education, wealth index, region of residence, ANC visits, delivery method, breastfeeding plurality of birth plurity, size of child at birth and preceding birth interval were found significantly associated with U5M with the P <0.05 (Table 2).
|
Variables |
N(%) |
Alive (%) |
Dead(%) |
Χ2 |
|
P-Value |
|
age of the respondent |
|
|
|
|
9.97 |
0.04 |
|
<19 Years |
127(1.52) |
121(95.54) |
6(4.46) |
|
|
|
|
20 -34 years |
5277(63.4) |
5092(96.50) |
185(3.50) |
|
|
|
|
35-49 Years |
2920(35.08) |
2806(96.09) |
114(3.91) |
|
|
|
|
Mother's age at birth |
|
|
|
|
9.23 |
0.01 |
|
< 19 years |
485(5.82) |
460(94.97) |
24(5.03) |
|
|
|
|
≥ 20 years |
7839(94.18) |
7559(96.43) |
280(3.57) |
|
|
|
|
Marital Status |
|
|
|
|
0.42 |
0.53 |
|
never in union |
713(8.57) |
684(95.90) |
29(4.10) |
|
|
|
|
in union |
7611(91.43) |
7336(96.38) |
275(3.62) |
|
|
|
|
Highest educational level of the mother |
|
|
|
|
6.91 |
0.09 |
|
No education |
957(11.5) |
913(95.46) |
43(4.54) |
|
|
|
|
Primary |
5400(64.88) |
5197(96.22) |
204(3.78) |
|
|
|
|
Secondary + |
1967(23.63) |
1909(97.09) |
57(2.91) |
|
|
|
|
Husband/partner's education level |
|
|
|
|
7.26 |
0.8 |
|
no education |
916(13.25) |
879(95.94) |
37(4.06) |
|
|
|
|
primary |
4654(67.31) |
4477(96.22) |
176(3.78) |
|
|
|
|
secondary + |
1344(19.44) |
1318 (98.10) |
25(1.90) |
|
|
|
|
Respondent's occupation (grouped) not-working |
1461(17.56) |
1425(97.48) |
36(2.52) |
18.63 |
0.06 |
|
working |
6863(82.44) |
6595(96.10) |
268(3.90) |
|
|
|
Husband/partner's occupation (grouped) |
|
|
|
|
|
|
not-working |
432(6.28) |
415(96.13) |
17(3.87) |
10.56 |
0.36 |
|
working |
6451(93.72) |
6231(96.60) |
219(3.40) |
|
|
|
wealth index categorized |
|
|
|
27.26 |
<0.01 |
|
poor |
3584(43.06) |
3408(95,09) |
176(4.91) |
|
|
|
middle |
1607(19.3) |
1560(97.07) |
47(2.93) |
|
|
|
rich |
3133(37.64) |
3052(97.39) |
82(2.61) |
|
|
|
type of place of residence |
|
|
|
2.63 |
0.18 |
|
Urban |
1454(17.47) |
1411(97.08) |
43(2.92) |
|
|
|
Rural |
6870(82.53) |
6608(96.19) |
262(3.81) |
|
|
|
sex of household head |
|
|
|
1.8 |
0.23 |
|
male |
6436(77.32) |
6211(96.49) |
226(3.51) |
|
|
|
female |
1888(22.68) |
1809(95.82) |
79(4.18) |
|
|
|
Provinces of Rwanda(Region) |
|
|
|
6.63 |
.40 |
|
Kigali |
1164(13.98) |
1133(97.37) |
31(2.63) |
|
|
|
South |
1672(20.09) |
1610(96.28) |
62(3.72) |
|
|
|
West |
2009(24.14) |
1940(96.54) |
69(3.46) |
|
|
|
North |
1267(15.22) |
1214(95.80) |
53(4.20) |
|
|
|
East |
2212(26.58) |
2123(95.97) |
89(4.03) |
|
|
|
Had antenatal visits during pregnancy |
|
|
|
39.14 |
<0.01 |
|
No ANC visits |
2166(26.02) |
1996(92.16) |
170(7.84) |
|
|
|
Had at least one ANC |
6158(73.98) |
6024(97.81) |
135(2.19) |
|
|
|
timing of 1st antenatal check (weeks)) |
|
|
|
5.06 |
0.91 |
|
less than 12 weeks |
3696(44.40) |
3612(97.72) |
84(2.28) |
|
|
|
greater than 12 weeks |
4628(55.6) |
4408(95.24) |
220.24(4.76) |
|
|
|
Delivery by caesarean section |
|
|
|
3.57 |
0.05 |
|
No |
7080(85.06) |
6809(96.18) |
271(3.82) |
|
|
|
Yes |
1244(14.94) |
1210(97.28) |
34(2.720 |
|
|
|
place of residency |
|
|
|
49.14 |
<0.01 |
|
Institutional delivery |
7754(93.15) |
7497 (96.69) |
257(3.31) |
|
|
|
Home delivery |
571(6.85) |
523(91.65) |
47(8.35) |
|
|
|
when child put to breast |
|
|
|
226.45 |
0.05 |
|
Not-immediately |
2960(35.56) |
2727(92.11) |
233(7.89) |
|
|
|
Immediately |
5364(64.44) |
5293(98.67) |
71(1.33) |
|
|
|
sex of child |
|
|
|
0.45 |
0.53 |
|
male |
4205(50.52) |
4045(96.20) |
160(3.80) |
|
|
|
female |
4119(49.48) |
3974(96.48) |
145(3.52) |
|
|
|
plurality of birth |
|
|
|
26.59 |
<0.01 |
|
single |
8078(97.05) |
7813(96.71) |
265(3.29) |
|
|
|
multiple |
246(2.95) |
207(84.06) |
39(15.94) |
|
|
|
size of child at birth |
|
|
|
231.19 |
<0.01 |
|
smaller than average |
1505(18.20) |
1406(93.44) |
99(6.56) |
|
|
|
average |
4299(51.98) |
4168(96.96) |
131(3.04) |
|
|
|
larger than average |
2466(29.82) |
2401(97.38) |
65(2.62) |
|
|
|
preceding birth interval |
|
|
|
7.54 |
0.04 |
|
(months) |
|
|
|
|
|
|
≥ 24 months |
5285(85.17) |
5098(96.46) |
187(3.54) |
|
|
|
18-23 months |
615(9.91) |
593(96.45) |
22(3.55) |
|
|
|
< 18 months |
305(4.92) |
285(93.45) |
20(6.60) |
|
|
|
(birth order number) |
|
|
|
3.45 |
0.10 |
|
≤ Three |
5487(65.92) |
5302(96.62) |
185(3.38) |
|
|
|
≥ Four |
2837(34.08) |
2718(95.80) |
119(4.20) |
|
|
Table 2: Bivariate Analysis of Determinants of Under-Five Mortality in Rwanda
Multivariate Analysis of Determinants of Under-Five Mor- tality in Rwanda
As indicated in Table 3, the results of a multivariate analysis examined various determinants of under-five mortality, focusing on variables such as partner education, maternal employment status, wealth index), place of residence, antenatal care (ANC) attendance, timing of the first ANC visit, delivery location, breastfeeding practices, plurality of birth, birth weight, and birth intervals. All the variables, place of residence (P>0.05), were statistically significant in the unadjusted models. The place of residence did not exhibit a significant association with under-five mortality post-adjustment (AOR = 0.96, P = 0.71), although the crude analysis suggested a modestly elevated risk for children residing in rural areas (COR = 1.32, P = 0.24).
Children of mothers whose partners had no formal education exhibited more than a twofold increase in the likelihood of under- five mortality compared to those with partners who attained secondary education or higher (Crude Odds Ratio [COR] = 2.19, P = 0.01). However, this association was decreased after adjusting for confounding variables (Adjusted Odds Ratio [AOR] = 1.39, P = 0.43). A similar trend was observed among children whose fathers had completed only primary education (COR = 2.03, P < 0.01; AOR = 1.75, P = 0.11). Conversely, maternal employment demonstrated a protective effect; children of working mothers had significantly lower odds of under-five mortality in the adjusted analysis (AOR = 2.23, P = 0.01), despite the crude analysis indicating lower mortality among non-working mothers (COR = 0.64, P = 0.03).
The wealth index was a significant predictor of mortality risk, with children from impoverished households facing a 93% increase in odds of dying before the age of five compared to those from affluent households (COR = 1.93, P < 0.01). However, this association weakened following adjustment (AOR = 1.46, P = 0.10), and no significant mortality differences were noted for children from middle-income households (AOR = 1.12, P = 0.72).
Children born to mothers who did not attend any ANC visits were at significantly increased odds of mortality (COR = 3.80, P < 0.01), though this association became non-significant after adjustment (AOR = 0.78, P = 0.33). Furthermore, late initiation of ANC visits (after 12 weeks’ gestation) significantly increased the risk of mortality compared to those who initiated visits earlier (AOR = 1.88, P = 0.03). Initially, children born at home appeared less likely to die before age five (COR = 0.38, P < 0.01); however, this association lost significance after adjustment (AOR = 1.46, P = 0.22).
Breastfeeding practices emerged as a critical determinant, with children not breastfed immediately after birth exhibiting over six- fold higher odds of mortality (COR = 6.37, P < 0.01), a finding that strengthened after adjustment (AOR = 8.24, P < 0.01). Additionally, children born from multiple births had significantly elevated odds of mortality (COR = 5.58, P < 0.01), with this association remaining significant after adjustment (AOR = 2.57, P = 0.01). Infants categorized as smaller-than-average at birth were also at significantly higher risk of dying before age five (COR = 2.60, P < 0.01), with this association persisting post-adjustment (AOR = 2.72, P < 0.01). No significant differences in mortality were observed for infants of average birth weight.
Finally, children born after a birth interval of less than 18 months were at a significantly higher risk of mortality (COR = 1.92, p = 0.01), with this effect persisting after adjustment (AOR = 1.91, P = 0.03). No significant differences in mortality risk were noted for birth intervals of 18 to 23 months (Table 3).
Variables COR(95%CI) P-value AOR(95%CI) P-value
Husband/partner's education
No education 2.19(1.27-3.77)*** 0.01 1.39(0.63-2.90) 0.43
Primary 2.03(1.28-3.23)*** <0.01 1.75(0.89-3.44) 0.11
Secondary + Ref Ref Ref Ref Respondent's occupation
not-working Ref Ref Ref Ref
working 0.64(0.43-0.94)** 0.03 2.23(1.2.5-3.95)*** 0.01
Wealth Index
Poor 1.93(1.41-2.63)*** <0.01 1.46(0.93-2.30) 0.10
Middle 1.13(0.73-1.74) 0.59 1.12(0.62-2.02) 0.72
Rich Ref Ref Ref Ref
Place of residence
Urban Ref Ref Ref Ref
Rural 1.32(0.88,1.98) 0.242 0.96 (0.77, 1.20) 0.71
ANC Visits
No ANC visits 3.80(2.96-4.89)*** <0.01 0.78(0.47-1.29) 0.33
Had at least one ANC Ref Ref Ref Ref Timing of first ANC
less than 12 weeks Ref Ref Ref Ref
greater than 12 weeks 2.14(1.58-2.89)*** <0.01 1.88(1.05-3.34)** 0.03
Place of delivery
Institutional delivery Ref Ref Ref Ref
Home delivery 0.38(0.25-0.57)*** <0.01 1.46(0.80-2.66) 0.22
when child put to breast
Not-immediately 6.37(4.65-8.73)*** <0.01 8.24(5.16-13.15)*** <0.01 Immediately Ref Ref Ref Ref plurality of birth
single Ref Ref Ref Ref
|
multiple |
5.58(3.52-8.86)*** |
<0.01 |
2.57(1.32-4.98)*** |
0.01 |
|
size of child at birth |
|
|
|
|
|
smaller than average |
2.60(1.85-3.66)*** |
<0.01 |
2.72(1.70-4.35)*** |
<0.01 |
|
average |
1.17(0.83-1.63) |
0.37 |
1.43(0.92-2.22) |
0.12 |
|
larger than average |
Ref |
Ref |
Ref |
Ref |
|
preceding birth interval (months) |
|
|
|
|
|
≥ 24 months |
Ref |
Ref |
Ref |
Ref |
|
18-23 months |
1.00(0.60-1.67) |
0.99 |
1.13(0.66-1.93) |
0.67 |
|
< 18 months |
1.92(1.14-3.25)** |
0.01 |
1.91(1.06-3.44)** |
0.03 |
*** p<.01, ** p<.05, * p<.1, COR: Crude Odd Ratio, AOR: Adjusted Odd ratio,
Table 3: Multivariate Analysis of Determinants of Under-Five Mortality in Rwanda
Discussion
The study aimed to identify determinants of under-five mortality (U5M) in Rwanda using the 2019/20 Rwanda Demographic and Health Survey (RDHS) data. Our findings reaffirmed the significance of various socioeconomic and healthcare factors influencing child mortality in Rwanda, aligning with previous studies both globally and regionally.
Rate of Under-five Child Mortality in Rwanda
Rwanda's under-5 mortality rate (U5MR) of 38 per 1000 live births is close to the global average of 37.7 per 1000 in 2019. Within sub- Saharan Africa, Rwanda's rate is relatively moderate, reflecting better performance compared to regional counterparts, particularly in Central Africa. However, it remains higher than in high-income countries, such as the United States (4.2 per 1000) and the United Kingdom (2.9 per 1000)1. Within East Africa, Rwanda's rate is also lower than that of Uganda (151.3 per 1000) and Kenya (52.29 per 1000) [11,12].
Regional disparities in U5MR within Rwanda were evident, with the Northern region experiencing the highest rate (44 deaths per 1,000 live births) and Kigali the lowest (27 deaths per 1,000 live births). These findings are consistent with studies identifying significant regional variations in child mortality across the globe, influenced by factors such as maternal education, poverty levels, birth size, and residence. For instance, studies in Zambia and Ethiopia have documented notable discrepancies in U5MR at the provincial and district levels, further emphasizing the need for targeted regional interventions [13,14,19].
Determinants of Under-five Child Mortality in Rwanda
Our study also found that children of working mothers had a significantly higher risk of mortality (AOR = 2.23, 95% CI: 1.25-3.95) compared to those of non-working mothers. This is consistent with existing literature, which suggests that maternal employment without sufficient support systems can reduce the time available for essential childcare practices, including breastfeeding [7]. Although maternal employment can improve household income, which may enhance access to healthcare and nutrition, the competing demands on working mothers can hinder optimal child- rearing practices, particularly in low-income settings [15].
Additionally, children born via non-cesarean delivery had a higher risk of mortality than those delivered by cesarean section (AOR = 1.84, 95% CI: 1.04-3.28). This highlights the importance of access to high-quality obstetric care, as cesarean sections can be life- saving in complicated deliveries [16]. The risks associated with non-cesarean deliveries may reflect disparities in the quality of care, particularly in rural areas where healthcare infrastructure is less robust.
Other significant determinants of under-five mortality in Rwanda included delayed breastfeeding initiation (AOR = 7.20, 95% CI: 4.93-12.72), multiple births (AOR = 2.19, 95% CI: 1.09-4.43), smaller-than-average birth size (AOR = 2.96, 95% CI: 1.83-4.78), and birth intervals shorter than 18 months (AOR = 1.91, 95% CI: 1.06-3.44). These factors are consistent with findings from other studies, highlighting the importance of improving maternal and child health practices, particularly in rural and low-income areas [17,18]. Also as Socioeconomic factors also played a critical role, with children from poorer households facing a higher risk of U5M compared to those from wealthier households (AOR = 1.58, 95% CI: 0.96-2.59). This association between poverty and child mortality has been well documented in both regional and global studies, where lower-income families often have limited access to healthcare, proper nutrition, and sanitation [11,9].
Strengths and Limitations of this Study
This study's strengths include using comprehensive, nationally representative data, ensuring generalizability and accurate population characteristics. Employing robust analytical methods, enhances the validity of the findings by controlling for potential confounders. Additionally, analyzing geographic disparities offers insights into regional variations, aiding targeted interventions and policy decisions. However, the study's cross-sectional design limits causal inferences, and potential reporting bias from self- reported data and unmeasured confounding variables may affect under-five mortality outcomes. The focus on specific determinants in the RDHS data may overlook other crucial factors, and variable constraints may limit analysis depth.
Conclusion
Under-five child mortality in Rwanda is associated with various social and proximate determinants such as Maternal occupation, Delivery mode, initiation of breastfeeding and Wealth index. Geographical disparities exist in under-five child mortality across different regions, with the northern region exhibiting the highest mortality rate. These findings underscore the need for targeted interventions and healthcare strategies to address these determinants effectively and reduce under-five mortality rates, particularly in regions with higher mortality burdens, such as the eastern region of Rwanda.
Acknowledgements
The authors are grateful to the Measure DHS, and ICF international, Rockville, Maryland, USA for providing the authorization to use Rwanda Demographic and health Survey (RDHS) data. Their support was invaluable for analysis.
References
- Sharrow, D., Hug, L., You, D., Alkema, L., Black, R., Cousens, S., ... & Walker, N. (2022). Global, regional, and national trends in under-5 mortality between 1990 and 2019 with scenario-based projections until 2030: a systematic analysis by the UN Inter-agency Group for Child Mortality Estimation. The Lancet Global Health, 10(2), e195-e206.
- World Health Organization. (2010). Nutrition Landscape Information System (f NLIS)f country profile indicators: interpretation guide.
- Rwanda, D. (2014). National Institute of Statistics of Rwanda (NISR)[Rwanda], Ministry of Health (MOH)[Rwanda], and ICF International. Rwanda Demographic Health Surv, 15.
- Musafili, A., Essén, B., Baribwira, C., Binagwaho, A., Persson,L. Å., & Selling, K. E. (2015). Trends and social differentials in child mortality in Rwanda 1990–2010: results from three demographic and health surveys. J Epidemiol Community Health, 69(9), 834-840.
- Eckert, E., Florey, L. S., Tongren, J. E., Salgado, S. R., Rukundo, A., Habimana, J. P., ... & Karema, C. (2017). Impact evaluation of malaria control interventions on morbidity and all-cause child mortality in Rwanda, 2000–2010. The American journal of tropical medicine and hygiene, 97(3 Suppl), 99.
- Mugeni, C., Levine, A. C., Munyaneza, R. M., Mulindahabi, E., Cockrell, H. C., Glavis-Bloom, J., ... & Binagwaho, A. (2014). Nationwide implementation of integrated community case management of childhood illness in Rwanda. GlobalHealth: Science and Practice, 2(3), 328-341.
- Amoroso, C. L., Nisingizwe, M. P., Rouleau, D., Thomson,D. R., Kagabo, D. M., Bucyana, T., ... & Ngabo, F. (2018). Next wave of interventions to reduce under-five mortality in Rwanda: a cross-sectional analysis of demographic and healthsurvey data. BMC pediatrics, 18, 1-11.
- Assembly, G. (2015). Sustainable development goals. SDGs transform our world, 2030(10.1186).
- Kibe, P. M., Mbuthia, G. W., Shikuku, D. N., Akoth, C., Oguta,J. O., Ng’ang’a, L., & Gatimu, S. M. (2022). Prevalence and factors associated with caesarean section in Rwanda: a trend analysis of Rwanda demographic and health survey 2000 to 2019–20. BMC pregnancy and childbirth, 22(1), 410.
- Mosley, W. H., & Chen, L. C. (1984). An analytical framework for the study of child survival in developing countries. Population and development review, 10, 25-45.
- Nasejje, J. B., Mwambi, H. G., & Achia, T. N. (2015). Understanding the determinants of under-five child mortality in Uganda including the estimation of unobserved household and community effects using both frequentist and Bayesian survival analysis approaches. BMC public health, 15, 1-12.
- Muriithi, D. M., & Muriithi, D. K. (2015). Determination of infant and child mortality in Kenya using cox-proportional hazard model. American Journal of Theoretical and Applied Statistics, 4(5), 404-413.
- Andegiorgish, A. K., Woldu, H. G., Elhoumed, M., Zhu, Z., & Zeng, L. (2022). Trends of under-five mortality and associated risk factors in Zambia: a multi survey analysis between 2007 and 2018. BMC pediatrics, 22(1), 341.
- Dedefo, M., Oljira, L., & Assefa, N. (2016). Small area clustering of under-five children's mortality and associated factors using geo-additive Bayesian discrete-time survival model in Kersa HDSS, Ethiopia. Spatial and spatio-temporal epidemiology, 16, 43-49.
- Forde, I. A., & Tripathi, V. (2022). Determinants of neonatal, post-neonatal and child mortality in Afghanistan using frailty models. Pediatric Research, 91(4), 991-1000.
- Gupta, N., Hirschhorn, L. R., Rwabukwisi, F. C., Drobac, P., Sayinzoga, F., Mugeni, C., ... & Amoroso, C. (2018). Causes of death and predictors of childhood mortality in Rwanda: a matched case-control study using verbal social autopsy. BMC public health, 18, 1-9.
- Yemane, G. D. (2022). Determinant factors of under-five mortality in rural Ethiopia. Annals of Medicine and Surgery, 81, 104371.
- Assadi R, Bedi N, Bell ML, et al. Mapping 123 million neonatal, infant and child deaths between 2000 and 2017. Nature. 2019;574(7778).
- Otieno O, Kosgei M, Owuor NO. Statistical Modelling and Evaluation of Determinants of Child Mortality in Nyanza, Kenya. Biomed Stat Inform. 2023;8(1):1.