


Research Article - (2024) Volume 8, Issue 1
Design and Psychometric Properties of a Scale to Assess the Most Important Drug Scene-Related Community Impact
2Social Welfare Management Research Center, University of Social Welfare and Rehabilitation Sciences, Iran
3University of Texas at Dallas, Richardson, TX, USA
Received Date: Feb 29, 2024 / Accepted Date: Mar 19, 2024 / Published Date: Apr 05, 2024
Copyright: ©Â©2024 S Eshrati, et al. This is an open-access article distributed under the terms of the Creative Commons Attribution License, which permits unrestricted use, distribution, and reproduction in any medium, provided the original author and source are credited.
Citation: Saberi Zafarghandi, M. B. , Eshrati, S., Roshanpajouh, M., Vameghi, M., Arezoomandan, R. (2024). Design and Psychometric Properties of a Scale to Assess the Most Important Drug Scene-Related Community Impact. J Addict Res, 8(1), 01-10.
Abstract
Background: The drug-scene-related community impacts include conditions, activities, and behaviors related to dealing/using drugs in public that hurt communities’ safety, stability, and integrity. This study aims to design and assess the psychometric properties of a scale to investigate the most important drug-scene-related community effects to prioritize interventions.
Methods: This study was a qualitative cross-sectional study conducted in three phases. In the first phase, according to the previous studies and literature review, the items pool was developed. In the second phase, the validity was assessed by face, content, and construct validity. Furthermore, to evaluate reliability, internal consistency and stability were calculated. In the third phase, the most important drug scene-related community impacts were investigated using the Friedman test.
Results: An initial 70-item version of the scale was generated. In the quantitative face validity assessment using item impact score, 4 items were omitted. After calculating the content validity ratio and index, 22 items remained. In the item analysis, 1 item was deleted. Exploratory factor analysis showed 5 factors that explained more than 65/63% of the variance. The most effective drug scene-related community impacts were the pull effect, exposure to major activities of the drug scene, environmental pollution, perception of unsafety, and lack of tranquility respectively.
Conclusion: The drug-scene-related community impacts scale is a valid and reliable scale with 21 items to assess drug-scene- related community impacts. The magnet of drug users/dealers to drug scenes and the notoriety of the neighborhood as a drug scene were the most effective drug-scene-related community impacts. Drug-scene-related community effects influence and reinforce each other because of multiple factors that are not only related to the personal behaviors of people who use drugs but also the societal structures.
Keywords
Community Impacts, Open Drug Scene, Sequential Exploratory Study
Introduction
When people congregate to deal with or use drugs in public spaces, this phenomenon is known as open drug scenes (ODSs) [1]. ODSs have variation in size, site, and visibility which in turn, there are three types of drug scenes namely disperse, concentrated, and hidden [2]. According to the study in Iran, there are three main drug scene types in Tehran (capital of Iran), including type one such as Farahzad, type two like Shush, and type three such as Kholazir which are different in terms of site, size, and structure [3]. In most countries, people who live/work around ODSs have issues with drug scene-related community impacts (DSRCIs) [4,5]. The main issues include drug use and dealing publicly, discarded paraphernalia in public, socializing in the ODSs, crimes, noise, perceived insecurity, and street-based income-generating activities [5-8].
Although individuals perceived the effects of drug scenes totally as an issue, the perceptions are heterogeneous [5]. The heterogeneity is affected by social perception, political discourse, and historical approaches to address drug issues in each society [7]. So, it is not easy to categorize nationally and internationally what all citizens consider to be community effects of drug scenes. In this study, we designed a Likert scale to conduct a survey achieving a more accurate picture of DSRCIs in a large sample size to prioritize these social effects and help stockholders to provide and improve the main interventions.
Materials and Methods
This study was a quantitative cross-sectional study that was conducted in three phases.
The First Phase: Development of the Scale
Design of the Study
In the first phase, the items pool was developed (70 items) using two previous studies. The qualitative study with the content analysis approach was run to explain the content of the problems that neighbors of drug scenes experienced [4,9]. A detailed literature review was performed to indicate the main indicators of drug scene-related community impacts [7].
The Qualitative Study
• Participants: The participants of the study were people who use drugs, and residents and business owners. The participants were primarily men (68%), over 40 years old with a mean age of 44.52 years, and mostly completed high school or post-high school education (60%), residing in the area for the past month or had practical experiences with drug scenes [4,9].
• Sampling: Purposive and snowball sampling methods were used. The participants who were in the drop-in centers or around drug scenes purposively were invited with a business card. Finally, people who use drugs (N = 9), residents (N = 9), and business owners (N = 7) participated in the study.
Procedure of the Study
In the study, the in-depth semi-structured interview guide was developed and progressively revised following each interview transcription and coded according to the findings of the previous interviews. The in-depth interviews continued until saturation when no data was added to the study. Field notes of each interview were also taken. The interviews were conducted by first author Sahar Eshrati who has a Ph.D. in addiction studies. She has worked as a psychologist in several inpatient and outpatient substance-use treatment clinics and has no relationship with the participants. The duration of each interview was between 45 and 90 min. Before the interview, a verbally informed consent was obtained. All interviews were audio recorded, transcribed, and coded. The rigor of the data was confirmed by asking the participants to review the findings to confirm the accuracy of their experiences.
Data Analysis
The data was analyzed using conventional content analysis based on Graneheim and Lundman’s method [10]. The MAXQDA version 10th was used to manage the data.
The Review Process
A systematic literature review was run using the search terms including (“drug-related crime” or “drug-related offense” “misconduct” or “social marginalization” [Mesh] “homeless drug users” or “drug-related street disorder” or “drug-related public nuisance” or “drug-related community impact”) and (“open drug scene”) in databases of PubMed, Scopus, Web of Science, and EMBASE. Furthermore, the references list of included studies was scanned [11].
Development of The Drug Scene-Related Community Impacts (DCRCIs) Scale
• Item Generation: The extracted items (70 items) were developed from a qualitative study and systematic review of the literature.
• Scoring: The scale was scored based on a 5-point Likert scale, scoring 1 to 5 for “completely disagree”, “disagree”, “no idea”, “agree” and “completely agree” options respectively.
Second Phase: Psychometric Assessment of the DCRCIs Scale
In the second phase, the validity was assessed by face, content, and construct validity. Furthermore, to evaluate reliability, internal consistency and stability were calculated.
Quantitative Face Validity Assessment
For quantitative assessment of face validity, the preliminary scale was evaluated by 21 key informants including; 6 harm reduction service providers, 2 representatives of municipality, 3 police officers, 2 managers of non-governmental organizations, and 8 residents and business owners/workers. These participants assessed the importance of the items by rating them on a 5-point Likert scale from “completely important” to “not at all important”. The item’s impact scores were calculated by the following formula:
Item impact score=frequency (percentage) × importance.
The items with an impact score of more than 1.5 were appropriate and remained for later stages [12].
Content Validity Assessment
The content validity of the scale was examined quantitatively by calculating the content validity ratio (CVR) and content validity index (CVI). The CVR was assessed by 14 key informants including 5 harm reduction service providers, 1 director of a non-governmental organization, 1 representative of a municipality, and 7 related academia. The experts scored the times according to a 3-point Likert scale (essential, useful but not essential, not essential). CVR was calculated through the formula of:
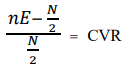
nE is the number of experts who chose the option “essential” and N is the total number of experts. Based on the table of Lawshe, a CVR higher than 0.51 for 14 participants indicates that the item is essential.
CVI was assessed by the same 14 experts through the formula of:
![]()
The participants score the items of the scale according to their “simplicity”, “relevance”, and “clarity” on a 4-point Likert scale from “not at all” to “completely”. The items with a CVI higher than 0/79 are suitable, between 0/79 and 0/70 need modification, and lower than 0/70 are unacceptable.
Item Analysis
In the item analysis, the internal consistency of scale as well as each item were assessed. The item was not acceptable in two conditions 1) The Total Internal Consistency of The Scale Increased Through Removing That Item and 2) The Correlation Coefficient of Each Item with The Scale Was Not Significant.
Construct validity assessment
• Design of the study: The construct validity of the scale was evaluated by exploratory factor analysis (EFA).
• Subjects: 218 key informants including PWUDs, treatment and municipality providers, residents, and business owners were recruited using the convenience method of sampling. The subjects lived in/around drug scenes for at least 6 months or had practical experiences with drug scenes.
• Sampling: The sample size for this section of the study was considered 10 samples for each item [13]. So, 218 key informants were recruited for the 21 items of the scale.
• Setting: The subjects of the study were recruited from areas that were neighbored by open drug scenes.
• Scale and Data Collection: The final DRCI scale following face and content validity assessments was used for data collection.
Data Analysis
To confirm the adequacy of the sample size for EFA, the Kaiser- Meyer-Alekin (KMO) test was measured. If the calculated KMO index is more than 0/6, the sample size for EFA was adequate [14]. To confirm the homoscedasticity for EFA, the Bartlett test was calculated. The p-value of the Bartlett test was less than 0.05 [13]. Then, the commonalities were calculated to examine the suitability of items for entering into a factor analysis. The items with commonalities of higher than 0.4 were selected for the analysis. Varimax rotation was used for factor analysis in this study. Varimax rotation aims to simplify the structure of factor analysis. The number of factors of the scale was extracted using the Eigenvalue of more than one, the percentage of explained variance by each component, and drawing the Scree plot.
Reliability Assessment
To confirm the reliability of the DRCI scale, internal consistency was evaluated using Cronbach’s alpha coefficient. The stability of the scale was assessed using the correlation coefficient of test-retest.
The Internal Consistency Assessment
The internal consistency and test-retest were calculated to confirm the reliability of the scale. The internal consistency was assessed through Cronbach’s alpha coefficient and the values more than 0/7 were acceptable [15].
Stability Assessment
The test-retest method was used to assess the stability of the DRCIs scale. To assess test-retest reliability, the scale was filled by 15 key informants with a 2-week interval and Pearson correlation scores of the two tests were calculated (P < 0.001).
Third Phase: The Friedman Test
In the third phase, the most important drug scene-related community impacts were investigated using the Friedman test. The SPSS-V.18 was used to perform all statistical analyses. A summary of steps for designing, assessment of psychometric properties of scale, and the most important factors of drug-scene-related community impacts are presented in Figure 1.
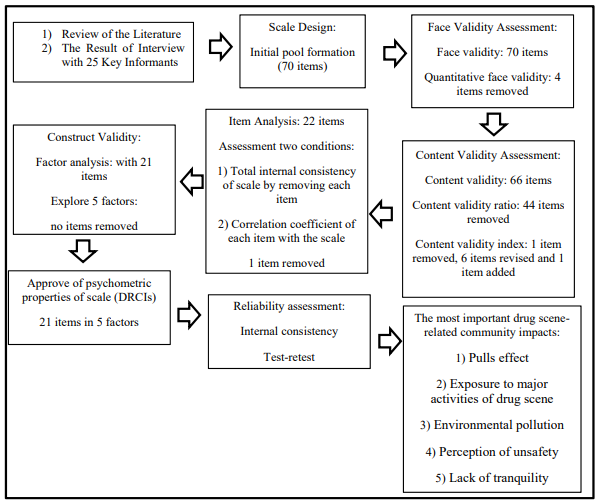
Figure 1: Process of Designing, Assessment of Psychometric Properties, and the Most Important of Factors of Drug Scene-Related Community Impacts (DSRCIs) Scale.
Results
The findings are presented in three phases: 1) Designing of DSRCIs Scale, 2) Assessing the Psychometric Properties of the DSRCIs Scale, and 3) Assessing the Most Important Drug Scene-Related Community Impacts.
Phase 1: Designing of The Scale
The extracted data from previous qualitative studies and literature reviews made the primary pool of the DSRCIs scale with 70 items [4,7]. The drug scene-related community impact is a tool that measures the effects of drug scenes in the communities. The effects of drug scenes range from using and dealing drugs in public, attracting new drug users/dealers to the community to disorder-based income-generating activities.
Phase 2: Assessment of Psychometric Properties of The DSRCI Scale
In this phase, face-, content, and construct validity and then the reliability of DSRCIs were assessed.
• Face Validity Assessment: In the quantitative face validity, the importance of each item was measured and the items with an impact score of more than 1.5 were maintained. In this step, 4 items were deleted.
• Content Validity Assessment: In the content validity ratio assessment, 44 items were deleted as they didn’t achieve a score of more than 0/51. In the content validity index assessment, 1 item was removed due to having a score lower than 0/70. 6 items were revised as they received a score between 0/70 and 0/79 and were not clear or relevant. In the qualitative content validity assessment, 1 item was added to the scale.
• Item Analysis: The total internal consistency of the scale with removing of each item was assessed. 1 item was deleted because the Alpha-Cronbach increased through removing this item. Also, the same item had no significant correlation coefficient with the rest items on the scale.
• Construct Validity Assessment: Characteristics of participants (n=218) were described in Table 1.
The construct validity DSRCIs scale was assessed by the EFA method. The calculated KMO index was 0/825 which showed sample adequacy for EFA. The calculated Bartlett test was 2383/151 with P < 0.001 which indicated the suitable correlation between items of scale for forming factors in EFA.
|
Characteristics |
Category |
Frequency |
Percent |
|
Age |
18-30 |
96 |
44 |
|
31-40 |
65 |
29/8 |
|
|
> 40 |
57 |
26/1 |
|
|
Gender |
Female |
101 |
46/3 |
|
Male |
117 |
53/8 |
|
|
Marriage status |
Married |
132 |
60/6 |
|
Single |
86 |
39/4 |
|
|
Income status |
Low income |
113 |
51/8 |
|
Moderate income |
97 |
44/5 |
|
|
High income |
8 |
3/7 |
|
|
Residency status |
Personal |
76 |
34/9 |
|
Rent |
92 |
42/2 |
|
|
Homeless |
50 |
22/9 |
|
|
Nationality |
Iranian |
164 |
75/2 |
|
Afghan |
54 |
24/8 |
|
|
Education |
Illiterate |
24 |
11 |
|
High school |
92 |
42/2 |
|
|
Diploma |
65 |
29/8 |
|
|
Undergraduate |
33 |
15/1 |
|
|
Graduate |
4 |
1/8 |
|
|
Distance from drug scene (km) |
1-20 |
185 |
84/86 |
|
21-40 |
27 |
12/38 |
|
|
41-60 |
6 |
2/76 |
|
|
Participants |
Local residents and business operators |
168 |
77/06 |
|
Member of drug scenes |
50 |
22/93 |
Table 1: Socio-Demographic Characteristics of Participants for Factor Analysis of DSRCIs Scale (n=218)
Then, commonalities calculations for items indicated that all items had correlation coefficients higher than 0/40 and no item omitted. The scree plot suggested 5 factors that became default for factor analysis (Figure 2).
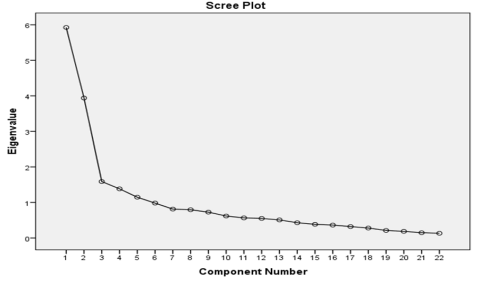
Figure 2: Scree Plot of The Exploratory Factor Analysis of The DSRCIs Scale
5 factors explained %63/561 of the cumulative variance of the DSRCIs scale with an eigenvalue of more than 1/1. After 6 times Varimax rotation, the items forming each factor were identified. Table 2 displays the result of the rotated factor matrix of the DS-RCIs scale. The first factor with items 13, 14, 15, 16, 20, and 21 is named “perception of unsafety” with loading factors more than 0/70. The second factor with items 1, 2, 3, 5, 6, and 7 named as “exposure to major activities of drug scene” with a loading factor more than 0/50.
|
Factors |
2 |
3 |
4 |
5 |
6 |
7 |
8 |
9 |
10 |
11 |
12 |
13 |
14 |
15 |
16 |
17 |
18 |
19 |
20 |
21 |
|
|
1 |
|
|
|
|
|
|
|
|
|
|
|
|
0/74 |
0/79 |
0/83 |
0/81 |
|
|
|
0/86 |
0/84 |
|
2 |
0/81 |
0/70 |
0/81 |
|
0/58 |
0/61 |
0/72 |
|
|
|
|
|
|
|
|
|
|
|
|
|
|
|
3 |
|
|
|
|
|
|
|
|
|
0/60 |
0/87 |
0/72 |
|
|
|
|
|
|
|
|
|
|
4 |
|
|
|
0/64 |
|
|
|
0/55 |
0/77 |
|
|
|
|
|
|
|
|
|
|
|
|
|
5 |
|
|
|
|
|
|
|
|
|
|
|
|
|
|
|
|
0/58 |
0/72 |
0/63 |
|
|
Table 2: Rotated Factor Matrix of The DSRCIs
The third factor with items 10, 11, and 12 were named “environmental pollution” with loading factors more than 0/60. The fourth factor with items 4, 8, and 9 named “pulls effect” with a loading factor more than 0/50. The last factor with items 17, 18, and 19 were named “lack of tranquility” with loading factors more than 0/50. In this step, 21 items were used to measure the self-reported impacts of drug scenes on the daily lives of the residents and business operators. For each item, participants were asked to report their attitudes about the impacts of drug scenes in the neighborhood with options ranging from completely disagree to completely agree [1,5]. Table 3 shows that more than 70% of participants completely agreed about the impacts of drug scenes in the neighborhood due to less distance (1-20km) of participants (around 85%) from the drug scenes. Unsurprisingly, only for the item of sex work trade, half of the respondents disagreed and completely disagreed about its effect in the neighborhood due to possibly the lower proportion of female-to-male presence in the drug scene [7].
|
|
Items are about the possible impacts of drug scenes in the neighborhood. What do you think about each item? |
Attitude |
||||
|
Completely disagree |
Disagree |
Don’t know |
Agree |
Completely agree |
||
|
1. |
Exposure to drug use in drug scene |
2(.9) |
17(7.8) |
11 (5) |
43(19.7) |
145(66.5) |
|
2. |
Exposure to drug use around the drug scene |
3(1.4) |
12(5.5) |
10(4.6) |
59(27.1) |
134(61.5) |
|
3. |
socializing of people who use drugs in drug scene |
2(.9) |
16(7.3) |
10(4.6) |
46(21.1) |
144(66.1) |
|
4. |
Frequenting of people who use drugs in/around drug scene |
0 |
6(2.8) |
7(3.2) |
37(17) |
168(77.1) |
|
5. |
Dealing of drugs around drug scene |
3(1.4) |
12(5.5) |
21(9.6) |
43(19.7) |
139(63.8) |
|
6. |
Reputation of neighborhood in dealing drugs |
2(.9) |
4(1.8) |
16(7.3) |
56(25.7) |
140(64.2) |
|
7. |
Presence of a gang of dealers in drug scene |
2(.9) |
8(3.7) |
55(25.2) |
43(19.7) |
110(50.5) |
|
8. |
Drawing attention of other people who use drugs to the neighborhood |
4(1.8) |
9(4.1) |
19(8.7) |
42(19.3) |
144(66.1) |
|
9. |
Stigmatizing of the neighborhood as a drug scene |
2(.9) |
9(4.1) |
9(4.1) |
37(17) |
161(73.9) |
|
10. |
Disposal of garbage in the neighborhood |
0 |
2(.9) |
9(4.1) |
41(18.8) |
166(76.1) |
|
11. |
Exposure to paraphernalia such as foil in the neighborhood |
5(2.3) |
10(4.6) |
27(12.4) |
49(22.5) |
127(58.3) |
|
12. |
Exposure to used syringes in the neighborhood |
2(.9) |
6(2.8) |
28(12.8) |
72(33) |
110(50.5) |
|
13. |
Perceived of unsafety by children of the neighborhood |
8(3.7) |
13(6) |
21(9.6) |
56(25.7) |
120(55) |
|
14. |
Perceived of unsafety for walking in the alleys of the neighborhood |
7(3.2) |
18(8.3) |
18(8.3) |
38(17.4) |
137(62.8) |
|
15. |
Perceived of unsafety by local residents |
12(5.5) |
24(11) |
15(6.9) |
41(18.8) |
126(57.8) |
|
16. |
Worries of some residents about kidnapping in the neighborhood |
14(6.4) |
24(11) |
19(8.7) |
39(17.9) |
122(56) |
|
17. |
Lack of tranquility in the neighborhood due to fighting and shouting |
18(8.3) |
16(7.3) |
23(10.6) |
45(20.6) |
116(53.2) |
|
18. |
Exposure to noises of drug scene members at midnights |
15(6.9) |
23(10.6) |
37(17) |
56(25.7) |
87(39.9) |
|
19. |
Sex work trade (to buy drug) |
16(7.3) |
33(15.1) |
43(19.7) |
57(26.1) |
69(31.7) |
|
20. |
Exchange of stolen goods in the drug scene |
6(2.8) |
18(8.3) |
48(22) |
46(21.1) |
100(45.9) |
|
21. |
Car break-in |
26(11.9) |
13(6) |
28(12.8) |
46(21.1) |
105(48.2) |
Table 3: Frequency (Percent Frequency) of Items Included in Drug Scene-Related Community Impacts Scale
Reliability
To assess reliability, both internal consistency and the test-retest method of the DSRCIs scale were computed. Internal consistency of the DSRCIs scale was confirmed by Cronbach α at 0/85, 0/83, 0/72, 0/70, 0/71, and 0/92 for the perceived unsafety, exposure to main activities of the drug scene, lack of tranquility, pull effect, and environmental pollution factors and whole scale respectively. Using the test-retest method, the Pearson correlation coefficient of the whole scale was reported as 0/86 with P < 0.001.
Phase 3: The Most Important Drug Scene-Related Community Impacts
The most important DSRCIs were assessed by the Freidman test (Table 3, 4).
|
Number |
218 |
|
Chi-square statistics of Friedman test |
134/959 |
|
Degree of freedom |
4 |
|
The significance level |
0/0001 |
Table 4: Friedman Test
Table 2 displays the value of Chi-square 134/959 with 4 degrees of freedom and a significant level of 0.000. Due to the P-value that is less than 0.05, there are differences between different factors of drug-scene-related community impacts in the key informants’ perspective.
|
Factors |
Number |
Mean |
Standard Deviation |
Average Rating |
|
pulls effect |
218 |
4/56 |
0/60 |
3/70 |
|
exposure to major activities of the drug scene |
218 |
4/38 |
0/67 |
3/26 |
|
environmental pollution |
218 |
4/27 |
0/78 |
3/08 |
|
perception of unsafety |
218 |
4/04 |
1/09 |
2/77 |
|
lack of tranquility |
218 |
3/79 |
0/93 |
2/19 |
Table 5: Ranking Table
According to the ranking report (table 3), the pull effect, exposure to major activities aof the drug scene, environmental pollution, perception of unsafety, and lack of tranquility were the most social effects related to drug scenes respectively.
Discussion
According to the results of the literature review and qualitative study, a valid and reliable scale about the social effects related to drug scenes was developed [7,9]. The result of exploratory factors analysis indicated that the drug scene-related community impacts scale with a significant five factors, explaining more than 60% of the cumulative variance and the loading factors more than 0.5, was a valid scale for measuring community impacts related to drug scenes. The scale can measure and rank the most important social effects related to drug scenes in a larger population of key informants to address the main causes of complaints of residents and business owners/operators to governmental authorities.
The most important social effects related to the drug scene were the pull effect, exposure to major activities of the drug scene, environmental pollution, perception of unsafety, and lack of tranquility respectively. Pull effects with a first ranking in the drug scene-related social impacts include draw the attention of other people who use drugs in the neighborhood, frequenting people who use drugs in/around the drug scene, and stigmatizing the neighborhood as a drug scene. One of the issues in neighborhoods with concentrated drug scenes is drawing the attention of people who use drugs from another part of the city due to the availability of drugs and the place for using drugs there [1]. These scenes are widely known to residents and business operators [6]. Drug scenes mostly are in areas where low-price residency, homelessness, and lack of proper sanitation are common [7,16,17]. The informal nature and lack of sanitation of drug scenes and perceived unsafety and committing some illegal behaviors reduce the quality of life of local inhabitants and workers [18-20]. Studies indicated that consumption rooms and relocating drug scenes to a tolerable area may improve the coexistence of PWUDs with other residents [5].
Using and dealing drugs in open drug scenes and socializing with residents of drug scenes were other important factors that were noticed as main activities in drug scenes. These activities were studied in several researches [21-24]. For example, one aim of providing services like supervised consumption rooms and prescribed injectable diacetylmorphine for long-term, treatment-refractory opioid users is reducing the rates of illicit drug use in the public and helping prevent the emergence of an open drug scene [25,26]. Injection of illicit drugs is common among homeless people who live in slums. Using drugs as a distractor likely improves the rough sleeping and dealing with cold weather [8,22,27]. Drug scenes are available choices to use drugs due to strong cravings and lack of alternative locations for drug use [28,29].
Environmental pollution with the third rank includes the disposal of drug paraphernalia such as syringes and aluminum foil as well as garbage. The residents reported a serious concern about improperly discarded syringes to put them at elevated risk for blood-borne viruses [30]. Regular cleaning of the neighborhood, needle and syringe programs, and sometimes supervised consumption rooms are services that help decrease the discarded drug paraphernalia in the neighborhood [25,31,32]. Despite the evidenced benefits of providing supervised drug consumption facilities, these facilities are mostly established in some European countries and Canada. In most societies, legal considerations, stigma, and social norms are impeding of establishing these facilities [33,34].
According to the studies, collecting recyclable goods from street bins is a source of income-generating activity among PWUDs [35,36]. The formal requirements for the workplace contain a drug-free and regular work schedule. These requirements contribute to street-based income generation practices among homeless PWUDs [7]. Studies indicated that enrollment in substitution treatment is associated with reduced engagement in disorderly income sources due to decreased dependency and the need to buy drugs. Also, there is a high demand for ceasing engagement in these activities if opportunities for alternative casual low-threshold employment are available [6,26].
The fourth rank was perceived as unsafety. Consistent with several studies, perceived unsafety refers to a wide range of inconvenient behaviors linked either to a crime such as car break-in and exchange of stolen goods, or to less explicit social norms and values such as worries of residents about kidnapping and walking in the alleys of the neighborhood [37]. Some instances of perceived concerns of residents are unique to this study. For example, fear of child abduction and fear of being attacked by PWUDs are perceived as likely due to concentrating drug scenes in disadvantaged areas of societies where disturbing behaviors, poverty, homelessness, and mental illness are common [7,9]. Also, the perceived concerns are partly influenced by the varied levels of tolerance in society as a whole. Therefore, depending on the viewpoint taken, certain issues may be considered as a cause of public unsafety or as a tolerable situation that needs support [5]. In a survey, two-thirds of participants were positive toward drug scenes compared to less than one-third were negative attitudes toward drug scenes [5]. In a qualitative study, Iranian participants articulated the ambiguous view pointing to not feeling convenient from drug scene-related activities, while confirming the human rights of actors in drug scenes and providing proper interventions [9].
The last factor was a lack of tranquility due to noise exposure, fighting, and shouting especially at midnight, and exposure to the sex work trade to earn money and drugs. The results are consistent with studies indicating aggression, loud behavior, and street harassment as drug-related public nuisance [7,38,39]. Illicit drug market violence is linked with drug-induced psychosis, gaining or maintaining market share, financial conflicts, and drug-related debt [40,41]. The sex work trade is considered a disorderly street-based income generation source to gain money and drugs. Studies showed that people who are engaged in the sex trade were most willing to give up their illegal source of income due to health and social harms related to these activities such as violence [6,35].
Despite the advantages of the scale, using the scale has some limitations. Some items possibly are not suitable for other societies or change in the future. Although the aim of the study was not to assess the dynamics of social effects of drug scenes during time, it is suggested to give feedback about the items of scale and revise it in future studies. Accordingly, changes in the community impacts of drug scenes over time and different societies will be investigated. Another limitation of the study was a reduction of social effects of drug scenes to some items to design a scale. With attention to the aim of the study to assess the most important social impacts of drug scenes in a greater sample, the scale was developed. The main limitation of the study was that asking directly about the negative impacts of drug scenes can induce key informants that the drug scenes have negative impacts. However, the researchers tried to ask open-ended questions about the social effects of drug scenes. In the end, some key informants avoided participating in the study. Considering that the purpose of the study was to prioritize the drug scene-related social impacts, the perspectives of these people were not included in the research.
Conclusion
DSRCIs scale is a valid and reliable tool with five factors to assess the most important social effects of drug scenes by a five level Likert scale. Drawing attention of drug dealers and users and turning the neighborhood to drug scenes was the most important community effects of drug scenes. Furthermore, exposure to drug dealing and using in drug scenes and perceived unsafety and hence, effects of drug scenes in quality of life and business of local residents and business operators were important.
The community effects of drug scenes can influence and reinforce each other. PWUDs encounter some barriers in access to housing facilities due to their economic issues and the level of tolerance of homeowners. Consequently, these people moved to informal areas and loitered frequently in disadvantaged areas. Also, PWUDs used drugs in the drug scenes due to homelessness, lack of access to alternative places, simply accessible of drugs and strong urges. Drug use in the public view is responsible for the disposal of paraphernalia as a result of lacking alternative safe drug-taking spaces. The requirements for workplace including drug free and regular work schedule contribute to street-based income generation practices among homeless PWUDs. Socializing, loitering and existence of members of drug scenes make the local residents inconvenient because of pulling other drug users/dealers, and illegal activities. Therefore, beside individual behaviors, the societal structures are involved in the social effects of drug scenes.
Removing the drug scenes is almost impossible as long as societal structures reinforce these scenes. Exclusive law enforcement interventions displace the drug scenes to another geographical area. So, evidence-based health interventions can reduce the costs of intuitive interventions. By determining the priority of interventions in the community, the governments require to change the informal drug places to areas where have legal license and support to provide health and harm reduction services.
Statement of Ethics
Ethics and dissemination Ethical approval for the study was obtained from the Ethics Committee of Iran University of Medical Sciences, Iran (IR-IUMS.REC.1397.278). Additionally, participants were provided verbal informed consent. To protect the privacy of the participants, each of them was given a code number to keep their identity anonymous. The participants could also discontinue the study at any point.
Funding
The article is part of a study funded by the Iran University of Medical Sciences (98-2-50-15287).
Author Contributions
MB Saberi Zafarghandi, M Vameghi, S Eshrati, project development, concept and study design; R Arezoomandan, M Roshanpajouh, supervisor; S Eshrati, data collection; S Eshrati, MB Saberi Zafarghandi, M Vameghi, data analysis and data management. All authors read, edited, revised, and approved the final manuscript.
Acknowledgment
The authors thank all key informants including people who use drugs, outreach workers, directors of Naft and Farahzad Neighborhood House for the municipality, police of the war on drugs especially Research Office, director and clients of the non-governmental organization of Mehr-O-Mah, Talieh Mehre Yazdan and Nasim Mehr Afarin Drop-in Centers, and residents and business operators of Naft and Farahzad neighborhood for collaboration in interviews, conducting the research and increasing the validity of the findings.
Data Availability Statement
All data generated or analyzed during this study are included in this article. Further inquiries can be directed to the corresponding author.
References
- Bless, R., Korf, D. J., & Freeman, M. (1995). Open drug scenes: A cross-national comparison of concepts and urban strategies. European Addiction Research, 1(3), 128-138.
- Zafarghandi, M. B. S., Eshrati, S., Vameghi, M., Ranjbar, H., Arezoomandan, R., Clausen, T., & Waal, H. (2019). Drug-related community issues and the required interventions in open drug scenes in Tehran, Iran: a qualitative study protocol. BMJ open, 9(10), e030488.
- Maarefvand, M., Shirazi, M. S., Peyravi, R., & Farhoudian,A. (2017). Typology of street substance users’ communities in Tehran, Iran. Addiction & Health, 9(1), 32.
- Eshrati, S., Saberizafarghandi, M., Vameghi, M., Arezoomandan, R., Ranjbar, H., Clausen, T., & Waal, H. (2023). Main problems experienced by the neighbors of open drug scenes, Tehran, Iran: a mixed-method study. Harm Reduction Journal, 20(1), 148.
- Bancroft, M., & Houborg, E. (2020). Managing coexistence: resident experiences of the open drug scene and drug consumption rooms in inner Vesterbro, Copenhagen. Contemporary drug problems, 47(3), 210-230.
- DeBeck, K., Wood, E., Qi, J., Fu, E., McArthur, D., Montaner, J., & Kerr, T. (2011). Interest in low-threshold employment among people who inject illicit drugs: implications for street disorder. International Journal of Drug Policy, 22(5), 376-384.
- Saberi Zafarghandi, M. B., Eshrati, S., Rashedi, V., Vameghi, M., Arezoomandan, R., Clausen, T., & Waal, H. (2022). Indicators of drug-related community impacts of open drug scenes: a scoping review. European Addiction Research, 28(2), 87-102.
- DeBeck, K., Wood, E., Qi, J., Fu, E., McArthur, D., Montaner, J., & Kerr, T. (2012). Socializing in an open drug scene: the relationship between access to private space and drug-related street disorder. Drug and alcohol dependence, 120(1-3), 28-34.
- Eshrati, S., Saberizafarghandi, M., Vameghi, M., Arezoomandan, R., Ranjbar, H., Clausen, T., & Waal, H. (2023). Main problems experienced by the neighbors of open drug scenes, Tehran, Iran: a mixed-method study. Harm Reduction Journal, 20(1), 148.
- Graneheim, U. H., & Lundman, B. (2004). Qualitative content analysis in nursing research: concepts, procedures and measures to achieve trustworthiness. Nurse education today, 24(2), 105-112.
- Schlosser, R. W., Wendt, O., Bhavnani, S., & Nailâ?ÂÂChiwetalu,B. (2006). Use of informationâ?ÂÂseeking strategies for developing systematic reviews and engaging in evidenceâ?ÂÂbased practice: the application of traditional and comprehensive Pearl Growing. A review. International journal of language & communication disorders, 41(5), 567-582.
- Lawshe, C. H. (1975). A quantitative approach to content validity. Personnel psychology, 28(4), 563-575.
- Plichta SB, Kelvin EA. Munro’s statistical methods for health care research. 2013.
- Tabachnic B, Fidell LS. Using multivariate statistics: Allyn and Bacon; 2000.
- Fink, A., & Litwin, M. S. (1995). How to measure survey reliability and validity (Vol. 7). Sage.
- DeBeck, K. (2010). Drug-related street disorder: evidence for public policy responses (Doctoral dissertation, University of British Columbia).
- Fahey, T. (Ed.). (1999). Social housing in Ireland: a study of success, failure, and lessons learned (No. 28). Combat Poverty Agency.
- Small, W., Rhodes, T., Wood, E., & Kerr, T. (2007). Public injection settings in Vancouver: physical environment, social context and risk. International Journal of Drug Policy, 18(1), 27-36.
- Cusick, L., & Kimber, J. (2007). Public perceptions of public drug use in four UK urban sites. International Journal of Drug Policy, 18(1), 10-17.
- Payne, B. K., & Gainey, R. R. (2007). Attitudes about the police and neighborhood safety in disadvantaged neighborhoods: The influence of criminal victimization and perceptions of a drug problem. Criminal Justice Review, 32(2), 142-155.
- Stevenson, B. (2010). Research into the nature and size of public drug injecting in Glasgow city. Glasgow: NHS Greater Glasgow and Clyde.
- Van Hout, M. C., & Bingham, T. (2013). Open drug scenes and drug-related public nuisance: a visual rapid assessment research study in Dublin, Ireland. Journal of Ethnicity in Substance Abuse, 12(2), 154-178.
- Grâ?? nnestad, T. E., & Lalander, P. (2015). The Bench: An open drug scene and its people. Nordic Studies on Alcohol and Drugs, 32(2), 165-182.
- Ghiabi, M. (2019). Drugs politics: Managing disorder in the Islamic Republic of Iran (p. 366). Cambridge University Press.
- Roque Camacho, M. E. (2022). Drug consumption rooms: an overview of provision and evidence. Medicina y ética, 33(4), 1167-1178.
- Strang, J., Groshkova, T., Uchtenhagen, A., Van Den Brink, W., Haasen, C., Schechter, M. T., ... & Metrebian, N. (2015). Heroin on trial: systematic review and meta-analysis of randomised trials of diamorphine-prescribing as treatment for refractory heroin addiction. The British Journal of Psychiatry, 207(1), 5-14.
- Neale, J., Tompkins, C., & Sheard, L. (2008). Barriers to accessing generic health and social care services: a qualitative study of injecting drug users. Health & social care in the community, 16(2), 147-154.
- Sweeney, S., Ward, Z., Platt, L., Guinness, L., Hickman, M., Hope, V., ... & Vickerman, P. (2019). Evaluating the costâ?ÂÂeffectiveness of existing needle and syringe programmes in preventing hepatitis C transmission in people who inject drugs. Addiction, 114(3), 560-570.
- de la Fuente, L., Bravo, M. J., Toro, C., Brugal, M. T., Barrio, G., Soriano, V., ... & Ballesta, R. (2006). Injecting and HIV prevalence among young heroin users in three Spanish cities and their association with the delayed implementation of harm reduction programmes. Journal of Epidemiology & Community Health, 60(6), 537-542.
- Green, T., Hankins, C., Palmer, D., Boivin, J. F., & Platt, R. (2003). Ascertaining the need for a supervised injecting facility (SIF): The burden of public injecting in Montreal, Canada. Journal of Drug Issues, 33(3), 713-731.
- Pedersen, E. R., Tucker, J. S., & Kovalchik, S. A. (2016). Facilitators and barriers of drop-in center use among homeless youth. Journal of Adolescent Health, 59(2), 144-153.
- Bardwell, G., Strike, C., Altenberg, J., Barnaby, L., & Kerr, T. (2019). Implementation contexts and the impact of policing on access to supervised consumption services in Toronto, Canada: a qualitative comparative analysis. Harm Reduction Journal, 16, 1-9.
- Rhodes, T., & Hedrich, D. (2010). Harm Reduction: Evidence, Impacts, and Challenges.
- Pfadenhauer, L. M., Gerhardus, A., Mozygemba, K., Lysdahl,K. B., Booth, A., Hofmann, B., ... & Rehfuess, E. (2017). Making sense of complexity in context and implementation: the Context and Implementation of Complex Interventions (CICI) framework. Implementation science, 12, 1-17.
- DeBeck, K., Shannon, K., Wood, E., Li, K., Montaner, J., & Kerr, T. (2007). Income generating activities of people who inject drugs. Drug and alcohol dependence, 91(1), 50-56.
- DeBeck, K., Small, W., Wood, E., Li, K., Montaner, J., & Kerr, T. (2009). Public injecting among a cohort of injecting drug users in Vancouver, Canada. Journal of Epidemiology & Community Health, 63(1), 81-86.
- Waal, H. (2010). Comparative overview of public nuisance features with regard to open drug scenes and different approaches taken by European Countries to address them (Paper prepared to Pomidou group meeting Strasbourg November 18th-19th 2004). SERAF rapport 2004, 8.
- Cleirec, G., Fortias, M., Bloch, V., Clergue-Duval, V., Bellivier, F., Dusouchet, T., ... & Vorspan, F. (2018). Opinion of health professionals and drug users before the forthcoming opening of the first drug consumption room in Paris: a quantitative cross-sectional study. Harm reduction journal, 15, 1-11.
- Prepeliczay, S., & Schmidt-Semisch, H. (2021). Tolerance zones: a pragmatic approach to respond to problems related to open alcohol and drug scenes in Bremen/Germany. Drugs and Alcohol Today, 21(3), 225-235.
- Werb, D., Rowell, G., Guyatt, G., Kerr, T., Montaner, J., & Wood, E. (2011). Effect of drug law enforcement on drug market violence: A systematic review. International Journal of Drug Policy, 22(2), 87-94.
- Martin, I., Palepu, A., Wood, E., Li, K., Montaner, J., & Kerr,T. (2008). Violence among street-involved youth: The role of methamphetamine. European addiction research, 15(1), 32-38.