
International Journal of Forensic Research(IJFR)
ISSN: 2767-2972 | DOI: 10.33140/IJFR
Impact Factor: 1.9

Research Article - (2025) Volume 6, Issue 2
Design and Economical Analysis of a Battery-less AC - Photovoltaic Driven Pumping System for Irrigation in Ethiopia
Received Date: May 29, 2025 / Accepted Date: Jun 27, 2025 / Published Date: Jul 30, 2025
Copyright: ©©2025 Zelalem Nega Temsgen, et al. This is an open-access article distributed under the terms of the Creative Commons Attribution License, which permits unrestricted use, distribution, and reproduction in any medium, provided the original author and source are credited.
Citation: Temsgen, Z. N., Jiufa, C. (2025). Design and Economical Analysis of a Battery-less AC - Photovoltaic Driven Pumping System for Irrigation in Ethiopia. In J Fore Res, 6(2), 01-14.
Abstract
This paper presents the design and simulation of a solar Photovoltaic driven pumping system to irrigate a 10-hectare maize farm located at Ethiopia, Debre Markos, Wonka site. The system pumps 82 m3 of water from a nearby river to irrigate 10-hectare land. In Ethiopia, around 85% of population lives in rural areas and their economy depend on seasonal rain-based farming. Most people use hand-fitted pumps and diesel-powered irrigation systems. This causes high maintenance costs, unreliable supply of fuel, requires excess labor and despair of the system due to low flow rates. The proposed system is directly facing to solve the above problems and increase the profitability of the farmers. A life cycle analysis of the operating cost was performed to prove its economic feasibility compared to a diesel-based pumping system. System simulation and design were done using MATLAB/Simulink. The obtained results show that the solar PV driven pumping system for irrigation is more economical and environmentally feasible than a diesel-powered system. The results of this study are expected to motivate and inspire the use of solar PV pumping systems in agriculture in remote areas of Ethiopia and avoid seasonal farming that is, extend the farming period and increase farmers’ income.
Keywords
Solar Photovoltaics, Water Pumping, System Simulation, System Sizing, Economic Feasibility, Environmental Benefits
Introduction
Energy is one of the key points to the development of a country. In Ethiopia, modern energies covered 8.4% and traditional biomass 91.6% of the total primary energy supply in 2005 [1]. High reliance on traditional energy resources has a strong influence on the overall economic progress of the country.
The solar photovoltaic driven irrigation technologies have considerably advanced in the past decade supported by the evolution of higher efficiency, low cost photovoltaic (PV) panels. The technology has come to break up a diesel-based irrigation system in terms of reducing greenhouse gasses and a payback period of the system [2]. Agriculture in Ethiopia is dominated by smallholder seasonal rain fed systems but low and unpredictable rain limits productivity and food security. Therefore, renewable energy is the best solution for rural areas of Ethiopia far from an electric grid. A solar-PV driven pumping system for irrigation consists of photovoltaic panels that generate a direct current (DC) when exposed to sunlight. The DC current is collected at the output of the solar panel and is applied to a DC motor that drives the pump or inverter that supplies an AC motor for the pump, depending on the type of pumping system design [3]. Older DC motor driven PV pump systems suffered from increased motor cost and maintenance problems due to the presence of a commutator and brushes and that is why modern DC motor driven pumping systems are based on brushless permanent magnet DC motors. However, this solution is limited to low-power PV systems. A PV pumping system based on an induction motor offers an alternative configuration for more reliable and maintenance-free systems. The main advantages of induction motors are reduced unit cost, ruggedness, brushless rotor construction, and ease of maintenance [4]. Therefore, in this study a battery-less AC motor pumping system is considered. Figure 1 shows the block diagram of the studied solar PV driven pumping system for irrigation.

Figure 1: Solar Pumping System Block Diagram
Proposed System
The proposed solar PV driven pumping system for irrigation is a system that provides water from the river and reservoirs for use in farming. Such system consists of solar PV modules, a maximum power point tracker (MPPT), a DC to DC boost converter and an inverter to directly drive the pump. A battery is not considered in the design of the system. The disadvantage of using battery storage is that it requires a complicated control system and increases the total investment cost [5]. Considering one cloudy day and night time irrigation, the tank storage was designed to store extra water for one day. The capacity of a solar-driven pumping system for irrigation depends on pump head, flow rate, pump power, and farm area to be irrigated [6]. In this study, a medium-scale solar driven pumping system for irrigation has been designed for a farm of an area of ten hectares located in Debre Markos, Wonka, Ethiopia. The design phase is considered based on the parameters such as pump power rating, amount of solar insolation and running hours of pump. The layout of such proposed solar PV driven pumping system for irrigation is shown in Figure 2.

Figure 2: Proposed System Schematic Diagram
Methodology
The system design method began with the collection of detailed weather data for the selected study site, including air temperature and solar insolation. Levels of solar irradiation at the selected site were carefully studied, calculated and processed by the program RET Screen Expert. The design of the system mainly includes required water demand determination, required power calculation, sizing of photovoltaic array, pump sizing, system simulation,and life cycle cost analysis. The pump is chosen according to the required power, total dynamic head, and flow rate. The sizing process was started through the estimation of water demand for the system. Furthermore, after sizing all the components the entire system was simulated using MATLAB/ Simulink software. Feasibility analysis is carried out and compared to the alternative diesel pumping systems. Overall system feasibility under economic evaluation can be elaborated in terms of life cycle operating cost analysis. The environmental advantage of the solar driven pumping system for irrigation is assessed in terms of CO2 emissions reduction during its entire lifetime by comparing it with an equivalent diesel-powered system.
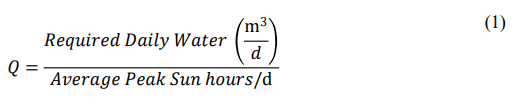
The design flow rate (Q) for the pump can be determined by dividing the daily water needs of operation by the number of peak sun hours per day.
The most critical part of the system is the calculation of the total dynamic head. It is determined by considering friction head loss, relative roughness and head loss for each pipe, Reynolds number and friction factor. The head loss occurs with the aid of friction, which is the sum of the friction losses of all pipe materials in the system. Friction head loss for fitting is calculated using the Darcy- Weisbach formula as listed in the equation below [7].
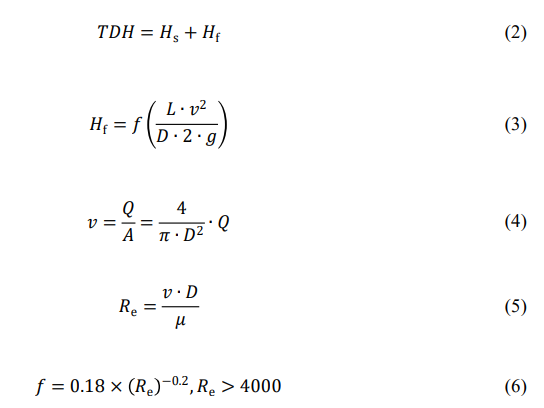
Where, THD is Total Dynamic Head (m), Hs is static head (m), Hf is the friction head loss inside the pipe (m), f is friction factor (-), v is the velocity of water (m/s), L is length of pipe (m), D is the pipe diameter (m), Q is flow rate (m3/s), the dynamic viscosity of water at temperature at 20 oC (mPa.s), R is the Reynolds number (-).
A MATLAB/ Simulink based model for solar PV array was built based on equations (7-11) below using a single diode model because of its simplicity and accuracy. The equivalent circuit of a solar cell using a single diode module is shown in Figure 3
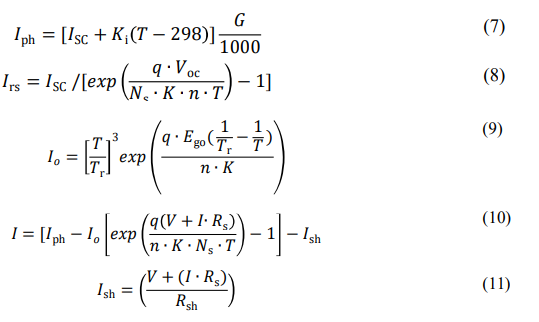
Where, Iph is the photocurrent, (A), ISC is the short circuit current (A), Ki 2 is short circuit current of the PV cell at 25 oC and 1000 W/m ,Irs is the reverse saturation current (A), T is the operating temperature (K),G is the irradiance (W/m2), q is the electron charge (C), Voc is the open circuit voltage (V), Ns is the number of series connected cells, K is Boltzmann’s Constant (1.3E10-23) (J/K), n the ideality factor (-), Io is the saturation current (A), Tr is the nominal temperature (K), Ego is the band gap energy of semiconductor (1.1) (ev), I is output current (A), Rs is a series resistor(Ω), Ish is the shunt current (A), Rsh is the shunt resistor (Ω).

Figure 3: The Equivalent Circuit of Solar Cell
A Boost converter is used in photovoltaic systems to convert the fluctuating DC voltage from the photovoltaics into a steady output DC voltage and isolate the input source of an inverter. The voltage of PV at MPP is 447.6 V and the input DC link voltage for the three-phase inverter is required to be 800 V. Therefore, the boost converter helps to boost and create voltage suitable for the inverter. The duty cycle (0.44) can be calculated using equation (12). Thus, the converter output voltage is directly related to the duty cycle.Boost converter was designed using MATLAB/Simulink based on equations (12-14) below
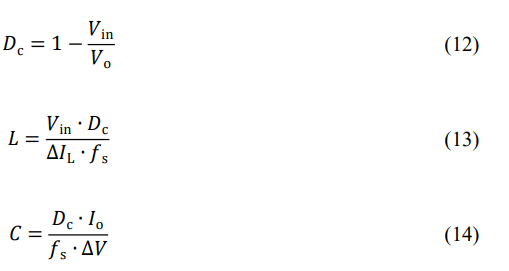
Where, Dc is the duty cycle, Vin is the input voltage (V), Vo is the desired output voltage (V), L is the inductor inductance (mH), ΔIL is the ripple current (10% of Io ) (A), C is the capacitor capacitance (µf), ΔV is the ripple voltage (V), fs is the switching frequency (kHz).
A DC to AC inverter is used to convert the boosted DC output voltage from a DC-DC boost converter to an AC voltage. The size of the inverter should be 30-40% larger than the total wattage [8] of the system equipment. The converted AC signal is used to drive the induction motor. Controlled semiconductor devices such as transistors, SCR and GTO thyristors [9] are used to design and simulate equivalent three-phase inverters.
Study Sites
The study site is situated in the northwestern highland of Ethiopia at the geographical location of latitude 10.2° N, longitude 37.4° E at 310 km from Addis Ababa. An average annual air temperature is 15.9 oC and annual total rainfall is 1321 mm [10]. It is located within the tropics where there is no considerable variation in angle and day length of the sun throughout the year. Figure 4 shows the site which is selected for this study.

Figure 4: Selected Site
System Sizing
Determining the Required Water
The size of the proposed solar PV driven pumping system for irrigation is determined by the amount of water needed to be lifted up, area of land to be irrigated and to what elevation is this water needed [11].
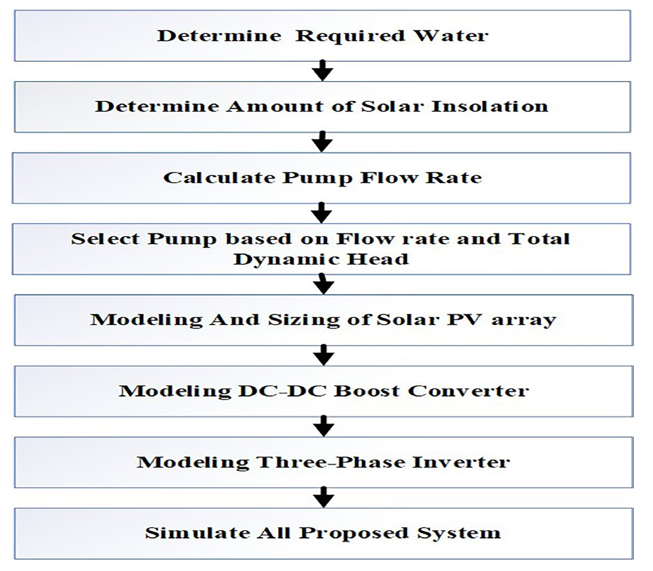
Figure 5: Simple System Sizing Flow Chart
he reference evapotranspiration (ETO) that represents the water loss due to the evaporation and plant transpiration from a reference surface can be calculated using the Blaney-Criddle method [12]. The required crop water needs (ETC) is determined based on the area of irrigation land and crop, growth stages, (initial phase,development, mid-season, and late- season) [13]. The value of crop coefficient (KC ) varies depending on the growing phase of the crop and taken from FAO [14].
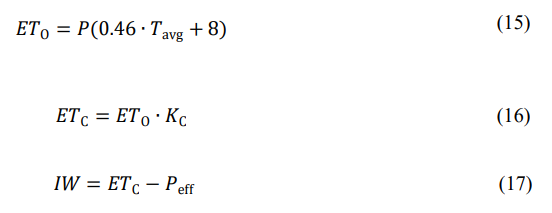
Where, P is mean daily percentage of annual daytime hours (-),Tavg is mean daily temperature (oC) IW required water (mm), Peff effective perception (mm), KC is crop coefficient (-).
The parameters used in Equations 15 to 17 and the resulting values of physical quantities to determine the required water are listed in Table 1 [15,16]. In Figure 6 is shown the daily water requirement of maize (10 hectares) as it was calculated considering the maximum amount of water needed i.e. 41 m3/day in March. From June to September there is no need to pump water because there is enough rainfall. To store and keep extra water for night periods or cloudy weather conditions, a storage tank should be designed. It was assumed that the absence of lighting or cloudy days is only one [17].
|
Month |
Dec |
Jan |
Feb |
Mar |
April |
May |
|
P |
0.26 |
0.27 |
0.27 |
0.26 |
0.26 |
0.26 |
|
Tavg( C) o |
15.4 |
15.8 |
16.9 |
17.9 |
17.8 |
17.6 |
|
ETO(mm/day) |
3.9 |
4.1 |
4.2 |
4.2 |
4.2 |
4.2 |
|
KC |
0.43 |
0.8 |
0.85 |
0.87 |
0.77 |
0.75 |
|
ETC(mm/day) |
1.68 |
3.28 |
3.57 |
3.65 |
3.23 |
3.15 |
|
Peff(mm/day) |
1.49 |
2.97 |
3.17 |
3.24 |
2.87 |
2.87 |
Table 1: Total Water Requirement Parameters
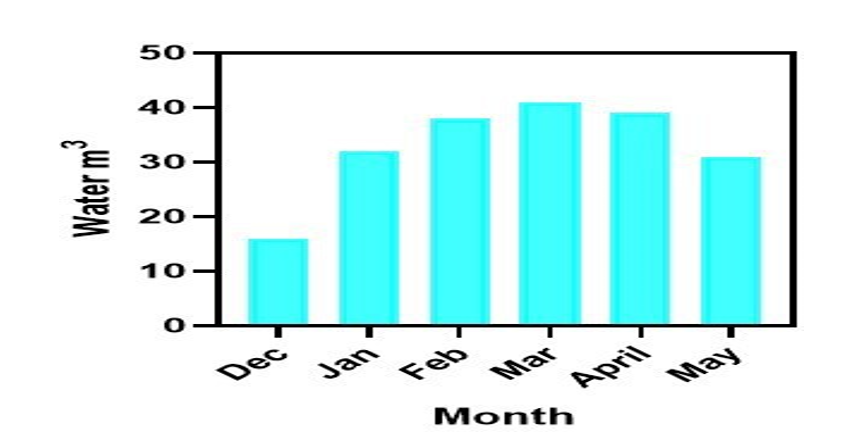
Figure 6: Amount of Water Required
Solar Insolation
For the location where the system is to be installed, Wonka, latitude 10.2° N, longitude 37.4° E and altitude 2490 m, the daily average solar insolation per month on the horizontal plane is estimated to be as shown in Table 2.
|
Average insolation |
Jan |
Feb |
Mar |
Apr |
May |
Nov |
Dec |
Average |
|
kWh/m2 d |
6.32 |
6.74 |
6.68 |
6.62 |
6.19 |
6.1 |
6 |
6.3 |
Table 2: Average Daily Solar Irradiation on the Horizontal Plane
Total Dynamic Head
Total dynamic head is the sum of two components namely static head (vertical rise) and frictional head loss (Hf) of all material that is used in the piping system. To estimate TDH, the following parameters were considered.
• The pipe diameter (5”)
• Static head (12 m)
• The total length of pipe (112 m)
• Frictional head loss
• Velocity losses
• Foot valve
• Elbow
Motor and Pump Sizing
The pump should be selected based on the manufacturer's data- sheets for ensuring that pumps deliver the desired flow for the known total head. For agriculture and industrial application, a centrifugal pump, driven by three- phase squirrel cage induction motor can be used for medium to large scale solar PV powered application. Site geographic area, water source, flow rate (Q), and total dynamic head (TDH) should be considered when selecting the exact pump. The selected pump hydraulic power is 1.84 kW, and the required power (P) to drive the pump is calculated as [18].
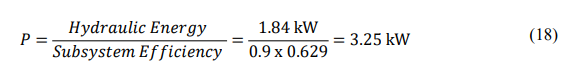
Subsystem efficiency is a combination of pump and motor efficiencies (0.629 in Eq. 18), and converter efficiency (0.9 in Eq. 18). Therefore the required power to pump water is around 3.25 kW. The chosen pump electrical characteristics and specifications are shown in Table 3 below.
|
Model |
Centrifugal, DPVCF6/3B |
|
Maximum rated flow |
13.8 m³/h |
|
Maximum Head |
15 m |
|
Input Voltage |
Single Phase 220/400 VAC |
|
Rated power |
1.84 kW |
|
Frequency (Hz) |
50 Hz |
|
Max. Efficiency |
62.9% |
|
Nominal Induction Motor speed |
1430 RPM |
Table 3: Electrical Characteristics of Selected Pump
Sizing of PV Array
The power rating of the PV array must be greater than the motor pump rating to compensate for electrical and mechanical losses associated with the converter and system assembly. The PV array for this system must be able to provide the minimum energy required to run the pump. The design of the PV array size depends on the values of solar irradiance, PV module efficiency, module temperature coefficient, and controller efficiency. The PV panel selected here is a standard 330 W PV module composed of 72 series-connected monocrystalline silicon cells. The designed PV array consists of 2 parallel-connected strings and each string contains 12 PV panels connected in series. The PV module electrical characteristics are listed in Table 4.
|
PV module model |
CSUN360-72M |
|
Maximum power point (Pmpp) |
330 W |
|
Rated Current (Impp) |
8.85 A |
|
Maximum power voltage (Vmpp) |
37.3 V |
|
Short Circuit Current (Isc) |
9.2 A |
|
Open Circuit Voltage (Voc) |
46.1 V |
|
Max. system voltage |
1000 VDC |
|
Module Efficiency (%) |
17.04 |
|
Number of series –connected module per string |
12 |
|
Number of strings of photovoltaic array |
2 |
Table 4: Specifications of Selected PV Module and Array
The size of PV system is based on the amount of solar radiation available at the selected site. As shown in Figure 7, the availability of solar energy is verified using the RET Screen software on a monthly average daily value of global solar radiation on a horizontal plane.

Figure 7: Horizontal Global Solar Irradiance
To estimate the needed PV energy, total watt-hours per day is multiplied by 1.3 (system loss) and divided by panel generation factor (3.4 for Ethiopia) [19]. The system is designed to run for only six hours during day time. The actual output voltage and power from the PV system is calculated based on the following equations
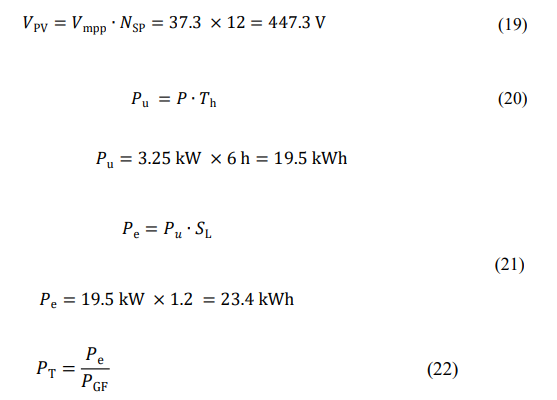
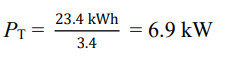
Where, VPV is PV array voltage (V), NSP is number of panels connected in series, Pu is motor pump energy use (kWh), P is pump power (kW), Pe is PV energy needed (kWh), SL is system loss (-), PGF is PV panel generation factor (3.4) (-), Th is the hours of system operation, PT is the total power needed to drive the system (kW).
Simulation Results
The complete model was developed using MATLAB Simulink software, which is a graphical programming environment for modeling and simulating. Simulation results have shown that the output power from solar PV is changing corresponding to the irradiation input and temperature variation with the MPPT. Such system consisting of 24 PV modules, a maximum energy point tracker (MPPT), a DC-DC boost converter, and an induction motor. The DC to DC boost converter is used to boost the DC voltage and additionally to reduce the usage of PV modules. The complete model of solar PV driven pumping system for irrigation is shown in Figure 8 below.

Figure 8: MATLAB /Simulink Diagram of Proposed System
Figure 9, shows that the output power from the PV module is changing with the input irradiation. It is evident that irradiation strongly affects PV power generation and the amount of the PV generated output power is dependent on input irradiance.

Figure 9: V-P Plot of PV Cell Under Different Levels of Irradiances
The input for the solar array is taken from the manually adjusted signal builder which consists of different level irradiation and temperature. Figure 10 shows the PV array output power after extraction of maximum power point by the perturb and observe algorithm.

Figure 10: Solar PV Output Power
The control algorithm used to detect the maximum array voltage is the ‘perturb and observe’ technique. Figure 11 and Figure 12 show the solar array output voltage after the extraction of the maximum power point by the perturb and observe algorithm.

Figure 11: Solar PV Output Voltage
Figure 12 shows the simulation result of the DC-DC boost converter using Simulink. It indicates that a boost converter maintains a constant output voltage and boosted-up dc voltage. The input voltage to DC-DC converter is around 447.6 V from solar PV and the high gain converter boosts the output voltage to around 800 V which is fed as input to the three-phase voltage source inverter.

Figure 12: Boost Converter Output Voltage
The output voltage and power of the three-phase voltage source inverter using Simulink is shown in Figure 13 and Figure 14. From these figures, we observe that the output voltage is around 350 V and 3800 W power, as expected.

Figure 13: Inverter Output Power
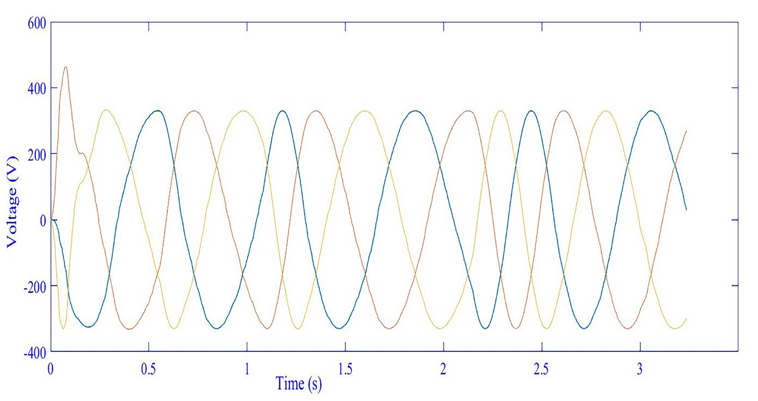
Figure 14: Three-Phase Inverter Voltage
Under steady-state conditions, the load torque of the pump reaches the rated torque of the motor. For constant head water pumping applications, the system torque is constant but the solar irradiation is not uniform during the day, the power delivered to the load is also not uniform which makes the torque characteristics look nonlinear as shown in Figure 15.

Figure 15: Electromagnetic Torque
Figure 16 demonstrates the induction motor rotor speed. The motor is running at full load and the rotor speed becomes 1350 RPM, which is close to the theoretical values (1430 RPM).
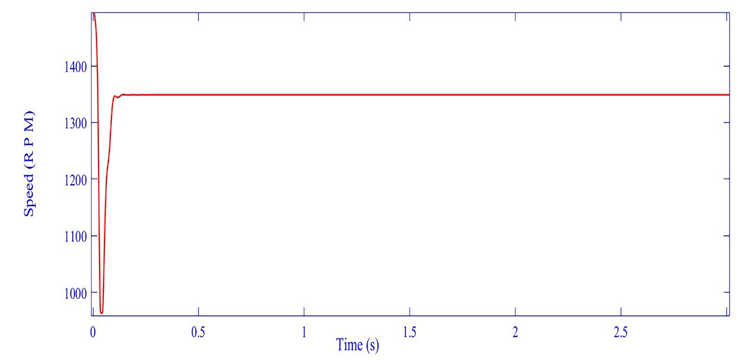
Figure 16: Motor Speed
Figure 17 shows the mechanical output power of the induction motor which drives the centrifugal pump. The minimum power required by the induction motor to drive the pump is 3.25 kW while the maximum simulation output power of the induction motor is 3.7 kW. We can see in Figure 17 that the induction motor satisfies the required output power.

Figure 17: Mechanical Output Power
Figure 18 shows the water discharge which at steady state is 0.0036 m3/s. The system runs for 6 hours, the pump will be able to lift around 78 m3 of water in a period of six hours, which is close to the estimated value in the sizing section.
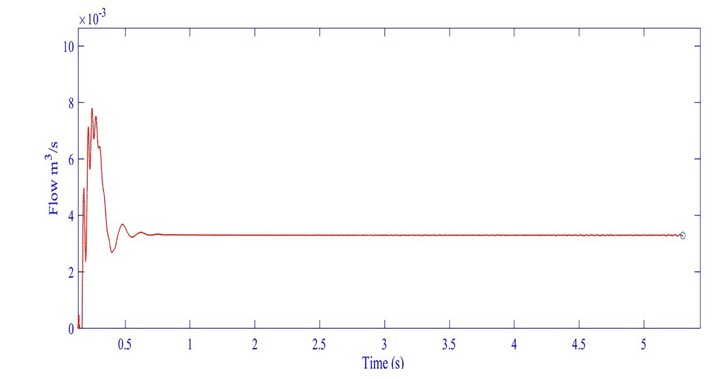
Figure 18: Pump Flow Rate
Life Cycle Cost Analysis
The investment cost of a solar PV driven pumping system for irrigation depends on the required capacity and site conditions. The initial investment cost includes the cost of all physical components of the system (PV array and mountings, fences, control boxes, pumping systems, conduits, storage tanks, distribution systems), installation costs (labor costs) and transportation in a lifetime. The total investment cost of the proposed system was calculated to be $15024 (see Table 5). In year one, annual operating cost is the sum of the initial cost and the cost spent over a year. For a PV-driven pumping system for irrigation the fuel cost is zero. The maintenance cost for the solar driven pumping system for irrigation is considered as 1% of initial cost and the installation cost is 10% of the initial cost. The total investment cost is the sum of the annual cash fixed cost and the annual operating cost.
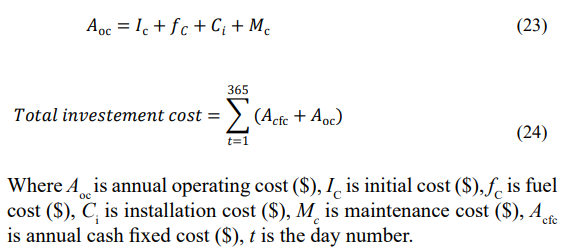
A life cycle cost analysis (LCCA) study was performed to compare the economic performance of the PV driven pumping system for irrigation with a diesel-powered pumping system for a life span of 20 years. This comparison for both solar and diesel-powered pumping systems for irrigation was done based on the same operating times and flow rates. As shown in Table 5 this cost comparison study took into account annual fixed costs and variable costs, solar system maintenance cost, diesel system maintenance cost, replacement and fuel cost for both systems. For the solar system, the replacement cost regards mainly the inverter (and this is very small) while the fuel cost is zero. The cost difference between the systems is small in the first year but the difference increases strongly after two years because of the high maintenance and fuel cost for the diesel-powered system (see Figure 19).
For cost comparison, a diesel-operated pump with the same discharge capacity is selected. Its fuel consumption was considered to be 0.61 L/kWh [20]. The total initial cost of the diesel pump is $10000. The maintenance and operation cost for the diesel pump is considered to be 10% of the capital cost in year 1. From year 2 it is increased by 15% every year [21].
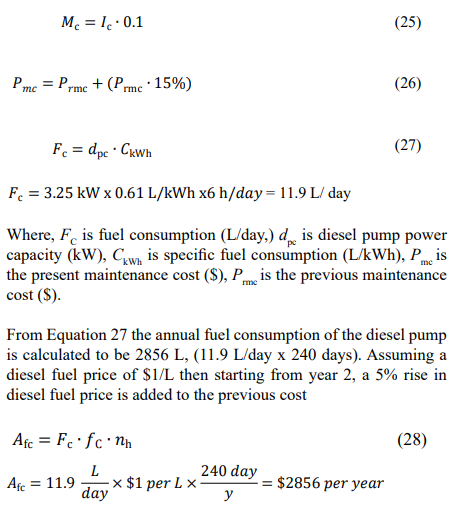
Where, Afc is the annual fuel consumption cost ($), fC is the actual fuel cost ($/L), nh is the number of days of system operation per year. The total investment cost spent in year one is summarized in table 5.
|
Costs |
Diesel Powered |
Solar PV powered |
|
Initial cost ($) |
10000 |
13535 |
|
Maintenance Cost ($) |
1000 |
135 |
|
Fuel consumption (L) |
2856 |
zero |
|
Installation cost ($) |
1000 |
1354 |
|
Total investment cost in year 1 ($) |
14899 |
15024 |
Table 5: Costs During the First Year of Operation
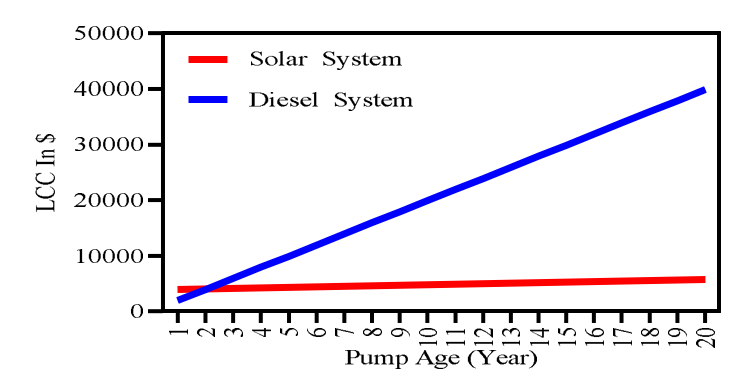
Figure 19: Life Cycle Cost Analysis
Cost -Benefit Analysis
The annual income analysis was worked out based on the average farm size of 10 hectares and considering 2019 maize crop value of $0.7/kg as a reference. Gross income was estimated as the product of crop yield in tonne/ha multiplied by the market price. Net income was calculated considering the annual total variable cost of PV driven system and government tax. The cost of cultivation of the maize and production rate of crop varied from year to year hence the net income may be increased or decreased depending on yearly production and price per kilogram. The average yield production rate of maize throughout Ethiopia in the period from 2001 to 2017 was 5 tonne/ha [22]. The expected average net income from crop sales was calculated using equation (29). Start from year 2 a 5% rise in crop value has been added to the previous crop value.
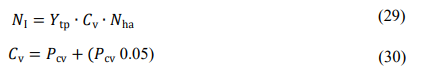
Where, NI is net income ($), Ytp is expected total yield production (kg/ha), Cv is the value of crop ($/kg), Nha is the number of hectares to be irrigated, Pcv is present value of crop in ($/kg).
Figure 20 demonstrates the total net income (NI) comparison during the life cycle for both the solar and diesel-powered systems. After year 2, the net income for the case of the diesel pump (DPNI) is reduced because of the high maintenance and diesel fuel cost while the income in the case of the PV powered system (SPNI) is considerably increased exactly because of the low maintenance and zero fuel costs.

Figure 20: Net Income in Life Cycle
Environmental Damage
The solar-driven system is also advantageous over the diesel one in terms of environmental protection as it does not release any harmful gases that cause global warming and air pollution. The environmental advantage of the PV powered system is analyzed below in terms of CO2 emissions reduction. Considering that every litre of fuel produces 2.8 kg of CO2 [21], the annual CO2 emissions of the diesel-powered pump can be calculated as follows

Where, Ce is the carbon emissions (kg/year), Afc is the annual fuel consumption (L/year).
The proposed PV pumping system reduces CO2 emissions by 8 tonne annually (operating 240 days per year, 2856 L x 2.8 kg/L = 7996.8 kg CO2).
Conclusion
This study has presented a detailed simulation of a battery-less solar PV driven pumping system for irrigation in Ethiopia. The present work also includes the detailed design through simulation of the solar PV driven pumping system. A life cycle analysis of the operating cost was performed to examine the economic feasibility of the PV driven system over the diesel-based pumping system. The obtained results show that the solar PV driven pumping system for irrigation is more economical and environmentally friendly than an equivalent diesel-powered system. The system uses a water storage tank for storing water and meets the water demand for water supply security instead of storing electrical energy using a battery. The life cycle operating cost analysis of this system is carried out using the results of the simulation.
The system design and simulation is accomplished using MATLAB/Simulink software, to verify the system’s functionality along with its components. A three-phase squirrel cage induction motor powered by a 7.6 kW PV array is used to drive the centrifugal pump for the mentioned head and flow rate. A constant and stepped up DC voltage can be obtained at the output of DC DC boost converter. The simulation result has indicated that correct sizing and designing of the system is important to get the desired output. This technique is especially suitable for designing pumping systems for supplying water for irrigation in those areas where there is no grid in Ethiopia.
Life cycle operating cost and a cost-benefit analysis was done considering same operating times and flow rates of both solar and diesel-powered systems. From the life cycle operating cost analysis of the two water pumping systems, the following conclusions were made: In the first year the cost of a solar PV-driven pumping system for irrigation is higher than the diesel-based one but it requires less annual operating cost and zero fuel costs over the period of 20 years. It is observed that a solar-powered system is an excellent alternative solution against diesel power systems as it reduces the operating cost of the system which is a feasible solution in the long run. In general the following conclusions were drawn
• The total cost of the PV driven pumping system for irrigation for a life span of 20 years was found to be $25700 and of the diesel system was $219791, which is about 9 times more than solar PV driven pumping system.
• The capital costs of the solar driven pumping system for irrigation are just 1.1 times the capital costs of the diesel- powered system, while after 20 years of the project, the total lifecycle costs of the diesel operated pump will be 20 times that of the solar operated system.
• By replacing the diesel pump system with the solar-driven one, an annual saving of emissions of 8 tonne of CO2 into the atmosphere is achieved while the use of diesel fuel of about 2856 L/year is avoided.
References
- Endale, A. (2019). Analysis of status, potential and economic significance of solar water heating system in Ethiopia. Renewable energy, 132, 1167-1176.
- Wazed, S. M., Hughes, B. R., O’Connor, D., & Calautit, J.K. (2017). Solar driven irrigation systems for remote rural farms. Energy Procedia, 142, 184-191.
- Qazi, S. (2017). Fixed Standalone PV Systems for Disaster Relief and Remote Areas. Standalone Photovoltaic (PV) Systems for Disaster Relief and Remote Areas, 139-175.
- Chandel, S. S., Naik, M. N., & Chandel, R. (2015). Review of solar photovoltaic water pumping system technology for irrigation and community drinking water supplies. Renewable and Sustainable Energy Reviews, 49, 1084-1099.
- Sreewirote, B., & Leelajindakrairerk, M. (2016, November). Design and development of solar water pump. In 2016 19th International Conference on Electrical Machines and Systems (ICEMS) (pp. 1-5). IEEE.
- Lawrance, W. B., & Troster, R. (1992). Dynamic simulation of a solar pumping system. Renewable energy, 2(6), 591-596.
- Chakchak, J. A. M. E. L. (2017). Application of Rural Photovoltaic Water Pumping System Using Immersed Pump and DC Motor. International Journal of Energy Applications and Technologies, 4(4), 164-173.
- Biswas, S., & Iqbal, M. T. (2018). Dynamic modelling of a solar water pumping system with energy storage. Journal of Solar Energy, 2018(1), 8471715.
- Gujari, A. S., Wagh, M. M., & Shinde, N. N. (2017, August). A technoeconomic feasibility of inverter selection for MegaWatt (MW) scale grid connected solar photovoltaic power plant. In 2017 International Conference on Energy, Communication, Data Analytics and Soft Computing (ICECDS) (pp. 282-288). IEEE.
- Aliyu, M., Hassan, G., Said, S. A., Siddiqui, M. U., Alawami,A. T., & Elamin, I. M. (2018). A review of solar-powered water pumping systems. Renewable and Sustainable Energy Reviews, 87, 61-76.
- López-Urrea, R., de Santa Olalla, F. M., Fabeiro, C., & Moratalla, A. (2006). Testing evapotranspiration equations using lysimeter observations in a semiarid climate. Agricultural water management, 85(1-2), 15-26.
- Katerji, N., & Rana, G. (2011). Crop reference evapotranspiration: a discussion of the concept, analysis of the process and validation. Water Resources Management, 25(6), 1581-1600.
- Kokoye, L. F. (2021). Design and implementation of a smart irrigation system for a sustainable water management in Niger (Doctoral dissertation, WASCAL).
- Ali, M. H. (2010). Crop water requirement and irrigation scheduling. In Fundamentals of Irrigation and On-farm Water Management: Volume 1 (pp. 399-452). New York, NY: Springer New York.
- Abtew, W., & Melesse, A. (2012). Evaporation and evapotranspiration estimation methods. In Evaporation and Evapotranspiration: Measurements and Estimations (pp. 63- 91). Dordrecht: Springer Netherlands.
- Alshamani, A., & Iqbal, T. (2017, October). Modelling of a large-scale solar powered water pumping system for irrigation in Saudi Arabia. In 2017 8th IEEE Annual Information Technology, Electronics and Mobile Communication Conference (IEMCON) (pp. 416-421). IEEE.
- Zau, A. T. P., & Chowdhury, S. D. (2018, June). Design of photo voltaic (PV) solar power plant to supply electricity and to pump water to Chele community. In 2018 IEEE PES/IAS PowerAfrica (pp. 821-826). IEEE.
- Ali, W., Farooq, H., Rehman, A. U., Awais, Q., Jamil, M., & Noman, A. (2018, November). Design considerations of stand-alone solar photovoltaic systems. In 2018 International conference on computing, electronic and electrical engineering (ICE Cube) (pp. 1-6). IEEE.
- Dadhich, G., & Shrivastava, V. (2017, August). Economic comparison of solar PV and diesel water pumping system. In 2017 International Conference on Information, Communication, Instrumentation and Control (ICICIC) (pp. 1-6). IEEE.
- Tasneem, Z., Annie, S. I., & Salim, K. M. (2015, December). Economic analysis of a 3KW solar based irrigation system and comparison with its diesel based counterpart. In 2015 IEEE International WIE Conference on Electrical and Computer Engineering (WIECON-ECE) (pp. 14-17). IEEE.
- Cochrane, L., & Bekele, Y. W. (2017). Average crop yield (2001–2017) in Ethiopia: Trends at national, regional and zonal levels. Data in brief, 16, 1025.