

Open Access Journal of Applied Science and Technology(OAJAST)
ISSN: 2993-5377 | DOI: 10.33140/OAJAST
Impact Factor: 1.08


Research Article - (2026) Volume 4, Issue 2
Demonstration of Liquid/Solid Surface Slippage by Extrapolation of the Flow Pattern

Received Date: Apr 06, 2026 / Accepted Date: May 15, 2026 / Published Date: May 18, 2026
Copyright: ©2026 Colin Cook. This is an open-access article distributed under the terms of the Creative Commons Attribution License, which permits unrestricted use, distribution, and reproduction in any medium, provided the original author and source are credited.
Citation: Cook, C. J. (2026). Demonstration of Liquid/Solid Surface Slippage by Extrapolation of the Flow Pattern. OA J Applied Sci Technol, 4(2), 01-10.
Abstract
Much work has been carried out to try to determine slip between a moving surface immersed in a stationary liquid, or a moving liquid impinging upon a stationary surface, see https://arxiv.org/pdf/cond-mat/0501557v1.pdf
Introduction
My method visualises the flow pattern of liquid being stirred by a rotating cylinder and finds a relationship between the distance of the liquid from the driving cylinder and the rotation speed of the liquid at that point. By extrapolating the mathematical expression for this relationship forwards and backwards, I have shown that there is movement between the liquid at the surface of the driving cylinder and also movement of the liquid against the wall of the container, and how this changes according to the cylinder’s surface type and the type of liquid.
The currently accepted model for viscosity

Figure 1: Is the Currently Accepted Model, to Which there are Many Published References
In this model, the top surface moves to the right, carrying the viscous liquid with it. The velocity of the liquid was assumed to decrease to zero at the bottom surface via a series of conceptual steps in an arithmetic progression, and all current calculations of viscosity originate from this model.
A position of zero velocity is exactly what is described in many diagrams of liquid flows: see “No Slip Condition” in Wikipedia. They assert, without much experimental proof, that there is no movement of the liquid next to the solid surface. The only experimental demonstration is provided by videos on YouTube, where the experimenter has placed ink on the surface of the solid and then stirred the liquid above it.
• https://www.youtube.com/watch?v=cUTkqZeiMow
• https://www.youtube.com/watch?v=brE-62QvuX4
• https://www.youtube.com/watch?v=xPahJBojSIs
The ink appears not to move at the solid surface, but visibly does so when the ink depositing tube is raised into the liquid flow. As will be seen from my later experiment (see below), the flow at the container surface is very slow, but it does move, and the velocities can be calculated for various surfaces. Also, ink contains dyes which are attracted towards surfaces: a property that enables them to stain cloth. Therefore, the YouTube demonstration only shows that dye does not move much against a surface while in a moving liquid.
Looking Again at the Currently Accepted Model
This model looks suspiciously like the model for an elastic solid, stretching to the right and remaining anchored to the lower surface. In an elastic solid, there are continuous lines of atoms joining the top and bottom surfaces, which stay present even after movement. This is not true for an element of liquid, where there are no permanent lines of atoms linking the layers. Instead, there must be transmission of movement from conceptual layer to conceptual layer. This will be found to reduce as the point of measurement moves away from the driving surface.
Looking at this model another way, one can understand that it requires a rectangular box. The top and bottom surfaces represent the moving and stationary surfaces respectively and the sides represent adjacent molecules of the liquid.

Figure 2
The box contains a viscous liquid, designated by the thin lines. If the top surface of the box is pushed to the right, the following
shape is obtained:

Figure 3
With this container, all the liquid is pushed to the right, and flows that way. But for the liquid to move, movement of the sides of the box is required in order to push the liquid. In this current model, there are no sides to the box, and therefore the liquid cannot move the way that is claimed, in this linear fashion, even as a very small element of a larger system. The sides of the box do not exist. The liquid can only move when the driving surface transmits some motion to the layer of liquid underneath, then that layer transmits movement to the layer beneath it, and so on.
A Proposed New Model
What must be the case around a rotating cylinder in a “Newtonian” liquid is that a series of conceptual concentric, infinitesimally thin rotating cylinders of liquid are present, with the rotational speed of each being in a geometric series as we get further away from the driving cylinder. (See example below.)

Figure 4
In this thought experiment, each notional cylinder must impart the same relative motion at a ratio of 0.5 to its neighbour, or whatever fraction pertains to the substance in question. Clearly, a thin liquid will experience a fraction approaching unity, and the velocity of the cylinders will gradually diminish the further away from the driving cylinder one measures.
A liquid with high viscosity will experience a low fraction, so that the velocities drop quickly. A material with non-Newtonian flow behaviour will set up conceptual concentric cylinders where the velocity of each cylinder will not decrease according to a geometric series but by some other function that can go to zero.
Published Work on Rotating Cylinders
G.I. Taylor F.R.S studied liquid flow between cylinders and published in Philosophical Transactions of the Royal Society of London, Series A, Vol.223 Isue 605-615 VIII in 1922 in an article entitled “Stability of a Viscous Liquid contained between Two Rotating Cylinders”, but this study was concerned with the onset of instability of flow. The same subject was later worked on by Katherine J. Asztalos and Jorge Pulpeiro Gonzalez in a piece entitled “Stability Analysis of Taylor-Couette flow, May 5th 2017, but there was no experimental work described, only mathematical analysis. My geometric series model required testing in the following experiment:
Experiment to Find the Velocities of Concentric Circles in a Viscous Liquid Driven by a Rotating Cylinder
The following apparatus was constructed:

Figure 5
The dimensions of the apparatus are as follows:
• Cylindrical tank height = 10.9 cm internal. PMMA (clear acrylic).
• Internal diameter of tank = 10.4 cm.
• Float, for sugar syrup = 2.8 cm, made from plastic tubing, sealed at bottom and weighted with bronze powder, to float vertically.
• Float, for castor oil = 2.8 cm, uses a ballpoint pen ink tube, sealed, and weighted with bronze powder
• Cylindrical spindle diameter = 1.86cm.
• Cylindrical spindle height = 6.48 cm
• Viscometer is a Chinese-made NDJ-1, capable of 6, 12, 30 and 60 rpm, and was checked for accuracy of speed.
Composition of viscous, non-crystallising, liquid
Glycerol 360g
Sucrose 210g
Dextrose 290g
Water 181.75g
Total in container 1041.75g.
The composition is heated to clarity with stirring, cooled, and water loss replaced. Viscosity = 439cP at 15.7ºC. It is still somewhat hygroscopic.
Method
The objective of the method is to measure the velocities of a stirred liquid across the space between the driving cylinder and the wall of the vessel. A float is placed in various measured positions relative to the centre, and its time for one revolution measured.
The viscometer probe is lowered into the liquid so that the top of the probe is just below the surface of the liquid. This can be verified by viewing a straight, vertical object by reflection from the surface, where any meniscus can be easily seen. The objective is that no strong meniscus further out than about 1cm is obtained when the probe is in position. Floats will rise into an elevated surface according to the so-called “Cheerios Effect” as described by Dominic Vella and L. Mahadevan, arXiv:cond-mat/0411688v3, 25/6/2007. Since that surface is sloping in a meniscus, a marker float will also move towards the object generating the meniscus, changing its distance from the driving cylinder. The distance is maintained for one revolution in this experiment.
The cylindrical probe was centred in the cylindrical vessel by checking the distance of the probe from the vessel wall using dividers, and moving the viscometer until all distances equal. A radial pointer was attached to the top of the vessel, and the time for one revolution recorded for each position of the float.
In the current set-up, the viscometer is run at 6 revolutions per minute (rpm). The float is initially placed as near as possible to the centre and the distance measured. The motor is run, with the viscometer disc locked and the spring ineffective, and the distance of the float from the centre of the spindle is measured with dividers after one complete revolution, to an accuracy of 0.5mm. This act is carried out after moving the float outwards for each position. The effect of centripetal force on the float as it was moved around in a circle was found to be negligible. The following results were obtained:
|
Distance from centre, cm |
Time (t), seconds |
Rpm (=60/t) |
Distance from centre, cm |
Time (t), seconds |
Rpm (=60/t) |
Distance from centre, cm |
Time (t), seconds |
Rpm (=60/t) |
|
1.38 |
24.91 |
2.4087 |
2.38 |
79.16 |
0.7580 |
3.48 |
221.76 |
0.2706 |
|
1.53 |
32.83 |
1.8276 |
2.58 |
102.15 |
0.5874 |
3.58 |
282.28 |
0.2126 |
|
1.83 |
41.78 |
1.4361 |
2.78 |
123.95 |
0.4841 |
3.93 |
456.05 |
0.1316 |
|
2.03 |
54.85 |
1.0939 |
2.93 |
137.51 |
0.4363 |
|
|
|
|
2.18 |
70.32 |
0.8532 |
3.08 |
152.29 |
0.3940 |
|
|
|
When plotted in Excel, this graph was obtained:
Table 1

The points follow an exponential curve quite closely, and it corresponds to a geometric series of value decay over distance, with a common constant of decay per unit distance.
This can be seen in a better presentation using a logarithmic scale for rpm, when it can be compared to a decay curve with a factor of approximately 0.35 per centimetre of distance:
Figure 7: Rpm Versus distance from Centre, 1 Revolution Only

Figure 8: Rpm Versus distance from Centre, 1 Revolution Only
It is interesting to note that when these lines are extended backwards to 0.93 = the radius of the driving cylinder, (by using the Excel equations), the calculated rpm value is only 3.611: rather lower than the rotation speed of 6 rpm for the cylinder. This does indicate slip of 39.82% between the cylinder, a highly polished stainless steel with a high surface energy, and the liquid, which also has a high surface tension. (The syrup does not properly wet the steel cylinder, as can be seen during drainage, when the syrup forms beads on its surface.) Also, when extending the lines to reach the wall of the vessel, 5.20cm from the centre, the radial velocity = 0.03757 rpm, which calculates to 0.2046 mm/sec at the wall. This is comparable to the observed drainage time of the syrup from the PMMA wall under the small force of gravity. It does, however, impact the value for torque because of the large surface area of the tank.
Effect of Tank Wall on Torque
The cylinder of liquid produced by shearing does indeed extend to the tank according to the above figures, and we can assume its height is approximately the same as the height of the spindle’s driving surface, which is 6.48 cm. Since torque is proportional to surface area and revolutions per minute and we do not know the actual torque in the instrument, we can calculate only a relative torque based on a percentage of the total torque experienced at the spindle. The dial reading is itself a percentage of the maximum torque on the instrument spring in normal use as a viscometer (rather than its use here as a synchronous motor), so the best way to understand the torque at the tank wall is to assume a 100% torque reading on the instrument dial and calculate the effect of the tank wall by proportion.
• Area of a cylinder is 2πrh where r is the radius and h the height.
• Area of the spindle cylindrical surface is 2×π×0.93×6.48 = 37.8650 cm2. Velocity = 6 rpm
• Torque ∝ area × speed, therefore torque ∝ 37.8650×6 = 227.19
• Area of tank wall = 2×π×5.2×6.48 = 211.7182 cm2. Velocity = 0.03757 rpm
• Torque ∝ area × speed, therefore torque ∝ 211,7182×0.03757 = 7.9543
• As a percentage of the measured torque at the spindle, this is (7.9543/227.19) ×100 = 3.5011% Since the speed of the moving liquid measured away from the spindle decreases by a geometric series and the area of the tank wall increases by an arithmetic series as the radius increases, to reduce the effect of the tank wall we need to use a larger tank. The general equation for the quantity of torque affected by the tank wall requires a mathematical analysis which is outside the scope of this thesis.
Tests with Liquids of Different Surface Tension Driven by Surfaces of Different Surface Energy
The sugar syrup used up to this point has a high surface tension, which can be seen when the liquid, draining off the spindle and from the vessel, beads up before detaching. Therefore, a liquid with a lower surface tension such as a vegetable oil needed testing, and castor oil was selected as having a high viscosity. Also, it was possible to paint the spindle, thus providing a lower surface energy for testing against both liquids.
Firstly, it was interesting to compare the actual torques of the painted and unpainted spindle in the two liquids. Actual viscosities were not possible because the actual torque on this particular viscometer is unknown. Therefore, percentage torque per centimetre of immersion was measured, (by successive lowering of the cylinder), and the table below shows the results. These are uncorrected for displacement of the liquid surface, but the factor of 1.0330429 (derived from a 10.4 cm diameter tank and 1.86 cm diameter spindle) may be applied if necessary.
|
% torque per centimetre immersion |
Paint (white, water-based) |
Stainless steel |
|
Castor oil |
11.102 |
11.207 |
|
Sugar syrup |
12.886 |
12.347 |
Table 2: Percentage Torque Versus Immersion (Uncorrected for Immersion, Corrected for Painted Diameter and Temperature, Using Successive Lowering
These figures indicate good correlation between the behaviour in castor oil, and somewhat less good in sugar syrup, which may mean some slip between the steel surface and the sugar syrup. This is tested for by the ‘Concentric Method’ described earlier, and the results are in the following table:
The “concentric test” at 6 rpm, 20.1ºC produced the following data:
|
Geometric mean of pointer distance from spindle, start to end of test, centimetres |
Time for one revolution of pointer, seconds, with spindle rotating at 6 rpm. 21.9ºC |
|
1.70 |
34.54 |
|
2.50 |
98.38 |
|
2.90 |
156.58 |
|
3.45 |
300.95 |
When plotted in Excel, this graph was obtained:
Table 3: Painted Spindle in Casto Oil
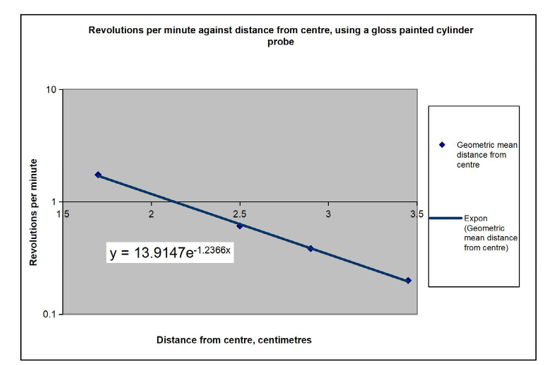
Figure 9: Revolutions Per Minute Against Distance from Centre, using a Gloss Painted Cylinder Probe
A good linear fit was obtained when logarithmic scales were used, and the equation of the line is:
y = 13.9147 e−1.2366x where y is the revolutions per minute, e is the exponent, and x is the distance from the centre. This is used to calculate the rpm at the spindle’s cylindrical surface, using 0.9325 cm as the radius. The result is 4.392 rpm, which is 73.20% of the 6rpm driven speed, leaving 26.8% as slip.
Stainless Steel Spindle in Castor Oil
The “concentric test” at 6 rpm, 21.6ºC produced the following data:

Figure 10: Revolutions Per Minute Against Distance from Centre, using a Stainless-Steel Cylinder Probe
The equation of this line is: y = 11.8189e-1.1380x, and using the spindle cylindrical radius of 0.93 cm, the speed at the circumference is 4.1015 rpm, which is 68.35% of the drive speed, leaving 31.65% slip.
|
Geometric mean of pointer distance from spindle, start to end of test, centimetres |
Time for one revolution of pointer, seconds, with spindle rotating at 6 rpm. 21.9ºC |
|
1.385 |
14.98 |
|
2.05 |
31.31 |
|
2.60 |
48.95 |
|
3.25 |
106.03 |
|
3.95 |
238.19 |
Table 5: Painted Spindle in Sugar Syrup, 21.9ºC, 12 rpm

Figure 11: Revolutions Per Minute Against Distance from Centre, using a Gloss Painted Cylinder Probe
The Excel equation is y = 17.9156 e-1.0683x, producing an efficiency of 55.13% and a slip of 44.87%.
Sugar Syrup Composition
The following mixture generated crystals of what appeared to be dextrose: Glycerol 27%, sucrose 25%, dextrose (d-glucose) 30%, water 18%. The mix requires heating until bubbles appear and the liquid clears, followed by addition of water to compensate for weight lost by boiling. More sucrose was added, but the mix was not weighed, so the current formulation, which does not crystallise, is approximately: Glycerol 26.5%, sucrose 26.5%, dextrose 29.5%, water 17.5%. Formulations around these levels have been subjected to weight tests on exposure and have been proven to be essentially non-drying and non-hygroscopic, thus maintaining stability during use. The first experiment in this series was made with a different sugar syrup, but I am including it in this summary so that the different surfaces and liquids can be compared.
|
Comparison of slip |
Castor oil |
Sugar syrup |
|
Painted steel |
26.8% |
44.87% |
|
Stainless steel |
31.65% |
39.82% |
Table 6
While this work obviously needs to be repeated in another laboratory, these results clearly show a tendency for the high surface tension sugar syrup to slip against a polished steel surface and a painted surface (of lower surface energy), while the lower surface tension castor oil has significantly lower slip. In case this property could affect viscometer readings from other technologies, the actual viscosity as measured by torque per centimetre immersion was measured for each in Table 2 and shows little difference. This indicates that friction is still occurring between whatever surface type is used and at least two different liquids. It would be interesting to use the surface of least friction, PTFE, as the spindle material in different liquids. For example, viscous liquids such as polyisobutylenes are claimed to possess “Newtonian” flow and should have lower surface tension than castor oil. These further improvements are outside the scope of this thesis.
Conclusions
The experiments show significant slippage between a driving cylinder and a viscous liquid. This is variable, and may result from surface tension and surface energy effects of the substances involved, or may probably initially derive from the transfer of energy from the spindle towards the moment of inertia of the concentric cylinders of liquid formed by stirring.
It is hoped that these experiments are repeated in another laboratory, and a mathematical study of the phenomenon of concentric flow is undertaken.
References
- Link to "gurelyasin" experiment on YouTube.
- Link to "Learn Fluid Mechanics" article on YouTube
- Link to No Slip Boundary Condition article on YouTube.
- G.I. Taylor F.R.S:.Philosophical Transactions of the Royal Society of London, Series A, Vol.223 Issue 605-615 VIII in 1922. “Stability of a Viscous Liquid contained between Two Rotating Cylinders”
- Research Gate: Katherine J. Asztalos and Jorge Pulpeiro Gonzalez “Stability Analysis of Taylor- Couette flow", May 5th 2017
- Dominic Vella and L. Mahadevan, arXiv:cond-mat/0411688v3, 25/6/2007.. “Cheerios Effect”