
Journal of Veterinary Health Science(JVHS)
ISSN: 2831-3887 | DOI: 10.33140/JVHS
Impact Factor: 0.762

Research Article - (2022) Volume 3, Issue 4
Contribution of Private Game Ranching and Captive Bred Operations in South Africa to White Rhino Ceratotherium simum Species Survival Conservation
2Wildlife Vet, Platinum Rhino Conservation Enterprise, Klerksdorp, South Africa, Extension Officer, for Rhino Con¬servation and Management for the Department of Forestry, Fisheries and the Environment, Pretoria, South Africa
3Studbook & RhODIS Rhino Registration Coordinator at Rockwood, RhODIS, Rhino, DNA Index System, Veterinary Genetics Laboratory, Onderstepoort, University of Pretoria, South Africa
4Attorney, Owner of Harmony Game, South Africa
Received Date: Oct 20, 2022 / Accepted Date: Oct 24, 2022 / Published Date: Nov 02, 2022
Copyright: ©Copyright: ©2022 Furstenburg D. This is an open-access article distributed under the terms of the Creative Commons Attribution License, which permits unrestricted use, distribution, and reproduction in any medium, provided the original author and source are credited.
Citation: Furstenburg D, Otto M, Van Niekerk P, Lewitton D. (2022). Contribution of Private Game Ranching and Captive Bred Operations in South Africa to White Rhino Ceratotherium Simum Species Survival Conservation. J Vet Heal Sci, 3(4), 331-360.
Abstract
The southern white rhinoceros (SWR) (Ceratotherium simum simum) is under global threat of extinction, due to poaching in protected areas and state-owned parks. The Kruger National Park (KNP), the stronghold for SWR, has suffered a population decline of over 75.0% since 2011, and an average annual decline of -10.2% from 2008 to 2020, a remaining population estimated at 2,607 animals by the end of 2020, and 2,458 animals left by the end of June 2022. On the contrary, SWR under private custodianship on rewilded agro-sustainable game ranches in South Africa [estimated at >8,000 animals, some of which are registered Captive Breeding Operations (CBO); assessed CBOs contained 2,882 rhinos with this study (Sep 2021)], increase with average annual growth performances of 9.0%. This increase has been attributed to effective security, provision of additional habitat, dispersal, and frequent genetic exchange of rhinos between private breeding subpopulations. World conservation bodies, mostly due to misguided and prejudiced media publicity and the lack of scientific analytical assessment, have largely overlooked the conservation success of the private sector. Private rhino custodians and their bio-conservation breeding practices, with private agro-sustainable biodiversity wildlife management and/ or captive breeding, generally being perceived as either “canned” or equated to “captive zoological-gardens”. Since the commencement of the International Convention on Biodiversity, global controversy exists whereby most of mankind today perceive bio-conservation of a species to be assigned in principle solely to protected areas and state-owned parks. The unique and advantageous roles of rewilded bio-conservation and sustainable-use conservation CBOs, being a key to green-economy and natural capital in a post-Covid-19 struggle, are mostly ignored. This study serves to assess and quantify the impact of private wildlife ranching in South Africa with specific focus on its potential contribution to rhino conservation specifically for that of the SWR C.s. simum.
Keywords
Rhinoceros, Agro-Sustainable Biodiversity, Biodiversity Conservation, Species Integrity Heterozygosity, Metapopulation Management, Endangered Species
Introduction
Rhino Population History
The southern white rhinoceros (SWR) is listed as Near Threatened on the IUCN red list of threatened species, but the species’ integ-rity and current survival status is in question, with the remaining South African SWR population in state-protected areas continuing to decrease annually. Their questionable status is propagated by noted discrepancies in available literature, reports by the IUCN and the media as well as the failure by management authorities to release up-to-date and accurate figures [1-3]. Globally, white rhi-no numbers have declined from >250,000 c.1700s, to the brink of global extinction by c.1895, a single population remaining of be¬tween 20–50 individuals in what is known today as Hluhluwe-iM-folozi Park (HiMP) in South Africa [4-10]. It was protectionist and conservation practices and Project Rhino, spearheaded by the late Dr Ian Player [11] that saved the SWR from extinction, despite a genetic bottleneck that threatened their survival, status, and spe¬cies integrity. Numbers in Africa increased to an estimated max¬imum of around 20,000 by 2011 [4, 6]. Since 2011 a continuous decline and a reduction of 75.0% reported for the largest remaining SWR population of the Kruger National Park (KNP) [1].
Conservation Shift
In South Africa, home to more than 86.5% of the world’s re-maining SWRs [3, 12-13] a sequence of consequential shifts of approach in SWR conservation occurred since the c.1895 genetic bottleneck [6]. First priority was the protection and stabilization of the last few remaining rhinos into the establishment of a state-owned park, the HiMP of today. The second approach, to redistrib-ute rhino across a greater geographic range and variety of habitats commenced in 1961 with the first rhino relocation to Loskop Dam Nature Reserve, and later in October the same year to the KNP. A narrative shift came in July and August 1976 when a white rhino bull and cow were introduced to the Ubizane Game Ranch of Mr. Norman Dean in KwaZulu-Natal, the first practical private own¬ership of SWR. Private ownership escalated since 1979 when sur¬plus white rhinos from state-owned protected areas were sold for the first time on live game auctions. The next conservation shift happened in 1991 when the Game Theft Act of South Africa was legislated, which makes provision for legal private ownership of wildlife. This unusual situation, where a wildlife species is no lon¬ger a res nullius property but can be fully privately owned, has had significant consequences for SWR [14]. Legal ownership created the incentive for viable commercial trade, and consequently private ranching and breeding, and potential increase in SWR population numbers. Trade attributed also to further expansion of the specie’s distribution range. Metapopulation rhino management from pri¬vate owners served as seed populations to re-establish populations throughout the SADC region as well as approved destinations globally. Consequently, the conservation status of SWR improved and in 1994, the South African SWR population was down listed to Appendix II by the Convention on International Trade in Endan-gered Species of Wild Fauna and Flora (CITES) for the exclusive purposes of allowing trade in live exports and hunting trophies to approved and acceptable destinations.
The present conservation approach (assessed by this study), came in 2006 with the Captive Breeding Operation (CBO) guidelines presented by the South African Development Community (SADC) Rhino Program [15] are aimed at maximizing population growth rates, ensuring long term genetic and demographic viability, ani¬mal welfare and safety, and rewilded agro-sustainable biodiversity enhancement, in specific of SWR. The first privately owned and registered SWR CBO commenced in 2008.
The IUCN World Congress (2012) adopted Motion 26 (as cited by the Department of Forestry, Fisheries and Environment [DFFE] in their Rhino Issue Management Report [16], which which en¬courages rapid growth with genetic and demographic viability as the cornerstone goals for sustainable conservation of the species. Additionally captive populations can act as a “safety net” should the depredations of poachers reduce global “wild” rhino numbers to dangerously low levels [17]. Successful breeding programs in captivity require scientific and co-operative management to pro¬duce viable populations. Adequate husbandry, veterinary care, ge¬netic management and veld and habitat resources management can achieve viability of captive populations [18, 19]. Rhino population performance is density dependent [4] thus, distribution of local¬ized wild populations to CBOs and private land across additional viable habitat throughout the country can maintain productive den¬sities in the donor populations and provide founder animals to new subpopulations to enhance specie’s growth [20]. In addition, by distributing rhino geographically the possibility of enhancement of genetic heterozygosity increases [17].
Southern white rhino populations now occur widespread across South Africa in formally proclaimed conservation areas as well as on private land. The Private sector contributed approximately 2.2 million million hectares (Mha) of land towards rhino conserva¬tion [21] in 2013 and increasing. As of 2020, private owners are custodians to a total of >7,000 or >57.0% of the national SWR population [22-23].
Southern White Rhino (SWR) Population Status
According to a survey by the SADC countries Rhino Manage-ment Group and data from IUCN’s Species Survival Commission (SSC) African Rhino Specialist Group (AfRSG) [13], the last of¬ficial published figures for the Southern white rhino population in South Africa was estimated at n = 15,625 (90.0% bootstrapped confidence index [CI]) of an estimated African SWR population of n = 18,067 (n = 17,212–18,915: 90.0% CI). A review of the historic published southern white rhino population numbers by the IUCN (including revisions) and the relevant statistical poaching trends over the past decade to date, indicate that the likelihood that the South African SWR population of n = 15,625 reported for December 2017 remained constant, is improbable, and most likely an overestimation by the end of 2020. From January 2008 to June 2022, a total of n = 9,597 rhino was recorded to have been poached in South Africa alone.
For the purpose of this report, a working estimation of the South African SWR population as of the end of 2020 was rationalized using the estimated population of n = 18,993 in 2012 as a starting point [24]. Given the above estimated annual white rhino losses due to poaching, and using the cautiously optimistic assumption that the national metapopulation showed a positive annual net pop¬ulation growth rate of between 1.0–5.0% since 2012 after poach¬ing losses (recommended minimum goal as per the South African White Rhino Biodiversity Management Plan [BMP] for (2015–2020) this growth rate reflects the underlying biological growth rate of the metapopulation i.e. is independent of any increases or decreases in numbers due to import or export of rhino in and out of the country, this would equate to an estimated maximum national South African SWR population number of (x) = 14,009 by the end of 2019 [24]. Even when using an optimistic annual growth rate of 5.0%, this working estimation falls well below the short-term 5-year conservation target set by the Biodiversity Management Plan of an expected n = 20,400 white rhino in South Africa by the end of 2020 (which only used an estimated 2.0% annual growth rate after poaching [24]). it is also worth mentioning that South Africa suffered a severe drought in 2015–2017 along with the lag effect, decreasing the underlying growth potential as well [26].
Putatively, it has been acknowledged that the level of poaching has exceeded the per annum net births (natural underlying growth rate) and that the South African national metapopulation has been in negative growth for the past couple of years [25], and and that despite poaching levels decreasing in the Kruger National Park, the numbers continue to decrease indicating that in relative terms, the percentage of this population being poached is still unsustain¬able (in other words, the level of poaching exceeds the per annum net births and outcompetes the underlying natural growth rate) in¬dicating that due to continued unsustainable poaching losses, the global SWR number continues to decline.
Considering the uncertainties surrounding the true current status of the SWR, it is important to consider a range of possible conser-vation strategy options available in order to improve management decision making. This report serves to compare the vital rates, sur¬vival efficiency and fertility rates of a number of different options available, e.g., private ownership CBOs and free roaming state-owned protected areas.
Materials and Methods
The aim of the study is to analyse the survival and vital rate per- formances of a series of six (referred to as Case studies no’s 1–6) privately ranched white rhino CBOs in South Africa, to give an analytical review of the private sector and whether their manage¬ment of their rhino populations has a potential detrimental effect on South African SWR survival. Secondly, to compare with the largest state-protected “wild” SWR population the KNP.
The CBOs of the Case studies are located in the Northwest, North¬ern Cape, Limpopo, and Free State Provinces of South Africa. Rel¬evant data and findings of the resident rhino populations at each Case study as from date of inception to end of September 2021, as well as additional data provided by the Private Rhino Owners As¬sociation (PROA). All data provided by the private rhino owners was given willingly, without financial incentives and to the best of the corresponding authors’ knowledge, is accurate.
Natural resources, management, animal studbooks, population dy¬namics, and animal health and performances of the CBOs were assessed. The outcome further discussed will be in relation to the claims from the High-Level Panel (HLP) draft report of DFFE [27] towards the conservation and survival of the species. For securi¬ty purposes, the geographics, owner and property identities of the study sites are not disclosed in this report.
Using the working model depicted in TABLE 1 below, the work¬ing SWR population in South Africa as of the end of 2020 used for the purposes of this report, is therefore n = 14,035 Ì´ 14,000, but most likely less at the time of publication due to the additional n = 451 poached in 2021 and n = 259 rhino lost already up to the end of June 2022 (or n = 16,225 of remaining African rhino extrapolated number at 86.5%, or n = 16,339 remaining global SWR number extrapolated at 99.3%). This working South African white rhino population number calculated in this study, is very similar to an in¬dependent recent publication of an estimated South African SWR number of n = 14,410 for 2020 [1].
Table 1: Model of working South African Southern White Rhino (SWR) Population Estimates
|
Year |
2012 |
2013 |
2014 |
2015 |
2016 |
2017 |
2018 |
2019 |
2020 |
|
Estimated global SWR population number if African population is 99.3%: |
20,572 |
20,572 |
20,070 |
19,741 |
18,546 |
18,175 |
16,510 |
16,310 |
16,339 |
|
Estimated African SWR population if South African population is: (row A) number (n) =, (row B) as (%) = |
20,4291 |
20,4291 |
19,9302 |
19,603 |
18,416 |
18,0473 |
16,395 |
16,195 |
16,225 |
|
92.68 |
92.68 |
92.68 |
90.36 |
90.36 |
86.50 |
86.50 |
86.50 |
86.50 |
|
Estimated South African SWR population number (n) for: (row A) onset of year (x) =, (row B) end of year {[([x-p+y]+[x- p+z])/2]-k} = |
|
18,9331 |
18,471 |
17,7132 |
16,641 |
15,6113 |
14,533 |
14,182 |
14,009 |
|
18,9331 |
18,471 |
17,713 |
16,641 |
15,611 |
14,533 |
14,182 |
14,009 |
14,0357 |
|
|
Number SWR export permits issued as per CITES trade database (k) = |
111 |
64 |
151 |
48 |
102 |
186 |
56 |
34 |
20 |
|
Number of rhino poached in S.A.: |
668 |
1,004 |
1,215 |
1,175 |
1,054 |
1,028 |
769 |
594 |
394 |
|
Number SWR poached in S.A. (p) = |
643 |
966 |
1,161 |
1,113 |
1,011 |
970 |
7314 |
5644 |
3744 |
|
SWR (%) of total rhino poached in S.A.: |
96.25 |
96.23 |
95.56 |
94.72 |
95.92 |
94.36 |
95.0 |
95.0 |
95.0 |
|
Estimated (%) of South African SWR population poached: |
|
5.1 |
6.3 |
6.3 |
6.1 |
6.2 |
5.1 |
4.0 |
2.76 |
|
5Best estimated underlying population growth at 5.0% (y) = |
|
+947 |
+924 |
+886* |
+832* |
+781* |
+727 |
+709 |
+700 |
|
5Poor estimated underlying population growth at 1.0% (z) = |
|
+189 |
+185 |
+177 |
+166 |
+156 |
+145 |
+142 |
+141 |
1Originally reported as an estimated n = 18,933 for South Africa by December 2012 [24] and the African SWR estimated at n = 20,429. Latter figure adjusted twice to n = 20, 608 [28] and again to n = 21,320 [13] to date.
2Originally reported as n = 18,413 for South Africa with an Afri-can SWR population of n = 20,378 (19,666–21,085: 90.0% CI) by December 2015 [28] but has since been revised to -1.6% of original figure with the African SWR population adjusted to n = 20,056 [13].
3Reported as an estimated n = 15,625 for South African SWR pop¬ulation and an estimated African SWR population of n = 18,067 (17,212–18,915: 90.0% CI) by December 2017 [13].
4Official breakdown per species not available as of end of 2017, (supplementary information). Following the average trend from previous years, estimated figure taken as 96.0% of the reported annual poaching statistic. Cognisance also needs to be taken that these figures represent a minimum loss to poaching given the like¬lihood of some carcass under-detection and reporting of at least 20.0% of carcasses going unnoticed [3, 26].
5Underlying population growth of at least 5.0% as recommended by the IUCN for healthy growing population as well as a low esti-mate of only 1.0% underlying growth rate (to account for potential losses of breeding females due to poaching) used to determine un¬derlying population growth estimated range per annum.
6Marked reduction in poaching percentage most likely attributed to the COVID 19 outbreak and the resultant National Lockdown that occurred in South Africa during the most of 2020, which only allowed for limited travel between provinces and closed Nation¬al borders. The onset of 2020 reported n = 249 poaching losses, showing a 67.0% increase from the n = 166 poached numbers re¬ported for the same period January to June the previous year.
7First net increase in SWR population numbers since 2012. If this working model proves to be correct, the positive population growth as noted here is most likely attributed to the positive growth of pri¬vate CBOs and their respective successful vital rates rather than just a decrease in the poaching trends.
*Cognisance was taken that South Africa suffered a severe drought during 2015/ 2016. Using the KNP stronghold as a benchmark model for the effect of the drought conditions on the South African SWR population which cited a detectable decline in white rhino numbers due to increased natural mortalities during 2015–2017 by around 0.5% per year and reduced birth rates for the post-drought 2016/ 2017 period of around 4.0% due to the lag effect of the 16-month gestation period of SWR [26]. before "Paired with the highest estimated percentage of SWR population losses due to poaching reported for the period of 2015–2017, the best underly¬ing growth rate for the working model was adjusted to 0.5% for this time-period for a more realistic reflection of possible underly¬ing population growth.
Operation Case Studies (Study Area)
Case Study No. 1
The CBO commenced in March 2008, was officially registered as a Captive Breeding Operation for Southern white rhino in May 2009 and had a resident SWR population distributed into n = 21 subpopulations of n = 2,000 rhinos at end of May 2021 (TABLE 2), which contributes to >14.0% of South Africa’s estimated work¬ing national population number by the end of 2020. The period reviewed is approximately 14 years. Environment is the Dry High¬veld Grassland Bioregion in Vaal-Vet Sandy Grassland with pock¬ets of Klerksdorp Thornveld [29] consisting of 8,516 ha of land in¬habited by rhino. Some 36.8% of this land had been rewilded from historically ploughed crop lands and 59.9% from past livestock farming: 96.7% of the land now sharing a biodiverse multispecies mixture of natural game and fowl being conserved.
Table 2: Geographic Spatial and Management Parameters of the White Rhinoceros Captive Bred Operations Studied
|
Parameter |
CBO Case study no. |
Total / Average |
|||||
|
1 |
2 |
3 |
4 |
5 |
6 |
||
|
Registration: |
May 2009 |
Sep 2019 |
Feb 2021 |
Feb 2021 |
In process |
2022 |
|
|
Operation starting date: |
Mar 2008 |
Aug 2013 |
2013 |
2011 |
2011 |
2009 |
11 Years |
|
Geographic location (Province): |
North West |
Northern Cape |
Limpopo |
Limpopo |
Limpopo |
Free State |
4 Provinces |
|
Total rhino land area size (ha) = |
8,516 |
7,955 |
2,502 |
2,686 |
1,110 |
2,939 |
25,708 |
|
Area of land rewilded from ploughed land: (row A) per (ha) =, (row B) as (%) = |
3,135 |
0 |
5 |
105 |
500 |
1,064 |
4,809 |
|
36.8 |
0.0 |
0.2 |
3.9 |
45.1 |
36.2 |
20.4 |
|
|
Area of land rewilded from alien livestock farming: (row A) per (ha) =, (row B) as (%) = |
5,101 |
7,788 |
2,500 |
2,571 |
514 |
2,874 |
21,348 |
|
59.9 |
97.9 |
99.9 |
95.7 |
46.3 |
97.8 |
82.9 |
|
|
Total rhino land area rewilded (%): |
96.7 |
97.9 |
100.0 |
99.6 |
91.4 |
100.0 |
97.6 |
|
Rhino total population size (n) = |
2,000 |
306 |
145 |
200 |
78 |
153 |
2,882 |
|
Rhino population as (%) of current South Africa = |
14.3 |
2.2 |
1.0 |
1.4 |
0.6 |
1.1 |
20.6 |
|
Number of rhino herds/ subpopulations in system (n) = |
21 |
6 |
2 |
4 |
1 |
7 |
41 |
|
Average number of rhino (n) per herd [population density] = |
95 |
51 |
73 |
50 |
78 |
22 |
61 |
|
Range size per subpopulation (min-max range, ha) = |
100–594 |
750–3,200 |
890–1,605 |
569–806 |
877 |
282–496 |
100–1,605 |
|
Average rhino range size (ha) = |
393 |
944 |
1,251 |
663 |
877 |
367 |
749 |
|
Median (middle value) range size (ha) = |
426 |
1,029 |
1,251 |
614 |
877 |
351 |
758 |
|
Animal stocking density (min-max range, ha/ rhino) = |
3.2–13.7 |
13.8–133.3 |
13.4–35.9 |
8.3–25.2 |
11.2 |
14.8–51.0 |
3.2–133.3 |
|
Average stocking density (ha/ rhino) = |
4.3 |
26.0 |
17.3 |
13.4 |
14.2 |
19.2 |
15.7 |
|
Veld management strategy per rhino subpopulation: |
2-sectional rotational animal stocking |
4-sectional rotational animal stocking |
2 single systems, multiple fire/ burn blocks |
4 single systems, multiple fire/ burn blocks |
1 single system, multiple fire/ burn blocks |
7 single systems, multiple fire/ burn blocks |
|
|
Mean annual long-term rainfall (mm) = |
689 |
300 |
507 |
602 |
454 |
573 |
300–689 |
Case Study No. 2
The CBO commenced in August 2013, was officially registered as a CBO in August 2019 and includes n = 5 white rhino subpop-ulations which totalled n = 306 rhinos at the end of May 2021 (TABLE 2). Review period is approximately 8 years. Environ-ment is the Eastern Kalahari Bushveld Bioregion in Olifantshoek Plains Thornveld, with pockets of Kuruman Mountain Bushveld and Northern Upper Karoo [29], consisting consisting of 7,955 ha of land inhabited by rhino. A total of 97.9% of this land had been rewilded from monoculture livestock farming to a biodiverse mul-tispecies (n = 10) mixture of natural plains game and conserved.
Case Study No. 3
The CBO commenced in 2013, was officially registered as a CBO in February 2021 and includes n = 2 white rhino subpopulations which totalled n = 145 rhinos at the end of July 2021 (TABLE 2). Review period is approximately 8 years. Environment is the Sub-Escarpment Savannah Bioregion in Granite Lowveld, with elements of Phalaborwa-Timbavati Mopaneveld [29], consistingof 2,502 ha of land inhabited by rhino of which 99.9% had been re¬wilded from monoculture livestock farming to a biodiverse mul¬tispecies (n = 14) mixture of natural plains game and conserved.
Case Study No. 4
The CBO commenced in 2011, was officially registered as a CBO in February 2021 and includes n = 4 white rhino subpopulations which totalled n = 200 rhinos at the end of July 2021 (TABLE 2). Review period is approximately 10 years. Environment is the Sub-Escarpment Savannah Bioregion in Granite Lowveld, with el¬ements of Phalaborwa-Timbavati Mopaneveld, consisting of 2,686 ha of land inhabited by rhino of which 3.9% had been rewilded from historically ploughed agricultural lands and 95.7% had been rewilded from historically monoculture livestock farming to a bio¬diverse multispecies (n = 13) mixture of natural plains game and conserved.
Case Study No. 5
The CBO commenced in 2011, official registration as a CBO in progress at time of this study and includes n = 4 white rhino subpopulations which totalled n = 78 rhinos at the end of July 2021 (TABLE 2). Review period is approximately 10 years. En¬vironment is the Central Bushveld Bioregion in Mkhado Sweet Bushveld [29], consisting of 1,110 ha of land inhabited by rhi¬no of which 45.0% had been rewilded from historically ploughed agricultural lands and 46.3% had been rewilded from historically monoculture livestock farming to a biodiverse multispecies (n = 14) mixture of natural plains game and conserved.
Case Study No. 6
The CBO commenced in 2009, was registered as a CBO in March 2021 and includes n = 7 white rhino subpopulations which totalled n = 153 rhinos at the end of November 2021 (TABLE 2). Review period is approximately 12 years. Environment is the Dry High¬veld Grassland Bioregion of SA in both Vaal-Vet Sandy Grassland and the Central Free State Grassland [29], consisting of 2,939 ha inhabited by rhino of which 37.8% had been rewilded from histor¬ically ploughed agricultural lands and 46.3% had been rewilded from historically monoculture livestock farming to a biodiverse multispecies (n = 12) mixture of natural plains game and con-served.
Statistics
Average annual natural mortality rates (Mâ??) was calculated using the overall known naturally mortality (M) figures divided by the net population {[Introductions (I), plus births (B) minus removals (R)] over the period (t) of production at each Case study site}: [Mâ?? = M/(I+B-R) x 100/t]
Similarly, the average annual poaching rate (Pâ??) was calculated using the known overall poaching (P) figures divided by the net population [Introductions (I), plus births (B) minus removals (R) minus natural mortality losses (M)] over the period (t) of produc¬tion at each Case study site: [Pâ?? = M/(I+B-R-M) x 100/t]
The average annual calf recruitment birth rate (Bâ??) was calculated using the known per annum births divided by the number of adult females (F) present in each population at the onset of the year over the period (t) of production at each Case study site: [Bâ??=B/F x 100/t]
The average annual growth rate (Gâ??) was calculated using the an¬nual biological growth rate [annual births (B) minus the annual natural mortalities (M)] achieved per annum divided by the popu¬lation figure present at the onset of the year (Pâ??) over the period (t) of production at each Case study site: [Gâ?? = (B-M)/ Pâ?? x 100/t]
Results
Geographic Scope of Rhino Operations Reviewed
The distribution of the white rhino subpopulations in South Africa is fragmented, all existing in fenced-in, protected areas in either state-owned national parks managed by South African National (SAN) Parks and reserves managed by provincial conservation authorities, or non-state areas comprising of private/ community game reserves, and/ or private ranches, with white rhino regarded as a common species [19, 30]. According to DFFE the total area occupied by SWR within South Africa in 2015 exceeded 49,000 km2 (4.9 Mha), of which approximately 18,000 km2 (1.8 Mha) was private or communal land. The considered “wild” (though fenced-in) SWR numbers were estimated at n = 17,208 by 2015, of which n = 12,273 (72.0%) occurred on state-owned land, and n = 4,735 (28.0%) on private land, whilst the KNP subpopulation was estimated at n = 8,365–9,337 (FIGURE 1). In 2020 the HLP draft report and the IUCN recognised a global population size of n = 10,080 mature animals remaining [3] which included private¬ly ranched populations reported at an estimated modelled (R2 = 0.988) total size of n >8,000 in 2022 (FIGURE 2), thus raising concerns regarding the proposed motions by DFFE with regards to the potential detrimental effect on green or natural capital and biodiversity conservation by the private sector since the private sector now owns more white rhinos than the entire of the protected areas and the rest of Africa accumulative [3]. The positive slight upward turn in numbers of the South African and global SWR pop¬ulations in 2020 (TABLE 1 and FIGURE 1) are being attributed to the growth success of SWR populations on private land (CBOs).

Figure 1: Meta population dynamics of southern white rhino numbers since 1982, respectively for SA, KNP, all private ranches accu- mulative, and for CBO Case study no. 1, data included from [1, 3, 6, 12, 22-23, 25, 32-37]."
Data included from, [1,3,6,12,22–23,25,32–37].
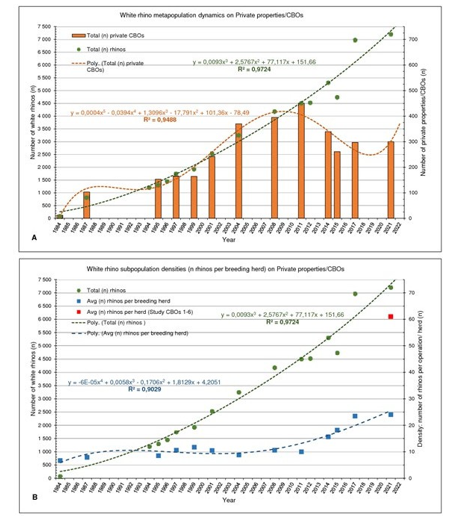
Figure 2: Annual southern white rhino metapopulation dynamics [rhino numbers (n)] on private properties and CBOs across SA; (A) as per number of ranches/ subpopulations (n), (B) average animal density/ number of rhino (n) per CBO subpopulation/ breeding herd, with (![]() ) accumulative average density/ number of rhino (n) for Case studies no's 1-6. Additional data included from [12, 23, 36, 38-40].
) accumulative average density/ number of rhino (n) for Case studies no's 1-6. Additional data included from [12, 23, 36, 38-40].
A trend of steady increase exists in the size of the privately owned populations since 1980 (FIGURE 2). Response rate of questionares successfully retrieved from private rhino owners with the 2015 survey [12] was 28.7% (that is 75/261, representing 1,669,000 ha of land inhabited by n = 5,225 rhino) as per the PROA database of the number of private/ communal properties being identified to have white rhino. Response rate for the 2017 survey was 25.3% (75/297), representing 959,000 ha with n = 4,029 rhinos. A fol¬low-up independent attempt by PROA to acquire the outstanding rhino numbers resulted in an estimate of n = 6,968 , a difference of n = 2,940 rhinos between the two estimates for 2017. Private owners are withholding information due to the exponential rise in poaching since the early 2000s (FIGURE 3). It can be accepted with confidence that the number of rhinos in private ownership recorded with the surveys as from 2004 and after are underesti¬mated, the population be greater than shown in FIGURE 1 and FIGURE 2. If one assumes an average growth of 6.0% per annum off the 2014 base of n = 5,225 white rhino, that will result in n = 6,218 animals on private and communal property, it suggests that n = 2,189 (or 35.0%) of the rhinos were not reported in the 2017 survey.

Figure 3: History of recorded number of rhinos poached per annum (2022 for 6 months to end June), data compiled from [1, 5, 13, 41-42].
A significant decline in the number of privately managed white rhinos in Limpopo Province from 2008 to 2020 (FIGURE 4) can be ascribed to the escalating risk to poaching, 46.9% (174/371) of all recorded incidents across country occurred in Limpopo. Also, the national decline in number of private rhino properties can be ascribed in three-fold to escalating poaching risk, increased se¬curity management costs, and the ban on horn-trade to generate income for covering operational costs. The increase of rhino num¬bers in Northwest and Northern Cape is a dual consequence of less poaching risk (10.5% and 0.8% respectively) and the high-perfor-mance annual growth rates of Case study no’s 1 & 2 in accumula¬tion inhabiting more than n = 2,250 rhinos at the time.

Figure 4: Metapopulation geographic distribution of SWR on private land (CBOs) across SA (years 2008, 2014, 2017 and 2020), data surveys from [12, 36, 38, 43].
Despite CBO registrations and macro-genetic metapopulation ge-netic diversification through gene migration/ gene flow by way of frequent translocations (exchange) and relocations [19, 22, 44-48] acros more than 300 privately managed populations, the HLP draft report [27] claims these rhinos to be genetically inferior and of little to no value to conservation and survival of the species [19,22,44–48]. Such claiming is in direct juxtaposition of review and reports by the IUCN African Rhino Specialists group, which states that the CBOs of Case study no.1 is recognized as a Key 1 population, vital to the continued conservation of South Africa’s SWR population. Operation Description and Intensity Case Study No. 1 Case study no. 1 follows the IUCN’s recommendations for con-servation breeding. The operation controls certain aspects of the rhino’s environment using of a system of large (>100 ha) camps (FIGURE 5), each of which is subdivided into two sister-camps to allow for the rotation of grazing in a manner that attempts to sustain the ecological condition of the veld. When grass growth exceeds consumption during moist summer months, this grass is mown and removed. During dry winter months or during drought periods the rhinos are provided with supplementary feed in demar¬cated locations. Supplementary feeding can make up to 48.0% of the rhino’s daily dietary intake during these periods. Additional feeding is designed to maintain the reproductive condition of the animals and to maintain their general well-being. Access to clean drinking water is ensured throughout the year for all rhinos. Each subpopulation contains multiple dominant breeding bulls to allow for self-choice of own mate selection, thus aligned with natural mating behaviour. General ecological requirements such as ade¬quate shade and shelter, mud baths and rubbing posts are available. The CBO is described as a semi-intensive, semi-free roaming, re¬wilded agro-sustainable biodiversity wildlife management system, being more intensive (restricted) than free roaming “wild” popula¬tions, but less intensive than zoos or most safari parks worldwide (in other words, it is a semi-wild captive breeding operation) mak¬ing it unique in existence.
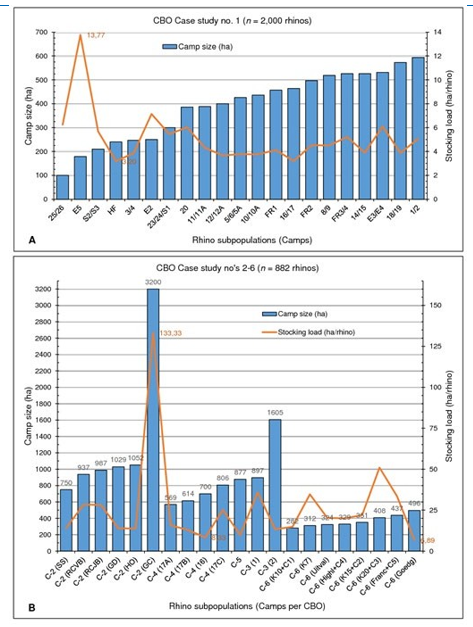
Figure 5: The status quo (2021) stocking density for each white rhino subpopulation as per private CBO studied. (A) Case study no. 1 n = 21 subpopulations, (B) Case studies no’s 2 (C-2), 3 (C-3), 4 (C-4), 5 (C-5), 6 (C-6), n = 21 subpopulations.
Case Study No. 2 The operation is similar in its outlay, strategy and management to that of Case study no. 1, though with differences: (a) camps are generally larger in size (FIGURE 5), all exceeding the mini-mum natural territorial range of 700 ha for the species [49] each of which is (b) subdivided into either n = 2, 3 or 4 sister-camps to al-low for rotational grazing – each rhino thus roams a >700 ha range; (c) all rhinos return passively to a centred 3–4 ha walk-in boma (a separate boma for each subpopulation) every night for safety –boma gates are opened in the morning when the rhinos exit on own account to the roaming fields until late afternoon when the rhinos return on own account lured by a ration of quality animal-feed pellets provided in the evening; (d) the environment is more arid with less fodder, thus daily supplementary feeding contribute up to 70.0%; and (e) the CBO also co-inhabits multiple other wild game species [49]. The CBO is described as intensive, a limited-free roaming, rewarded agro-sustainable biodiversity wildlife manage-ment system, being more intensively managed to Case study no. 1 by way of daily feeding and nocturnal boma confinement for security reasons. Case Study No's 3 to 6 The CBOs are most similar to each other, though different to that of Case studies no’s 1 and 2. A single large semi-free roaming camp used that is not subdivided. Except for that of Case study no. 6, the subpopulation camps mostly exceed the minimum natural territori¬al range, and some also exceeds the minimum natural home range for the species (FIGURE 5). Rotational grazing (veld-rest) accom¬plished by a program of rotational burning of moribund vigour, is done in a series of different block burns within each camp. Winter and drought supplement feeding are provided at random across the camp (no permanent feeding areas), thus the rhinos are more “wild” and less associated with human presence. Although the same breeding principles of Case study no. 1 are followed, lack of daily monitoring allows for less analytical data per individual rhino to be recorded. The CBOs are described as semi-extensive, semi-free roaming, rewilded or protected agro-sustainable biodi¬versity wildlife management systems of special uniqueness, in dif¬ference to Case studies no’s 1 and 2. Management Parameters of CBOs Ecological management of the habitats is also incorporated in the management plans/ BMPs of all the CBOs studied – analysis of the hydrology, climate, geology and soils, landscape, habitats and vegetation of the area. The management strategy followed allows for continual annual analysis of the natural environment (habitats, ecological veld condition, and vegetative carrying capacities) for effective continued best practice animal stocking load and envi¬ronmental management. Management decisions are always made with sustainability in mind. In some rhino camps, analysis of the vegetation determines fire regimes, if any should be followed, to keep the floristic composition productive (healthy eco-functional) and structurally viable. Managerial adjustments include the avail¬ability of different water sources (natural pans and/ or streams) throughout each camp by the addition of either water troughs and/ or the making of earth dams, depending on the geographic outlay. Each camp therefore has several natural water sources available ad lib to the rhino throughout the year. Built water troughs are cleaned weekly and routinely inspected. The habitats inhabited by the resident rhino at the CBO Case stud¬ies fall within that of the native distribution of origin of the species [49, 50]. The environments are controlled however as the rhino are kept in fenced-in rewilded [51] camps for their own protection and to prevent the animals from escaping. It needs to be empha¬sized that the major of protected areas in South Africa (including most national parks and the KNP) and referred to by government and the IUCN as “wild” populations are in fact fenced-in camps (large camps, ranging from <100 ha to 1.98 Mha for KNP), as indicated in FIGURE 6 and FIGURE 7.

Figure 6: Frequency distribution ratio of land area sizes (hectares) inhabited by white rhino populations on protected areas compared to private populations. (A) Protected areas (provincial & municipal, excluding national parks), (B & C) Private properties as for 2014 and 2017, survey data from [12, 36, 38].

Figure 7: Geographic distribution ratio of an estimated 24.0% of the private white rhino metapopulation in South Africa as at end of 2020, data compiled from [23].
The breeding policy breeding policy followed is to allow natural mating to occur within each subpopulation, without human in-tervention other than controlling the subpopulation numbers and stocking densities. To reduce numbers and potential inbreeding, selected sub-adults (2.5–4.0 years age) are removed from their natal subpopulations and either, relocated to new camps, or trad-ed (sold) to other CBOs, game ranches or protected areas. This allows biological macro-genetic metapopulation diversification through gene migration/ gene flow [19, 22, 44, 46-48] and subpop-ulation control, limits inbreeding and allows for further potential genetic diversification (increased genetic integrity) by establishing new mixed breeding subpopulations. Each breeding subpopulation consists out of a minimum of n = 2–4 dominant breeding bulls (n >10 for Case studies no’s 3 & 5), n = 20–30 or more adult females, n = 10–25 or more calves and juveniles and n = 10–25 or more sub adults. The rhinos in each breeding subpopulation are therefore allowed to create their own natural hierarchy and herd structure as in free roaming “wild” conditions. The presence of at least two dominant bulls in each breeding subpopulation, allows breeding females to naturally select their own mate for breeding and to promote heterozygosity. In addi-tion, an average of n = 4–5 or more subordinate bulls are also left in each breeding subpopulation to allow for natural hierarchy establishment and integration into the socio-dynamics of the herd. If becoming sexually active and continues to be accepted in the social structure of the herd, such a bull is allowed by manage¬ment to stay and become an additional replacement breeding bull. Bull selection in each subpopulation is therefore determined by temperament, breeding ability and social integration. Strict mon¬itoring of the performance and/ or socio-dynamics of each herd is maintained. Keeping a studbook and camp listing of each herd aid as further prevention to potential inbreeding. Due to the high reproductive rates accomplished by the CBOs, additional land is constantly bought and added for expansion, e.g., Case study no. 1 commenced with 3,455 ha in 2009 and now in extent of 8,516 ha, with added additions in 2014, 2015, 2016 and 2018, to estab¬lish new breeding herds sourced predominantly from progeny born from within the CBO. Genetic Heterozygosity and Species Integrity Genetic diversity is a very important feature of living organisms. It serves for population adapting to the environment. With increased allelic variation, individuals display adaptive characteristics that suite the environment, so genetic diversity is essential for species survival. Gene immigration/ “gene flow” is the transfer of genetic material from one population to another by migration of individu¬als or gametes. This can alter genetic diversity by changing allelic frequencies in a population. Gene flow is therefore very important to reduce genetic drift and effects and is extremely important for conservation genetics [53] Today, “wild” southern white rhino occur in isolated populations within South Africa, such as the KNP, HiMP and other smaller SANParks, with limited to no gene flow between them. Further-more, when the marked ongoing losses due to poaching at these sites are also taken into consideration, the contraction of these wild populations in the absence of gene flow from other sources, nega¬tively affect the genetic diversity and evolutionary potential of the South African SWR through potential genetic drift. The potential for further loss of allelic diversity in these wild populations over time can however be limited by new management regimes that stimulate gene flow via periodic immigration (introduction) of new individuals, thereby preventing isolation and reducing popu¬lation differentiation, as is used by the private sector. Rhino on private land, unlike their state-owned “wild” counter-parts, are frequently translocated and relocated to establish new seed populations. Translocations on private land are carried out to augment existing populations and/ or remove excess numbers from their populations as a form of population control. These excess rhi¬nos are then sold and translocated to other, new populations at a different geographic site which promotes gene flow amongst pop¬ulations, thereby reducing the potential detrimental effects of in¬breeding depression [54] within the South African southern white rhino metapopulation. The six Case studies assessed in this study showed that the geo¬graphical and genetic origin of the resident rhino populations were diverse, consisting out of rhino sourced originally from both free-roaming “wild” populations and privately managed popula¬tions. The n = 1,511 rhino, founder (F0) animals sourced from off the properties, have been introduced accumulatively to the six CBOs studied (TABLE 3), consisted out of various age classes ranging from one month old to adult, and included both sexes. Of the introductions, n = 1,206 (79.8%) were sourced from other pri-vate owners or game ranches and n = 305 (20.2%) directly from “wild” (fenced-in protected areas) populations including KNP, HiMP, other SANParks and provincial reserves. The introduc¬tions happened at periodic intervals as indicated in FIGURE 8, and some more than once from the same external population. In total, rhino translocated to the studied CBOs were sourced from n = 176 different founder populations (genetic pools), consequently potentially contributing n = 176 different genetic source migra¬tions. Within each CBO these founder members from different geographical sites were also admixed into different breeding popu¬lations, therefore further enhancing the potential gene flow in each breeding subpopulation.
Table 3: Population Parameters and Production Vital Rates of the White Rhinoceros Captive Breeding Operations Studied
|
Parameter |
CBO Case study no. |
Total / Average |
NKP |
||||||
|
1 |
2 |
3 |
4 |
5 |
6 |
|
|||
|
Genetic diversity potential |
Number (n) of Rhino sourced from external populations: (row A) male =, (row B) female =, (row C) unknown sex = |
300 |
48 |
30 |
49 |
12 |
11 |
450 |
? |
|
661 |
118 |
65 |
74 |
43 |
12 |
973 |
? |
||
|
|
|
|
|
|
88 |
88 |
|
||
|
Total number externally sourced (n) = |
961 |
166 |
95 |
123 |
55 |
111 |
1,511 |
351 |
|
|
Percentage sourced directly from wild populations including KNP (%): |
17.7 |
68.1 |
6.0 |
3.0 |
4.0 |
52.3 |
25.2 |
100.0 |
|
|
Population size at time of analysis (n) = |
2,000 |
306 |
145 |
200 |
78 |
153 |
2,882 |
2,607 |
|
|
Number of different external populations founders sourced from (n) = |
95 |
19 |
11 |
24 |
9 |
20 |
178 |
1 |
|
|
Genetic diversity potential: |
Excellent |
Good |
Moderate |
Good |
Moderate |
Good |
Good |
Poor |
|
|
Vital rates |
Total number of known progeny produced (n) = |
1,648 |
172 |
74 |
79 |
61 |
205 |
2,239 |
|
|
Total number of known natural deaths (n) = |
508 |
306 |
8 |
6 |
12 |
30 |
870 |
|
|
|
Average natural mortality rate (%): |
1.43 |
0.86 |
0.55 |
0.25 |
1.15 |
1.19 |
0.9 |
>1.1 |
|
|
Total known number poached (n) = |
32 |
3 |
9 |
8 |
5 |
11 |
68 |
>5,142 |
|
|
Average annual Poaching rate (%): |
0.1 |
0.1 |
0.7 |
0.4 |
0.6 |
0.5 |
0.4 |
>6.0* |
|
|
Average recruitment rate (%): |
30.5 |
29.4 |
24.4 |
14.1 |
25.0 |
32.4 |
26.0 |
<10.0 |
|
|
|
Recruitment rate (min-max %): |
25.9– 43.1 |
12.8– 19.8 |
1.6– 21.0 |
1.8– 24.4 |
11.7– 33.4 |
1.8– 55.6 |
1.6–55.6 |
|
|
Average annual 14-year population growth rate (%): |
7.8 |
12.3 |
11.6 |
5.9 |
10.4 |
9.7 |
9.6 |
-10.2** |
|
|
Last 5-year population growth rate (%): |
7.5 |
12.0 |
11.2 |
8.7 |
9.0 |
7.2 |
9.3 |
-17.0** |
|
|
Annual population growth rate (min-max %): |
-28.8– 21.5 |
6.8– 19.8 |
2.7– 21.1 |
-5.0– 10.9 |
5.1–19.1 |
0.6– 19.6 |
-28.8– 21.5 |
|
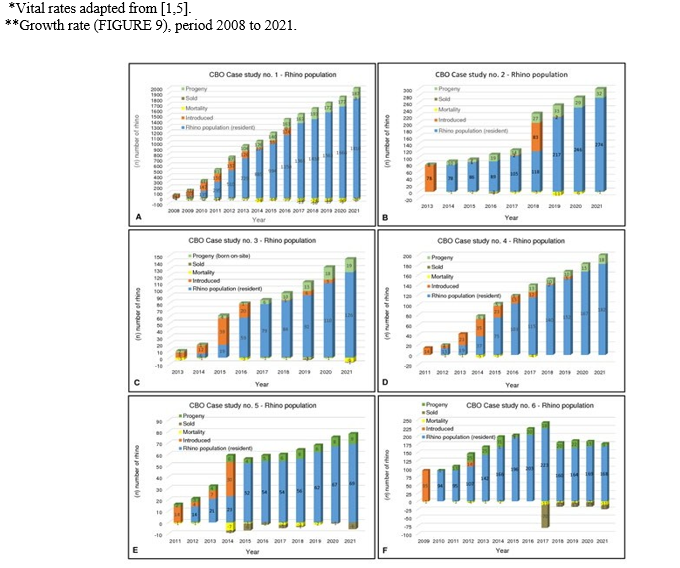
Figure 8: Annual population history indicating performance growth for CBO Case studies no’s 1–6. (A) Case study no. 1, (B) Case study no. 2, (C) Case study no. 3, (D) Case study no. 4, (E) Case study no. 5, (F) Case study no. 6.
Performance of Rhino Populations
Although cognisanze must be taken of the land size of the state-owned protected areas, such as that of the KNP (1.98 Mha) versus that of the non-state owned areas, and the subsequent difficulties reported to achieve operational efficiency in situational aware¬ness, integrity management and access control, when compari- sons of the rhino population sizes, population management and poaching rates on these smaller protected areas compared to that of the KNP, is done [55], the results show that provincial and pri¬vate reserves do significantly better than the KNP itself under the current situation in South Africa (TABLE 4).
Table 4: SWR population sizes (Jan 2020) and poaching rates within four categories of land uses associated With Rhino protection in South Africa during 2020
|
|
KNP |
Other national parks |
Provincial reserves |
Private properties |
Rhino properties excluding KNP |
Governance index |
|
Nmber of white rhinos (n) = |
3,5501 |
360 |
3,5002 |
7,0003 |
10,860 |
|
|
Poaching rates: |
6.12% |
0.30% |
3.10% |
0.50% |
1.30% |
|
|
Free State Province |
|
|
0.0% |
0.0% |
0.0% |
56.0% |
|
Northern Cape Province |
|
0.0% |
0.0% |
0.015% |
0.009% |
58.6% |
|
Eastern Cape Province |
|
0.0% |
0.0% |
0.0% |
0.0% |
67.7% |
|
Gauteng Province |
|
|
0.0% |
0.029% |
0.018% |
82.2% |
|
Western Cape Province |
|
0.0% |
0.0% |
0.015% |
0.009% |
87.6% |
|
North West Province |
|
|
0.466% |
0.029% |
0.166% |
38.8% |
|
Mpumalanga Province |
6.073% |
|
0.110% |
0.132% |
0.114% |
58.9% |
|
Limpopo Province |
0.0047% |
0.30% |
0.027% |
0.250% |
0.175% |
65.0% |
|
KwaZulu-Natal Province |
|
|
2.496% |
0.029% |
0.814% |
71.3% |
1Numbers for KNP declined to 2,607 at end of 2020.
2Numbers in Provincial reserves are most likely over-estimated.
3Numbers on Private properties are most likely under-estimated.
Rates with in provinces contribute relatively differently to coun-trywide poaching rates associated with the land uses. Poaching incidences do not associate with an index of governance quality. Data adapted from [55].
Data provided from private ownership for the six Case studies/ CBOs was analysed and the following vital rates assessed (TABLE 3) for comparison to data available for the “wild” SWR population in the KNP [1].
Natural annual population growth for white rhino is 8.0–12.0% per annum under ideal circumstances [15, 33, 56]. The average annual population growth performed by the management of the private rhino subpopulations since the first ownership in 1976 to 1987 (12 years) is 14.4% (FIGURE 2) with extreme deviations in the early years, and since 1988 to 2012 (25 years) is 8.6% (range 1.9–23.1%: end of 1st quartile value 5.2%, end of 2nd quartile value 6.7%, end of 3rd quartile value 11.2%). The annual growth rate for the privately managed white rhinos accumulative (CBOs included) for 2013–2020 was 9.0%.
Annual biological growth performance achieved by the studied CBO Case studies respectively (TABLE 3 and FIGURE 8) mea¬sure as follow: Case study no. 1 is 7.83% (average annual Re¬cruitment Rate [RR] 30.46%, average annual Mortality Rate [MR] 1.43% and average annual Poaching Rate [PR] less than 0.10%) over 14 years; Case study no. 2 is 12.34% (average annual RR 29.41%, average annual MR 0.86% and average annual PR less than 0.10%) over 9 years; Case study no. 3 is 11.63% (average annual RR 24.41%, average annual MR 0.55% and average annual PR less than 0.70%) over 9 years; Case study no. 4 is 5.87% (av-erage annual RR 14.11%, average annual MR 0.25% and average annual PR less than 0.40%) over 11 years; Case study no. 5 is 10.40% (average annual RR 25.0%, average annual MR 1.20% and average annual PR less than 0.60%) over 11 years; Case study no. 6 is 9.73% (average annual RR 32.24%, average annual MR 1.20% and average annual PR less than 0.50%) over 12 years.
Average annual growth rate for the six white rhino CBO studies with n = 2,882 rhinos at the end of the study period, combined over 14 years is 9.6% (TABLE 3) despite being held semi-intensively, which is in line with the 9.0% (8.6% growth plus 0.4% off-take [4] measured for the entire private white rhino population nationally (FIGURE 2). In addition, the CBO Case studies assessed, showed a loss of their populations due to poaching of less than 1.0% an¬nually.
The annual growth rate for the KNP white rhino population calcu- lated from the data in [1] was negative from 2008 to 2020 at minus -10.2% (range -26.4–2.3%: median -4.5%), in comparison with the overall positive trends (+9.6%) found for privately managed rhino populations (FIGURE 9).

Figure 9: White rhino population trends since 2008, as for private CBOs and for the protected KNP (![]() Upper curve) for CBO Case studies no’s 1–6 accumulative (n = 2,882 rhinos in 2021), +9.6% average annual increase in rhino numbers). (
Upper curve) for CBO Case studies no’s 1–6 accumulative (n = 2,882 rhinos in 2021), +9.6% average annual increase in rhino numbers). (![]() Lower curve) for KNP (n = 2,607 rhinos in 2021), -10.2% average annual decline in rhino numbers).
Lower curve) for KNP (n = 2,607 rhinos in 2021), -10.2% average annual decline in rhino numbers).
Discussion
This study emerged following the release of a High-Level Panel [HLP] draft report [27] in 2021 by the South African minister of DFFE proposing the possible closure and disbanding of South Af-rican private game ranching and disinvesting in captive breeding operations (CBOs) for southern white rhinoceros (SWR) popula-tions. The alleged potential detrimental effect by the private sector to the conservation and sustainable survival of the species, as al-luded to by the HLP draft report for rhinoceros, is in direct and sig-nificant contradiction to the findings of this study and representing the greater of the remaining global SWR species population [27].
Species Integrity, Metapopulation Management, National Population
All extant southern white rhinos, irrespective of being managed as “wild”/ fenced-in state-protected populations, or as private and captive bred operations, are the progeny from the same single source, the same bottleneck gene-pool of less than <50 remaining animals from the former Mkuze Game Reserve (now HiMP) [4, 6, 24]. The current KNP white rhino population was re-introduced in October 1961 and again in 1987 from Mkuze. Since the SWR populations in the state-owned protected parks are predominant¬ly enclosed and SANParks do not routinely introduce new rhino/ genes into the parks (an action refered to as metapopulation man¬agement), these populations are therefore potentially predisposed to the effect of genetic drift, loss of allelic diversity and inbreeding depression over time. All protected and wildlife entities in South Africa today (SANParks, provincial reserves, conservancies, wil-derness heritage areas, trans-frontier parks, ranches, and farms) are fenced-in, fragmented, isolated systems (at different scale from <100 ha to 1.98 Mha) with restricted and/ or altered animal movement and different extend of reduced species genetics [48]. White, and black Diceros bicornis rhino, Lichtenstein’s hartebeest Alcelaphus lichtensteinii, oribi Ourebia ourebi, roan Hippotra-gus equinus and sable H. niger had been re-introduced to KNP as herds, some as small as n = 6 individuals per species from a single source from another fragmented and isolated (fenced-in) location. Most of these species had never been reinforced by new gene immigration/ gene-flow as to enhance its genetic integrity (heterozygosity).
To the contrary, the frequent commercial trade and subsequent translocations (gene-flow) between the private SWR subpopula-tion operations (game ranches), and especially since 1991 [6] with the legislation of the Game Theft Act and allowing for legal pri-vate ownership, fits the principle of metapopulation management and subsequent improvement of heterozygosity and species integ¬rity [19, 30, 44-48]. Cumulative gene flow for the six CBO Case studies accounts for metapopulation management between n = 176 different SWR subpopulations/ genetic pools, up to n = 24 and more different geographic sources per subpopulation. This gene flow narrative to be extrapolated with frequent trade and translo¬cation between approximately n = 390 different private subpopu¬lations in South Africa.
Notwithstanding the effects, that the former genetic bottleneck holds for the species survival of the SWR, the health of global population numbers also needs be emphasized. The first survey of white rhino on private land as cited in [12] was undertaken in 1987 [57] and followed by many more surveys [12, 23, 36, 39-40, 43, 58-62]. According to to the latest published IUCN report [3] the African SWR population numbers were as follows for 2012 n = 21,320 (of which n = 18,933 occurred in South Africa); 2015 n = 20,560 (of which n = 17,208 [16,549–17,863: 90.0% CI] occurred in South Africa), 2017 n = 18,067 (17,212–18,915: 90.0% CI), of which n = 15,625 (90.0% CI) occurred in South Africa (FIGURE 1).
Examination of the listed poaching statistics of the supplemen-tary information provided for this IUCN report, showed that of the n = 6,144 SWR reported as poached in South Africa during 2012–2017 (FIGURE 3), n = 5,864/6,144 (95.0%) were: [n = 643/668 (96.25%) in 2012, n = 966/1,004 (96.23%) in 2013, n = 1,161/1,215 (95.56%) in 2014, n = 1,113/1,175 (94.72%) in 2015, n = 1,011/1,054 (95.92%) in 2016, and n = 970/1,028 (94.36%) in 2017]. Unfortunately, no further subspecies breakdown of the annual poaching statistics were available at the time of this report but following the trend from the previous years, and taking an av¬erage of 95.0% of annual poaching losses being attributed to SWR for South Africa, the following estimates can be deduced, namely a total loss of: n = 769 (estimated n = 731 for a minimum 95.0% trend) in 2018, n = 594 (estimated at n = 564 for a minimum 95.0% trend) in 2019, and n = 394 (estimated n = 374 for a minimum 95.0% trend) in 2020. Therefore, totalling an estimated further loss of at least n = 1,669 SWR in South Africa alone due to poaching since 2017 to the end of 2020.
Captive Breeding Operation (CBO)
CBO programs are recognized as important components of con¬servation strategies for endangered/ threatened game species [63, 114-115] and has the potential to act as genetic and demographic reservoirs to reinforce wild populations. In accordance with CITES Resolutions Conference 10.16 (Rev. CoP11, 2000): Captive bred refers to specimens or offspring born or otherwise produced in a controlled environment of parents that mated or otherwise trans¬mitted their gametes in a controlled environment. In accordance with NEMBA and/ or TOPS, the following definitions "apply:"
(A) CBO
Means a facility where specimens of a listed threatened or protect¬ed animal species are bred in a controlled environment for conser¬vation purposes.
(B) Bred in Captivity
Means the offspring born or otherwise produced in a controlled environment of parents that mated or otherwise transmitted their gametes in a controlled environment, as described in CoP11.
(C) Controlled Environment
Means a camp designed to hold specimens of a listed threatened or protected species in a way that, i) prevents them from escaping, ii) facilitates human intervention or manipulation in the form of the provision of food and water, artificial housing, or health care, and iii) facilitates the breeding or propagation of a listed threatened or protected species.
(D) Kept in Captivity
Means that the species is kept in a controlled environment for a purpose other than transfer or transport, quarantine, or veterinary treatment.
(E) Bred in Captivity
As defined in Article I, paragraph (b) of the Convention, (CoP11) – means born or otherwise produced in a controlled environment and applied only, if parents mated or gametes were otherwise transferred in a controlled environment, or the parents were in a controlled environment when development of the offspring began.
(F) First-Generation Offspring (F1)
Are specimens produced from parents at least one of which was conceived in or taken from the “wild”.
(G) Second Generation Offspring (F2) or subsequent generations (F3, F4 etc.) – are specimens produced in a controlled environment from parents that were also produced in a controlled environment.
As per the draft policy position document of DFFE [16, 27] the following important terms have not been defined, whereas Wildlife Ranching South Africa’s definitions are as "follows:"
(H) Conservation
Quoted “of elephants, lions, leopards, and rhinoceros is not about striking a balance between the well-being of people and wild an¬imals [64]. Conservation is about putting people first and man¬aging all renewable natural resources, including big five wildlife, responsibility for the benefit of humanity. The responsible con¬servation management of elephant, lion, leopard, and rhinoceros must involve both ecological and economical sustainably for the socio-economic benefit of our people as supported by the South African Constitution”.
(I) Conservation Area Management
Quoted “is where wildlife is positively managed, produced and sustainably utilized for the socio-economic and environmen-tal benefit of people. The creation of wealth from responsible or sustainable wildlife management, production and legal trade in wildlife and valuable wildlife products is promoted and facilitated through responsible conservation management. The conservation management of wildlife should not be confused with protected area or preservation management of wild animals as they have very different management objectives. Conservation management supports responsible sustainable use of all natural resources, does not prevent the use of wildlife by man but protects these resourc¬es against the abuse, pollution, erosion or their wasteful destruc-tion”.
(J) In protected or Preservation Management Areas
Quoted “wildlife is negatively protected, often at the expense of people, the sustainable use of these renewable natural resources is prohibited and the creation of wealth from the legal trade in wildlife and wildlife products is not facilitated and often denied”.
(K) Economic Sustainability
Quoted “of a wildlife enterprise means that this business entity is economically self-sustainable, covers its own development and management costs and can survive, prosper or grow on its own ability to generate wealth. “According to the IUCN AfRSG and a later standard by the captive breeding community.
(L) Semi-Wild Populations of Rhinos
occur mainly in small (<1,000 ha) areas, either in or out of the historical range of the taxon, and they live at a compressed density and spacing, requiring routine partial food supplementation and a high degree of management, but breed naturally.
(M) Captive Populations of Rhinos
usually occur in small to very small areas (<100 ha), either in or out of the historical range of the taxon, and they have a compressed density and spacing, requiring partial or full food supplementation with frequent husbandry and veterinary intervention, and have a manipulated breeding system. In such situations, rhinos may have controlled access to limited areas of natural habitat.
(N) Key 1 Population Population
(n) increasing or stable and n >100 animals, also a pop¬ulation of rhinos whose survival is considered critical for the wider survival of the sub-species.
Important to note that the camp sizes of all subpopulations in the six CBO Case studies, as shown in TABLE 2, are greater than the maximum 100 ha cap defined for captive populations of rhinos.
White Rhinoceros Species Performance
The white rhinoceros is a relatively adaptable species able to sur¬vive in a variety of natural habitats from grassland to savanna and inhabit areas with mean annual rainfall ranging from 300 to 1,500 mm per annum. Juvenile mortality rates during the winter months on the Highveld are however high, which is thought to be due to a combination of low temperatures and poor grazing quality [50, 65-66]. Theydo not appear to compensate for seasonal declines in food quality by switching to other fodder species or increasing the number of species eaten, and may instead draw on fat reserves during the dry season [67] or if possible, feed higher-up in the cat-ena where reserve grazing of taller, but palatable decreaser grass species may occur. The poor response of white rhinos to tempo¬rarily adapt its feeding during drought or sparse grazing times of¬ten results in mortalities, especially in poorly managed protected areas, as experienced by the drought in 2015/ 2016 [26]. Better ecological management and provision of sufficient supplementary feeding on private white rhino CBOs contributes to sustaining an effective rhino population growth at an average of 9.0% per an¬num.
Inbreeding is generally prevented by the calves either leaving their mothers, or being pushed away by a breeding bull, when between the age of 2.5–3.5 years. The calves then join up with other adult females and/ or sub-adults, subsequently dispersing into new areas. Individuals of all ages have been recorded to disperse in search of better-quality graze and roam distances of up to 40–50 km during drought conditions [68-69]. Environmental barriers however may inhibit their dispersal. Males have non-overlapping territories which are known to range from 700–1,400 ha in typical savannas, and the boundaries of their home ranges are commonly aligned with topographic features such as rivers, watersheds, or roads [50]. Geographic translocation dispersal of white rhinos into multiple subpopulations by the private game industry play a vital role in overcoming the movement limitations set by natural and geographic barriers.
Analyses undertaken by the IUCN AfRSG indicated an average growth rate of the national white rhinoceros population of 7.1% from 1991 to 2012 [17, 34, 71] also see FIGURE 1. Several key events apparently contributed to a rapid increase since the all-time low c.1895, which include the development of chemical capture drugs, translocations, and policy changes both locally and inter-nationally, limited sustainable trophy hunting since 1961 [4, 24] private ownership and live sale auctions. These have until recent-ly created economic incentives for private ownership, thereby encouraging the expansion of rhinoceros range and numbers and significant numbers of white rhinoceros being translocated from “wild” populations to smaller secure areas where the animals are subjected to rewilded agro-sustainable biodiversity wildlife management and intensely protected against poaching. Poaching of privately owned white rhino being 10.0–20.0% compared to 60.0–80.0% in the government protected KNP. As stated by the NDF from the Scientific Authority [31] the future trend in the na-tional population is unpredictable, and could increase by 1.9% or decrease by 3.9% after 5 years depending on the poaching scenar¬io modelled. The -10.2% decline trend (FIGURE 9), and with a 75.0% loss since 2011 of the KNP population [1] emphasize global reality and the high importance of the privately managed rhino populations, which grow positively at average 9.0% per annum (FIGURE 9), and despite a sustainable national annual hunting off-take quota of 0.4% [4].
White Rhino Management and Conservation Narrative
The continuing loss of rhinoceros to poaching for their horn is currently the major threat to the survival of the species. Poach¬ing increased each year from 2006, reaching a peak in 2014 when an estimated 6.5% of South Africa’s wild population was poached (FIGURE 3). In order for the current anti-poaching efforts to continue, significant financial inputs from external sources are required. The response to the threat has however been dispropor¬tionately high, removing much needed conservation funding from other species [27, 115].
In 2018, proportionally 72.0% [31] of the national white rhinoc-eros population was generally managed within state-protected fenced-in areas (52.0% in the fenced-in KNP), the national popu-lation with off-takes translocated in terms of ecological metapop¬ulation management plans, mostly to private game ranches [31]. A national white rhinoceros strategy was approved in 2000, and in December 2015, a national biodiversity management plan (BMP) for white rhinoceros was gazetted for implementation in terms of NEMBA. This plan was to form the basis for greater coordination between existing and future plans and is informed by the National Strategy for the safety and security of rhino populations in South Africa as well as the Rhinoceros Issues Management Report. The current HLP draft report [27] by its proposal to reserve investment of private rhino operations and 57.0% of the national white rhino population deviates markedly from both the BMP as well as the findings of the Scientific Authority’s non-detriment finding [31]. Since 2010, the South African government has launched a variety of initiatives in collaboration with various stakeholders to address the poaching threat and ensure the long-term conservation of the species, and in 2014 cabinet adopted an integrated four-pronged approach to curb rhinoceros poaching.
The data from the national rhino surveys referred to, and as shown in this study indicate most likely failure by government to secure the survival of its white rhinoceros population, whereas the data from the private rhino subpopulation operations indicate signifi¬cant potential to save the southern white rhino from possible ex¬tinction, should government not proceed with the closure of as proposed by its HLP draft report.
SWR is listed as protected in terms of Section 56 of NEMBA and various provincial ordinances and acts provide further legislative protection. Permits are therefore required to undertake a variety of activities in relation to rhinoceros, e.g., hunting, keeping, selling and other forms of direct use. Legal off-take include management removals of animals and trophy hunting. An estimated 1.4% of the national herd is translocated live from state-protected areas an¬nually [31] and mostly to private game ranching operations and CBOs. Between 2005 and 2016 a total of n = 774 live white rhi¬noceros were exported internationally from South Africa, 33.0% of the exports was for re-introduction purposes, 27.0% to zoos, and 26.0% to breeding facilities. The main destination countries were Namibia (38.0% of the exports), China (32.0%), and Botswa¬na (7.0%) [31].
Legal Rhino Trade
A moratorium to prohibit any sale of rhino horn or horn products within South Africa was implemented in February 2009. The mor¬atorium was a temporary measure to afford DFFE an opportunity to develop and implement permanent measures aimed at eliminat¬ing the illegal international trade in rhino horn. The moratorium was set aside by the high court of South Africa in November 2015, thereby rendering the domestic trade in rhino horn within the bor¬ders of the country legal again. The amended norms and standards for the marking of rhinoceros and rhino horn and for trophy hunt¬ing purposes (published in April 2012) require that conservation officials attend all rhino hunts. In addition, the norms and stan¬dards require that an official must attend all dehorning activities. The regulations further require that a DNA sample must be col¬lected from each animal, as well as from both horns, and all DNA samples are stored on the RhODIS database to ensure traceability. The system is well managed and rhino horn stockpiles are regu¬larly audited.
As determined by [73] the mass of rhinoceros horn that could be obtained from CBO production varies from 5,319–13,356 kg per annum and the amount of horn lost to poachers for the period 2012–2016 at 3,781–5,933 kg/year (average 5,718 kg per annum).
Currently live white rhino is listed as CITES Appendix II therefore may be traded, yet the inert horn is listed under Appendix I and may not be commercially traded. It makes no economic or conser¬vation sense for an inert or non-living horn to have a higher CITES listing or protection than the living animal.
Poaching
Rhino poaching, specifically in the KNP has disrupted the ability of SANParks to achieve its contribution to South Africa’s conser-vation targets for 2020 [1, 3, 31, 35, 73]. The counter reality of sus-tainable production wildlife management needed for the wealth of Africa’s people and poverty to fit the United Nations 2030 Agen¬da for Sustainable Development [80] are clearly emphasized and quantified quantified by [74-75] quote “Our planet is not to be conserved simply by locking away 30% by 2030 or 50% by 2050 from human use, but rather by managing 100% for sustainable human benefit”.
Achieving targets such as annual growth rates of 5.0% is now deemed less feasible for white rhino “wild” populations in the current continual poaching onslaught [1, 3, 24, 32, 36, 76]. In-ternational growth rates for captive white rhino populations are similarly reported as showing negative annual growth rates (-3.5% as a percentage of the entire captive population).
Contrary to both the protected area populations as well as interna¬tional intensive CBOs [33] the semi-intensive/ semi-wild private CBOs across South Africa has achieved average growth rates of 9.0% and has lost less than 2.0% of its populations to poaching per annum.
Trade bans, especially on ivory and rhino horn, has multiforcively indicated to fuel the fires of poaching, criminal syndicates, illegal or black-market trade, along with corruption associated with cer¬tain NGOs, politicians, and government officials. Trade bans are believed to be the cause of the poaching pandemic or the Rhino War [77].
Hunting
Legal and regulated hunting as assessed and argued by [4] has added positively to the sustainable-use conservation of this rhino species. The introduction of trophy hunting of adult white rhino bulls started in 1968 when there were only n = 1,800 animals [4].
It is estimated that the direct contribution of trophy and biltong hunters (all game species included) in 2016–2017 to the South African economy was ZAR 13.6 billion ($909 million), also the indirect and induced impact need be added [Van der Merwe (2018) as cited as cited in [64]. Between 70.0% and of trophy hunters’ spending takes place in the area of the hunt – in addition, hunting creates jobs, particularly in rural areas where employment is most needed. In three South African provinces by 2017, hunting created 31,500 jobs [64].
It was only after the first wildlife auctions in the late 1980s (FIG¬URE 10) that rhinos began to realise their commercial market value, incentivising private owners to also bring the rhino pop¬ulation up through breeding [78-79]. Rhino numbers and range then expanded considerably from this point. According to [24] the simultaneous development of more incentivising legislation (not by design!) around the ownership of wildlife saw the white rhino population grow to n >4,000 animals on approximately n = 400 private properties in South Africa by 2008 (FIGURE 2).

Figure 10: History of live auction sales value for white rhinos in South Africa. Data from Eloff and Cloete & Taljaard as cited in Dr F Cloete, Head: Commercial Agri Finance, Agri Credit Solutions, South Africa, and 28 Aug 2021.
Prior to 2005 and average of 0.76% of the national white rhino population were hunted annually, from 2005 until 2012 it was 0.67% per annum, and since 2013 to present 0.40% per annum [4].
Trophy hunting selectively removes surplus and non-breeding adult males, whilst generating important revenue for private and state conservation (while poaching targets animals of all ages and sexes). Legal hunting, combined with the impact of poaching, has not yet reached a level where it has caused a cessation in popula¬tion growth [4, 24].
Private Rhino Ranching
Due to the significant economic benefits of hunting to game farm¬ers (approximately $19 million over the period 2004–2008), to¬gether with live sales, the private sector has increasingly stocked white rhinos, effectively maintaining rapid meta-population growth, and contributing to the expansion of the species’ range by approximate 18,000 km2. The private sector in South Africa now conserves more rhinoceros than there are black and white rhi¬noceros in the whole of the rest of Africa. Live sales of surplus animals to the private sector have also been highly beneficial to conservation agencies, generating vital conservation revenue and preventing overstocking in established subpopulations.
In 2012 suggestions that South Africa would consider submitting a trade in rhinoceros horn proposal to the 17th CoP to CITES saw an immediate temporary recovery in the average price for a white rhinoceros [31]. Due to the increased rate of poaching, the cost of rhinoceros se-curity has increased substantially in recent years. At the same time, demand for trophy hunting has been declining while the in-ternational sale of legal rhinoceros horn remains prohibited under CITES. These factors have contributed to a negative shift in the cost benefit ratio of owning wild white rhinoceros and leading to a reduction in the live sale price since 2016 (FIGURE 10).. Income of the three largest rhinoceros sellers earned from the sale of white rhinoceros has reduced from a total of ~ZAR 100 million in 2009 when n = 370 rhinoceros were sold, to ZAR 20 million in 2014 when only n = 60 was sold. Furthermore, between 2009 and 2012 there was a reduction in the average price of white rhinoceros, from ZAR 365,000 per animal in 2009 to ZAR 258,000 in 2012, and less than ZAR 180,000 since 2019. Total loss of revenue from 2009 to 2012 alone is estimated at ZAR 373 million [31].
Reduced introduction of rhinoceros to new areas is expected to result in a significant decline in the metapopulation growth rate and the total population size, should the private rhino numbers be removed from the equation/ graph in FIGURE 1. A ripple effect expected of loss of financial income to the conservation authorities that rely upon funds generated from rhino sales to the private sec¬tor to conserve rhinoceros in the state-protected areas, as outlined by the Scientific Authority in the rhino [31].
The most important contribution made by privately held rhinoc¬eros CBOs and related management practices, as described in the Case studies herein above to the positive conservation of rhinoc¬eros in South Africa, and entirely for the owner’s own cost and personal risk, are still to be acknowledged both nationally and in¬ternationally.
It deserves to be mentioned again that the white rhino population at CBO Case study no. 1 is recognized as a KEY 1 population by the IUCN SSC’s AfRSG, and making a significant contribution to continental white rhino conservation. The CBO has successfully bred (F1), and (F2) generations, a total of n = 1,627 (as at end of May 2021) white rhino calves in a 14-year timespan.
Macro-Genetic Metapopulation Species Conservation Man-agement
Metapopulation management is a concept still needed to be defined for the uniqueness of the southern African context. Both practise and scientific studies indicate the private conservation model of frequent trading and translocation of individual animals across habitat and environmental boundaries, and between fragmented (fenced-in) subpopulations (which include SANParks, provincial and municipal protected areas, and private ranches), to have great-est positive effect restoring formerly bottle-necked and lost genetic integrity of most game species [52].
Recent studies of more than n = 4,000 buffalo Syncerus caffer, from n = 37 subpopulations [81-89] revealed the subpopulations from n = 22 private ranches to have greater genetic heterozygosity than the fenced-in KNP population. Thus, indicating enhancement ob¬tained from metapopulation gene flow as a result from private live-trade and frequent translocation between private subpopulations. The same had been conquered through scientific research also for roan and sable [90] and ecologically for bontebok Damaliscus pygargus pygargus [91].
Furthermore, South Africa is the only country on the Continent af¬ter 2012 to 2018, to have managed to improve the genetic integrity of the national population of sable, as per number of hunted qual¬ity trophies entered in the Safari Club International (SCI) Trophy Record Register: n = 153 trophies from South Africa, n = 18 from Zambia, and less from the other countries. The South African tro¬phies were mostly hunt on private game ranches [92-93] indicat¬ing the enhanced impact of private game ranching and fragmented metapopulation management restoring lost genetic integrity of ex¬ploited “wild” populations.
Multiple white rhino DNA tests recorded with Onderstepoort Vet¬erinary Genetics Laboratory are still to be assessed, the outcome expected to conquer with that for the other game species above.
Biodiversity Adaptation (Environmental Change)
Due to climate change, the major of transformed land can never be restored to the previous pre-transformed biodiversity status, but can be rewilded to a different new, and improved agro-biodiversi-ty wildlife status. Old, cultivated agriculture lands on private game ranches are rewilded to productive soil, which sustain a new but different floristic biodiversity. The new habitat supports a new and improved animal biodiversity, and contribute increased green eco-nomic production compared to the former cultivation [48, 94-98]. The positive contribution of the private game sector to sustainable biodiversity and rhinoceros conservation are mostly misinterpret¬ed and not recognised.
Global Concept and Management
An increase in rhino poaching since 2008 occurred despite the international ban on the commercial trade in rhino horn, and nu-merous law enforcement measures implemented in South Africa, which means that current protection measures of the protected area rhino populations have limited effectiveness. A certain economic value could be derived from international trading of horn that are lost and could be allocated to rhinoceros protection [31].
As a result of the continued increase in the illegal trade in horn and the apparent failure of the CITES trade ban, there have been calls from various segments of the conservation community, as well as a plethora of peer-reviewed papers recently published in the scien¬tific literature argue for a legal trade in rhinoceros horn [4, 6, 25, 31, 64, 76, 99-102]. Recommended that the CITES CoP seriously explore the merits of alternative regimes for rhinoceros horn trade, which involve more scope for legal trade than allowed under the presently applicable regime.
The white rhino NDF of the Scientific Authority concluded: (a) that legal international trade in live rhinoceros to appropriate and acceptable destinations and the export of hunting trophies poses a low risk to the survival of the species; (b) that continued legal hunting is essential for the conservation and protection of rhino; (c) it is highly unlikely that the investment in the protection of rhinoceros emanating from current financial sources (government, external donors and private rhinoceros owners) can be sustained in the long term; (d) a legal trade in rhinoceros horn as an alternative source of funds should be explored; (e) the export of wild-sourced rhino horn for non-commercial purposes and horn sourced from captive breeding facilities that are registered in accordance with CITES Resolution Conf. 12.10 (Rev. CoP15) and meet the CBO criteria, as already approved by the Scientific Authority, will not be detrimental to the survival of the species in the wild. This con¬clusion contradicts the latest proposal by the minister [103] and the HLP draft report of closure of the private rhino CBOs currently contributing to the protection of more than 60.0% of the global white rhino population.
The HLP report’s vision falls short of an achievable strategic ob-jective for the conservation of the SWR. It focuses on the protec-tion of these animals on only one land use option, rather than the positive management of agro-wildlife rewilding [2, 48, 51, 104] for the socio-economic and environment benefit of our people on a variety of land use options that may be used for wildlife conser- vation [64].
South Africa is fast approaching the limit of available habitat for white rhino on state-owned land. This means that in order to con¬tinue to grow the species, new habitat within South Africa or the expansion of existing ranges in other states will be required soon.
The continued growth and expansion of the rhino populations and range through the introduction of herds in available new areas are therefore reliant on the private sector and communities making their land available for the introduction of rhinos sourced from protected areas and privately owned lands. The incentives for pri¬vate landowners and communities to make their land available are mostly economic driven, including potential live sales from pro¬ductive hers, eco-tourism and sustainable hunting. Due to the high levels of poaching and therefore the risks associated with the own¬ership of rhino the economic incentives are becoming outweigh by the costs relating to interventions required to secure rhino popula¬tions and has resulted in disinvestment of many rhino custodians as well as the establishment of more intensive protection zones and/ or captive breeding operations in South Africa, whereby a large number of rhino can be kept in areas small enough to provide more effective protection and security [63].
Conclusion
The rhino population management dispute under the pressure of human growth, came in a new era of shift of thought and practise from biodiversity conservation towards sustained-use conserva¬tion with emphasis on species integrity [64, 105-107]. The major of private rhinoceros CBOs in South Africa, as for the six Case studies herein above are rewilded [48, 104]. Agro-sustainable bio¬diversity wildlife conservation systems either being semi-exten-sive/ semi-free roaming/ semi-wild, or semi-intensive, sustainable management.
This study found similar findings, which further supports the no¬tion that, rather than discounting the private sector and their suc¬cessful contributions towards rhino conservation and promoting them to disband their rhino populations, they can provide key in¬sight in alternative viable conservation strategies and management systems in response to the current southern white rhino’s plight for the survival and continued conservation. A key possible option would be to improve rhino security in the KNP by establishing rhi¬no zones of reduced land size with higher rhino densities, similar to the populations found in the private reserves and that the “wild” rhino in the KNP could similarly benefit from these being in these intensive protective zones [48, 104]. A recent statement released by the DFFE on 8 February 2022, now suggests that SANParks is investigating the feasibility of additional actions such as establish¬ing additional founder populations outside of the KNP, which is in direct contrast to the recommendations given by the Department in the HLP draft report [27].
Legal hunting of white rhinoceros has been beneficial to the con-servation of the species in South Africa through expansion of its range and the maintenance of a rapid population growth, especial¬ly on private rewilded rangeland. Due to the significant economic benefits of hunting to game ranchers [4], together with live sales and ecotourism, the private sector has increasingly stocked these animals. This has contributed to the expansion of the species’ range and has maintained a positive annual population growth of 9.0%, though still slightly short to the nett balancing of the mi¬nus -10.20% annual decline suffered with the KNP population. However, the current prohibition on the commercial internation¬al trade in rhino horn can be viewed as a missed opportunity for beneficiation of owning and protecting rhinoceros [31]. Privately owned game farms have contributed significantly to white rhi¬noceros conservation, with approximately 57.0% of the national herd (more than >7,000 animals in 2020, currently projected at >8,000 [R2 = 0,988]) kept on approximately 18,000 km2 of pri-vately owned land.
Southern white rhinoceros as a species is conservation dependent, occurring solely in protected areas and on private game ranches, but it is tolerant to local human activity and can be ranched un¬der rewilded semi-intensive and semi-extensive conditions. Un¬der these conditions, where the density of animals is higher and regular anaesthetic procedures for management purposes and/ or translocation are likely to increase stress levels, there is no de¬tectable difference in cow fertility [108-109]. Also, [110] found that faecal glucocorticoid metabolite (fGCM) levels do not differ between ranched and free-ranging adult rhino individuals, but rou¬tine dehorning procedures do result in short-term stress responses that dissipate after 72 hours.
Despite CBO registrations and macro-genetic metapopulation ge-netic diversification through gene migration/ gene flow by way of frequent translocations and relocations [19, 22, 44, 46-48] across more than n = 390 privately managed white rhino populations (FIGURE 2), the HLP draft report insubstantially (with no scien-tific support) claims these privately ranched animals to be genet-ically inferior and of little to no value to future conservation and survival of the species.
However, summarised parameters from the six CBO Case studies are as follow:
• These CBOs house in total n = 2,882 (2020–2021 as per end date of respective study) white rhinos which is 20.6% of the estimated working national South African white rhino population as of the end of 2020, inhabiting a total land area size of 22,762 ha.
• Average (large) camp size per breeding subpopulation is 749 ha (range 100–1,605 ha), the minimum average natural territory size for “wild” white rhinos is 700 ha.
• In total 97.6% of the land inhabited by these CBOs are rewilded (20.4% from previously ploughed cropland, and 82.9% from pre¬viously alien and/ or monoculture livestock farming).
• Five of the six rhino CBOs studied shared its natural habitat with other multi-species wildlife. "All six operations studied has the following best practice ecolog¬ical strategies in common:"
• semi-free roaming systems, with partial supplement feeding for optimal health and reproduction;
• n = 2–10 adult breeding bulls per subpopulation, allowing breed- ing females self-choice of natural selection of mating partners;
• n = 3–5 or more sub-adult bulls in each subpopulation to allow for the natural establishment of social hierarchy;
• ecological veld management either by: (i) rotational grazing of breeding herd across 2–4 sister camps, or (ii) a programme of mul¬tiple fire/ burn blocks per camp;
• maintain average population growth rates around 9.6%, com¬pared to <2.0% for most protected parks, and minus -10.2% for KNP (international IUCN goal for wild populations is 5.0%, and rarely achieved anymore);
• a founder stock sourced from n = 9–95 different external genet¬ic resources (populations) per CBO respectively, enhancing mac¬ro-genetic metapopulation gene flow, compared to KNP popula¬tion that is limited to only one genetic source;
• four of the six operations studied periodically had to extend its land area by purchasing additional land at between 1.5 and 3.5 mil¬lion ZAR per 100 ha (an average of 400–800 ha needed for each new subpopulation) for making space for progeny growth – this is done without being allowed to generate income from legal trade of its stockpile of rhino horn produced;
• All Case studies are burdened by excessive costs for security measures and management;
• All Case studies are either semi-intensive or semi-extensive pro¬tected rewilded systems, and of major difference from any zoo, safari park, or canned system.
Performance as measured with private rhino populations in South Africa disclaim the argument of species diversity demise [111] of the SWR, rather than greater geographic metapopulation species diversity sustaining gene flow and improved species integrity. The study provides significant evidence for mind-shift of DFFE and IUCN towards agro-sustainable-use biodiversity conservation through private macro-genetic metapopulation management of rhino since 1961.
Community Based Conservation (CBC) another approach propa¬gated by the HLP draft report [27] – Can it or does it work? The answer given by Professor Marshall Murphree of the University of Zimbabwe, and a principal architect of the world-famous CAMP-FIRE program in Zimbabwe, as cited by [112], quoted answer: “Sometimes it does, and sometimes it doesn’t.” Therefore, the better question to ask is this: “Under what does it deliver conser¬vation goals as well as community benefits?” There is no single answer to this question – quote: “Conservation is no longer the application of biological science – it comprises many cross-cutting elements and interdisciplinary themes. The science of ecology is not suficient to describe its limits. Now that people are considered to be part of ecosystems, and not simply the external managers, we must now speak of political ecology and environmental eco-nomics.” Furthermore, the well-known Dr Ian Player, who more than anyone else was responsible for making the SWR safe by its distribution [11], also also was a sincere advocate of its sustainable utilisation as a strategy for its survival, and a strong supporter of a legal trade in rhino horn [113].
It has been postulated that small or isolated populations, like those kept in zoos or safari Parks, are vulnerable to reproductive difficul-ties and may suffer from biased sex ratios, increased inbreeding, and fluctuations in reproductive successes. No reproductive diffi-culties had been noted from the accumulative 14-years of practice and management of the white rhinos in the six Case studies.
Author Contributions
Conceptualization
Deon Furstenburg, Michelle Otto, Derek Lewitton.
Data Curation
Deon Furstenburg, Michelle Otto, Pieter v Niekerk, Derek Lewit-ton.
Formal Analysis & Investigation
Deon Furstenburg, Michelle Otto.
Funding Acquisition
Deon Furstenburg, Derek Lewitton. Resources Deon Furstenburg, Michelle Otto, Pieter v Niekerk.
Supervision
Deon Furstenburg
Writing ± Original Draft Preparation
Deon Furstenburg
Writing ± Review & Editing
Michelle Otto, Deon Furstenburg
Acknowledgements
Special thanks to: (a) David Balfour (Specialist & Data Coordina¬tor, SADC Rhino Management Group) for expert peer-review; (b) Wildlife Ranching South Africa (WRSA) for financial and logistic support; (c) Private Rhino Owners Association (PROA), and the owners of the six Case study CBOs, for sharing valuable and se¬curity sensitive rhino data records, management information, and allowing on-site scientific zoo-ecological surveys and assessments of its operations done (funded by the owners themselves).
Funding Information
The authors did not receive any specific funding for this study.
Conflict of Interest
The authors declares no conflict of interest exist.
References
- Ferreira, S. M., Greaver, C., Simms, C., & Dziba, L. (2021). The impact of COVID-19 government responses on rhinoceroses in Kruger National Park. African Journal of Wildlife Research, 51(1), 100-110.
- Child, M., De Vos, A., Lunderstedt, K., Lindeque, L., Hurter, J., Kant, L., Vorwerk, R., & Clementsa, H. (2021). Rewilding African rangelands to rejuvenate natural economies – from ideals to implementation. Virtual Research Presentation, SANBI, Pretoria.
- Emslie, R. (2020). Ceratotherium simum. The IUCN Red List of Threatened Species 2020: e. T4185A45813880.
- ‘’t Sasâ?Rolfes, M., Emslie, R., Adcock, K., & Knight, M. (2022). Legal hunting for conservation of highly threatened species: The case of African rhinos. Conservation Letters, e12877.
- Knight, M. H. (2017). Rhino numbers and trends African Rhino Specialist Group report Rapport du Groupe de Spécial-istes du Rhinocéros d'Afrique. Pachyderm, 58(July 2016-June 2017), 17–35.
- Du Toit, J. G. (2015). The story of the White Rhinoceros. Kejafa Publishers, Krugersdorp, 284 pp.
- Gettleman, J. (2012). Coveting horns, ruthless smugglers’ rings put rhinos in the cross hairs. The New York Times, December 31.
- Ellis, B. (1993). Game Conservation in Zululand 1824-1947,Changing Perspectives. Natalia, 23, 27-44.
- Selous, F. C. (1909). Big game in South Africa and its relation to the tse-tse fly. Journal of the Royal African Society, 8(30), 113-129.
- Selous, F. C. (1908). African Native Notes and Reminiscences. Macmillan.
- Player, I. (2013). The white rhino saga. Jonathan Ball Publishers.
- Balfour, D. (2018). Survey of white rhino on private propertyin South Africa as at 31 December 2017, PROA, 5 pp.
- Milliken, T., Emslie, R. H., & Talukdar, B. (2019, November). African and Asian rhinoceroses–status, conservation and trade. In A report from the IUCN Species Survival Commission (IUCN/SSC) African and Asian Rhino Specialist Groups and TRAFFIC to the CITES Secretariat pursuant to Resolution Conf (Vol. 9).
- Clements, H. S., Knight, M., Jones, P., & Balfour, D. (2020). Private rhino conservation: diverse strategies adopted in response to the poaching crisis. Conservation Letters, 13(6), e12741.
- Du Toit, R. F. (Ed.). (2006). Guidelines for implementing SADC rhino conservation strategies. Harare: WWF-SARPO.
- DFFE. (2013). Rhino Issue Management Report. Department of Forestry, Fisheries and the Environment, 2013.
- Emslie, R., & Brooks, M. (Eds.). (1999). African rhino: status survey and conservation action plan. IUCN.
- Foose, T. J., & Wiese, R. J. (2006). Population management of rhinoceros in captivity. International Zoo Yearbook, 40(1), 174-196.
- Vrba, E. S. (1985). Species and Speciation. Transvaal Muse-um Monograph No 4. Transvaal Museum, Pretoria, 176 pp.
- Adcock, K. (2019). Status and Management of Black Rhino in Namibia, South Africa Zimbabwe, Botswana, Zambia, Malawi and eSwatini to December 2018. Includes SADC RMG data 1989 to 2018 (Confidential data submitted to the Southern African Development Community Rhino Management Group, with reporting by South Africa, Namibia, Zimbabwe, Botswana, Zambia, Malawi and Swaziland/eSwatini).
- Emslie, R. H. (2013). African Rhinoceros – Latest Trends in Rhinoceros Numbers and Poaching (No. CoP16 Inf. 51). CITES Secretariat, Geneva, Switzerland.
- Otto, M (2021). Biological management and breeding efficiency review of the (name removed for security) Rhino Captive Breeding Operation in North West Province, February, 45 pp (unpublished report, available from authors subject to permission).
- Balfour, D. (2021). Survey of white rhino on private property in South Africa as at 31 December 2020, PROA, South Africa, 6 pp.
- Knight, M. (2015). Calling all rhino owners: how can you, the private rhino owner, help to solve the rhino crisis?. Wildlife Ranching, 4(Rhino Suppl.), 9-13.
- Knight, M. H., Emslie, R. H., Smart, R., & Balfour, D. (2015). Biodiversity Management Plan for The White Rhinoceros (Ceratotherium simum) in South Africa 2015-2020. Department of Environmental Affairs, Pretoria, South Africa.
- Ferreira, S. M., le Roex, N., & Greaver, C. (2019). Species-specific drought impacts on black and white rhinoceroses. PLoS One, 14(1), e0209678.
- HLP. (2020). The High-Level Panel of experts for the review of policies, legislation and practices on matters of elephant, lion, leopard and rhinoceros management, breeding, hunting, trade and handling. Department of Forestry, Fisheries and Environment, S.A., 15 Dec, 582 pp.
- Knight, M. (2016). African rhino specialist group report. Pachyderm, (58), 17-35.
- Mucina, L., & Rutherford, M. C. (2006). The vegetation of South Africa, Lesotho and Swaziland. South African National Biodiversity Institute.
- Vrba, E. S. (1979). Phylogenetic analysis and classification of fossil and recent Alcelaphini Mammalia: Bovidae. Biological Journal of the Linnean Society, 11(3), 207-228.
- NDF. (2019). Non-detriment finding for Ceratotherium simum simum (southern white rhinoceros). Scientific Authority of South Africa. Gazette No 42660 – 22 August, 55 pp.
- SANParks (2021) South African National Parks Annual Re-port 2019/2020.
- Emslie, R., & Adcock, K. (2016). A conservation assessment of Ceratotherium simum simum. The Red List of Mammals of South Africa, Lesotho and Swaziland; Child, MF, Roxburgh, L., Do Linh San, E., Raimondo, D., Davies-Mostert, HT, Eds.
- Emslie, R. H., Milliken, T., Talukdar, B., Ellis, S., Adcock, K., & Knight, M. H. (2016). African and Asian rhinoceroses–sta-tus, conservation and trade: A report from the IUCN Species Survival Commission (IUCN SSC) African and Asian Rhino Specialist Groups and Traffic to the Cites Secretariat pursuant to Resolution Conf. 9.14 (Rev. Cop15). Geneva: CITES Secretariat, 1).
- Ferreira, S. M., Bissett, C., Cowell, C. R., Gaylard, A., Greaver, C., Hayes, J., ... & Zimmermann, D. (2017). The status of rhinoceroses in South African national parks. Koedoe, 59(1), 1-11.
- Balfour, D., Knight, M., & Jones, P. (2015). Status of White Rhino on Private and Communal Land in South Africa: 2012–2014. Department of Environmental Affairs,. Petoria, 43 pp.
- Pack, S., Golden, R., & Walker, A. (2014). Comparison of national wildlife management strategies: what works where, and why. Heinz Center for Science, Economics and the Environment. University of Maryland, 100.
- Goodman, P. S., Craigie, J., & Conway, A. J. (2018). Draft KZN Biodiversity Status Assessment Report – 2017. Biodiversity Asset: White Rhinoceros (Ceratotherium simum simum). Ezemvelo KZN Wildlife, Pietermaritzburg, South Africa.
- Castley, J. G., Hall-Martin, A. J. (2004). The status of white rhinoceros, Ceratotherium simum simum, on private land in South Africa - a summary of findings from a survey conducted in 2004. WWF.
- Castley, J. G., & Hall-Martin, A. J. (2003). The status of the southern white rhinoceros (Ceratotherium simum simum) on private land in South Africa in 2001. Pachyderm, 34, 33-44.
- Save the Rhino. (2022).
- Ferreira, S. M., Greaver, C., Nhleko, Z., & Simms, C. (2018). Realization of poaching effects on rhinoceroses in Kruger National Park, South Africa. African Journal of Wildlife Research, 48(1), 1-7.
- Hall-Martin, A. J., Du Toit, J. G., Hitchins, P. M., & Knight,M. H. (2009). The 2008 Survey of White Rhinoceros, Ceratotherium simum simum, on Private Land in South Africa. WWF, Gland, Switzerland.
- Vrba, E. (1995). The fossil record of African antelopes (Mammalia, Bovidae) in relation to human evolution and paleoclimate. Paleoclimate and evolution, with emphasis on human origins, 385-424.
- Du Toit, J. G., Van Marle-Koster, E., Bothma, J. du P., & Jansen Van Vuuren, B. (2014). Genetic principles and tools for wildlife management. In: Bothma, J. du P., & Du Toit, J. G. (eds.), Game ranch management, 6th edition, Vanschaik Publisher, Pretoria, p 393–402.
- Furstenburg, D. (2017a). Animals and Existence – Part 1: Spe-cies integrity. Game & Hunt 23(7), 154–157.
- Furstenburg, D. (2017b). Animals and Existence – Part 2: Speciation and breeding parameters. Game & Hunt 23(8), 122–125.
- Furstenburg, D. 2021a. Management Ecology - Earth’s Environmental Path, PART 3b. 400 Years southern African paradox. Private Game, MLPMEDIA, 2021(4), 79–89.
- Furstenburg, D. (2015). The Game Species Window - E-Book. Amazon, New York, p 11815–12200. ISBN 978-0-620-65883-6.
- Skinner, J. D., & Chimimba, C. T. (2005). The mammals of the southern African sub-region. Cambridge University Press.
- Oberem P (2021b) We call on the minister to do the rightthing. Private Game, MLPMEDIA 2021(3): 1–5.
- Furstenburg, D. (2021b). Management Ecology - Earth’s Environmental Path, PART 3a. Climatic effects on South Africa’s game species. Private Game, MLPMEDIA, 2020(3), 56–65.
- Maia, R. T., & de Araújo Campos, M. (2021). Introductory Chapter: Genetic Variation-The Source of Biological Diversity. In Genetic Variation. IntechOpen.
- Avise, J. C. (1994). Molecular markers, natural history and evolution Chapman and Hall. New York.
- Ferreira, S. M., & Dziba, L. (2021). Where are rhinos safest?. South African Journal of Science, 117(9-10), 1-3.
- Emslie, R., & Adcock, K. (2015). White rhino population performance a management in a large scale captive breeding operation in North West Province (2008 – February 2015).
- Buijs, D. (1988). A summary of the introduction of white rhino onto private land in the Republic of South Africa. Rhino and Elephant Foundation, Johannesburg.
- Emslie, R. H. (1994). Results of a survey of white rhino on private land in South Africa. Unpublished results presented to WWF/WCS Cost benefit study of different approaches to rhino conservation in Africa and Asia).
- Buijs, D. (1999). The status of the southern white rhino (Ceratotherium simum simum) on private land in South Africa in 1999. Pachyderm, (28), 60-64.
- Buijs, D. (1998). WHITE RHIN OS ON PRIVATE LAND INSOUTH AFRICA 1997.
- Buijs, D., & Papenfus, T. (1996). White rhinos of private land in SA. African Rhino Owners Association: Johannesburg, South Africa.
- Shaw JA, Knight MH, Daffue E (2011) Status of white rhino (Ceratotherium simum simum) on private land in South Africa: 2009 – 2011.
- SANBI. (2018). Criteria for the captive breeding of white rhinoceros (Ceratotherium simum simum) in South Africa. Report to the Scientific Authority of South Africa, SANBI, Pretoria.
- WRSA. (2021). Comments on the Draft Policy Position on the conservation and ecologically sustainable use of elephant, lion, leopard and rhinoceros, DFFE, Gazette 44776. Wildlife Ranching South Africa, Pretoria, July 2021, 118 pp.
- Owen-Smith, R. N. (1988). Megaherbivores: the influence of very large body size on ecology. Cambridge university press.
- Owen-Smith, R. N., & Smith, R. N. O. (1973). The behavioral ecology of the white rhinoceros (Doctoral dissertation, University of Wisconsin).
- Shrader, A. M., Owen-Smith, N., & Ogutu, J. O. (2006). How a mega-grazer copes with the dry season: food and nutrient intake rates by white rhinoceros in the wild. Functional ecology, 376-384.
- Shrader, A. M. (2003). Use of food and space by white rhinos(Doctoral dissertation, University of the Witwatersrand).
- Shrader, A. M., & Owen-Smith, N. (2002). The role of companionship in the dispersal of white rhinoceroses (Ceratotherium simum). Behavioral Ecology and Sociobiology, 52(3), 255-261.
- Owen-Smith, N. (1971). Territoriality in the white rhinoceros(Ceratotherium simum) Burchell. Nature, 231(5301), 294-296.
- Emslie, R. H., & Knight, M. H. (2012). Background: Rhinoceros Conservation & South Africa. Presentation at first national rhinoceros dialogue meeting organized by South Af-rica’s Department of Environmental Affairs on May 30 2012, 4 pp.
- Taylor, A., Balfour, D., Brebner, D. K., Coetzee, R., Da-vies-Mostert, H., Lindsey, P. A., & Shaw, J. (2017). Sustainable rhino horn production at the pointy end of the rhino horn trade debate. Biological Conservation, 216, 60-68.
- Shrader, A. M. (2022). Counting the costs of white rhino poaching: We are likely underestimating the indirect and longâ?term impacts. Animal Conservation, 25(2), 166-167.
- Vorhies, F. (2021a). Sustainable Develompment Goals: The Bigger Picture. Private Game, MLPMEDIA 2021(4), 10–17.
- Vorhies, F. (2021b). Sustainable Develompment Goals: The Bigger Picture. Private Game, MLPMEDIA 2021(3), 10–15.
- Ferreira, S. M., Greaver, C., Knight, G. A., Knight, M. H., Smit, I. P., & Pienaar, D. (2015). Disruption of rhino demography by poachers may lead to population declines in Kruger National Park, South Africa. PLoS One, 10(6), e0127783.
- Rademeyer, J. (2016). Tipping point: transnational organised crime and the ‘war’on poaching. Global Initiative against Transnational Organized Crime, Geneva.
- ‘TSas-Rolfes, M. (2015). Financial misconceptions of the rhinoceros industry. In: Du Toit, J. G. (Ed.). The story of the White Rhinoceros, p 184–204. Kejafa Publishers, Krugersdorp.
- ‘TSas-Rolfes, M., 1990. The economics of rhinoceros extinction. Endangered Wildlife, 2, 4–9.
- United Nations Department For Economic And Social Affairs.(2020). Sustainable development goals report 2020. UN.
- Van Hooft, W. F., Groen, A. F., & Prins, H. H. T. (2002). Phy-logeography of the African buffalo based on mitochondrial and Yâ?chromosomal loci: Pleistocene origin and population expansion of the Cape buffalo subspecies. Molecular Ecology, 11(2), 267-279.
- Van Hooft, W. F., Groen, A. F., & Prins, H. H. T. (2000). Mi-crosatellite analysis of genetic diversity in African buffalo (Syncerus caffer) populations throughout Africa. Molecular Ecology, 9(12), 2017-2025.
- Greyling, B. (2017). Buffalo genetics, Highlights from two decades of research. Buffalo Journal 14-16, Firefly Publications, Bloemfontein.
- Greyling, B. J., van Hooft, W. F., Jansen van Vuuren, B., & Maiwashe, A. (2015). Balancing Conservation and Production: A Molecular Genetic Approach in Aid of Buffalo Ranching. Proceedings, 10th World Congress of Genetics Applied to Livestock Production.
- Greyling, B., Furstenburg, D., & Van Hooft, P. (2013). Ranched populations: the implications for conservation management of the African buffalo from a genetics point of view. National Parks Board Symposium, September 2013, Skukuza.
- Van Hooft, W. F. (2015). Black gold. Wildlife Ranching, (2),238–243.
- Smitz, N., Van Hooft, P., Heller, R., Cornélis, D., Chardonnet, P., Kraus, R., ... & Michaux, J. (2016). Genome-wide single nucleotide polymorphism (SNP) identification and characterization in a non-model organism, the African buffalo (Syncerus caffer), using next generation sequencing. Mammalian Biology, 81(6), 595-603.
- Smitz, N., Cornélis, D., Chardonnet, P., Randi, E., & Michaux, J. (2014). Genetic structure of fragmented southern populations of African Cape buffalo. BMC Evolutionary Biology, 14, 203–221.
- Smitz, N., Berthouly, C., Cornelis, D., Heller, R., Van Hooft, P., Chardonnet, P., ... & Michaux, J. (2013). Pan-African genetic structure in the African buffalo (Syncerus caffer): investigating intraspecific divergence. PloS one, 8(2), e56235.
- Visser, J. H., & Van Vuuren, B. J. (2017). The influence of commercial game farming on maintaining genetic diversity in the sable antelope and roan antelope. Southern African Wildlife Management Association Conference, September 2017, Worcester, South Africa.
- Furstenburg, D., & Currie, J. L. (2019). Post-Late Glacial Maximum Palaeoecological Species Integrity, Phylogeog-raphy and Management of Bontebok (Damaliscus pygargus pygargus).
- Rabie, J. H. (2017). Why buffalo – An economic perspective. Buffalo Journal, 24–31, Firefly Publications, Bloemfontein.
- Rabie, J. H. (2011). Die herlewing en genetiese herstel van dieswartwitpens. Game & Hunt, 17(3), 53-55.
- Furstenburg, D. (2020a). Management Ecology -Earth’s Environmental Path, PART 1. Private Game, MLPMEDIA, 2020(1), 78–83.
- Furstenburg, D. (2020b). Management Ecology -Earth’s Environmental Path, PART 2. South Africa’s vegetation change. Private Game, MLPMEDIA, 2020(2), 77–83.
- Scholtz, M. M., McManus, C., Leeuw, K. J., Louvandini, H., Seixas, L., Melo, C. D., ... & Neser, F. W. C. (2013). The effect of global warming on beef production in developing countries of the southern hemisphere.
- Scholtz, M. M., Furstenburg, D., Maiwashe, A., Makgahlela,M. L., Theron, H. E., & Van der Westhuizen, J. (2010). Environmental-genotype responses in livestock to global warming: A Southern African perspective. South African Journal of Animal Science, 40(5), 408-413.
- Furstenburg, D., & Scholtz, M. M. (2008). Global climatic change and animal production. Proceedings, 10th World Animal Production Congress, November 2008, Cape Town.
- Di Minin, E., Laitila, J., Montesinoâ?Pouzols, F., Leaderâ?Wil-liams, N., Slotow, R., Goodman, P. S., ... & Moilanen, A. (2015). Identification of policies for a sustainable legal trade in rhinoceros horn based on population projection and socioeconomic models. Conservation Biology, 29(2), 545-555.
- Biggs, D., Courchamp, F., Martin, R., & Possingham, H.P. (2013). Legal trade of Africa's rhino horns. Science, 339(6123), 1038-1039.
- Conrad, K. (2012). Trade bans: a perfect storm for poaching?.Tropical Conservation Science, 5(3), 245-254.
- Janssens, B., & Trouwborst, A. (2018). Rhinoceros conservation and international law: The role of wildlife treaties in averting megaherbivore extinction. Journal of International Wildlife Law & Policy, 21(2-3), 146-189.
- Creecy, B. (2021). Environment, Minister Barbara Creecy delivers 2021/22 Budget Vote speech to National Assembly (2021, May 14).
- Oberem, P. (2021). Biodiversity can be restored, in a processof Rewilding. Private Game, MLPMEDIA (4), 1–5.
- Hanks, J. (2017). Conservation in Africa in the face of unprecedented global change a perspective on the future. Southern African Wildlife Management Association Conference, September 2017, Worcester, South Africa.
- Marire, J. (2015). Institutional change, institutional isolation and biodiversity governance in South Africa: a case study of the trout industry in alien and invasive species regulatory reforms.
- Snijders, D. (2015). Shifting species in South Africa: wildlife policy, rural consequences.
- Ververs, C., van Zijll Langhout, M., Hostens, M., Otto, M., Govaere, J., Durrant, B., & Van Soom, A. (2017). Reproductive performance parameters in a large population of game-ranched white rhinoceroses (Ceratotherium simum simum). PloS one, 12(12), e0187751.
- Ververs, C., van Zijl Langhout, M., Govaere, J., & Van Soom,A. (2015). Features of reproduction and assisted reproduction in the white (Ceratotherium simum) and black (Diceros bicornis) rhinoceros. Vlaams Diergeneeskundig Tijdschrift, 84(4), 175-187.
- Badenhorst, M., Ganswindt, A., Otto, M., & Van der Goot,A. C. (2016). Stress steroid levels and the short-term impact of routine dehorning in female southern white rhinoceroses (Ceratotherium simum simum). African Zoology, 51(4), 211-215.
- Romiguier, J., Gayral, P,. Ballenghien, M., Bernard, A., Ca-hais, V., Chenuil, A., Chiari, Y., Dernat, R., Duret, L., Faivre,N., Loire, E., Lourenco, J. M., Nabholz, B., Roux, C., Tsag-kogeorga, G., Weber, A. A. T., Weinert, L. A., Belkhir, K., Bierne, N., Gle´min, S., & Galtier, N. (2014). Comparative population genomics in animals uncovers the determinants of genetic diversity. Nature, 515, 261–263.
- Sturgeon, J. (2015). Conservation and community benefits.Wildlife Ranching, 2015, 17–19.
- Reilly, T. (2015). The swazi Conservation reality Conservation and community benefits. Wildlife Ranching, 2015, 25–28.
- Sellier, S. A. J., Emslie, R., Adcock, K., Otto, M., Pfab, M.(2017). Criteria for the captive breeding of white rhinoceros (Ceratotherium simum simum) in South Africa. Core team research, study preparation and drafting for Scientific Authority, Department of Forestry Fisheries & Environment, South Africa.
- Cousins, J. A., Sadler, J. P., & Evans, J. (2008). Exploring the role of private wildlife ranching as a conservation tool in South Africa: stakeholder perspectives. Ecology and society, 13(2).