
Current Research in Environmental Science and Ecology Letters(CRESEL)
ISSN: 2997-3694 | DOI: 10.33140/CRESEL


Research Article - (2024) Volume 1, Issue 1
Changes in Temperature and CO2 in the Atmosphere at Various Latitudes
Received Date: Jan 25, 2024 / Accepted Date: Feb 14, 2024 / Published Date: Feb 20, 2024
Copyright: ©Â©2024 Masaharu Nishioka. This is an open-access article distributed under the terms of the Creative Commons Attribution License, which permits unrestricted use, distribution, and reproduction in any medium, provided the original author and source are credited.
Citation: Nishioka, M. (2024). Changes in Temperature and CO2 in the Atmosphere at Various Latitudes. Curr Res Env Sci Eco Letters, 1(1), 01-09.
Abstract
The satellite-based Earth surface temperature, ENSO index, and change rate of the CO2 concentration (ppm/year) were strongly correlated over the 40 years of observation, as reported in the previous paper. The temperature changed approximately one year after the ENSO index changed, and the change rate of the CO2 concentration followed the temperature change by several months. CO2 emission and absorption at the Earth’s surface respond to temperature changes. In this study, satellite-based Earth surface temperatures and change rates of CO2 concentrations were further investigated at various latitudes. These two variables were correlated even at various latitudes. The change rate of the CO2 concentration at northern latitudes responded to temperature changes more than that at southern latitudes. The change rates of CO2 concentrations at various latitudes between 2008 and 2011 and between 2014 and 2017 during El Niño periods were compared, but the change rates of CO2 concentrations at low latitudes were quite different between the two periods. Additionally, the change rate of the CO2 concentration at the sine latitude of 0.75 (�??50 N) significantly responded to temperature changes regardless of ENSO occurrence. Furthermore, the temperature difference between the land and sea is greater in the north (20 N-90 N) than in the south (20S-90S). All these results support previous interpretations: (1) CO2 emissions due to higher temperatures are related to plant respiration or decomposition processes, and (2) temperature changes first, after which the change in CO2 concentration follows temperature changes by several months. These propositions are important for understanding today's warming period.
Keywords
Global Temperature, Atmospheric CO2 Concentration, Latitude, El Niño, Plant Respiration, Plant Distribution, Land-To- Sea Ratio, Carbon Cycles.
Abbreviations
NOAA: The National Oceanic and Atmospheric Administration
ENSO Index: El Niño-Southern Oscillation Index
UAH: The University of Alabama in Huntsville
drco2/dt: The change rate of the CO2 concentration or CO2 growth rate
ΔT: Temperature change
Introduction
It is estimated that the global temperature has been 15±1°C for more than 2,000 years [1,2]. CO2 concentrations in the atmosphere have changed during this period to some extent according to proxy records, and recent direct observations of CO2 concentrations have shown that the CO2 concentration steadily increases every year [3]. The change rate of the CO2 concentration in the atmosphere is the change in the CO2 concentration (rco2) during a predetermined period and can be expressed as drco2/dt, such as an annual change, for example, “ppm/year”. The major functions affecting drco2/ dt are (1) plant photosynthesis, (2) CO2 solubilization into the ocean, and (3) plant decomposition or respiration [4]. For a small temperature range such as ±1°C, drco2/dt may be considered to be approximately proportional to the temperature change, as shown in eq. (2) [5].
drco2/dt â?? a rate of photosynthesis + a solubilization rate into sea + a decomposition rate (1)
â?? γ ΔT (γ: constant, ΔT: temperature change) ( 2 )
Eq. (2) indicates that drco2/dt is linearly dependent on ΔT in the small temperature range of 15±1°C.
Satellite-based temperature observations began in 1979, while direct CO2 observations at the Mauna Loa Observatory, Hawaii, began in 1958. We compared satellite-based University of Alabama in Huntsville (UAH) Earth surface temperatures, the National Oceanic and Atmospheric Administration (NOAA) El Niño-Southern Oscillation (ENSO) index, and drco2/dt data in the previous paper [6]. These three variables were strongly correlated over the 40 years of observation. Temperatures changed approximately one year after the ENSO index changed, and drco2/ dt followed ΔT by several months. CO2 emission and absorption at the Earth’s surface respond to ΔT, as shown in the previous paper [6]. This finding supports eq. (2).
Eq. (2) was proposed by Murry Salby and can also be expressed with eq [7,8]. (3). In other words, the CO2 concentration may be approximately determined by the integral value of ΔT.
Since vegetation varies with global location and surface conditions such as moisture the constant γ may change with global location and surface conditions [7,8]. In this paper, we investigate the correlation between drco2/dt and ΔT at various latitudes. This approach could help us better understand the process of global warming.
Atmospheric Data
Since 1979, NOAA satellites have been carrying instruments that measure natural microwave thermal emissions from oxygen in the atmosphere [9]. Every month, the UAH updates global temperature datasets that represent the piecing together of temperature data from a total of fifteen instruments flying on different satellites over the years. Further details are available [9]. Temperatures were obtained from the datasets, and the 13-month average of lower troposphere anomaly values was used.
The raw atmospheric CO2 concentration data at different sine latitudes between 1979 and 2022 were obtained from NOAA, and other analytical data reported in this paper are available on the website [10].
Results and Discussion
Figure 1(a) shows a trend of ΔT in the tropics (20 S-20 N), north latitude (20 N-90 N), and south latitude (20 S-90 S) between 1984 and 2011. Figure 1(b) shows the drco2/dt values across latitudes from north to south for the same duration [11]. Two variables are correlated even at the same latitudes during the observed 27 years. As shown in the previous paper, as temperatures change approximately one year after the ENSO index changes the ΔT in the tropics strongly responds to El Niño, as shown in Figure 1(a). However, the drco2/dt values at other latitudes are different, as shown in Figure 1(b). In general, drco2/dt at higher northern latitudes more strongly responds to temperature changes [6].
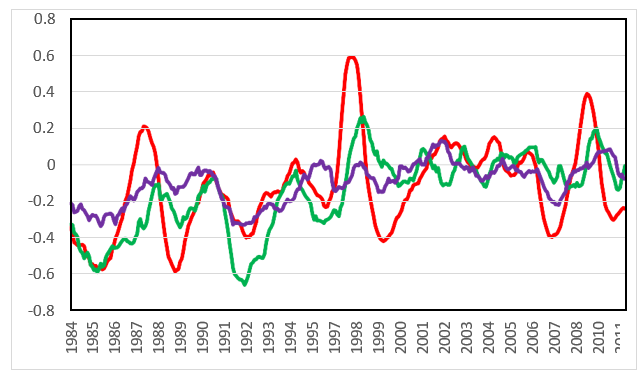
Figure 1 (a):Temperature Change (â??) in The Tropics (20 S-20 N, Red), North Latitude (20 N-90 N, Green), and South Latitude (20S-90 S, Purple) between 1984 and 2011

Figure 1 (b): The Change Rate of Co2 Concentration (Ppm/Year) Across Latitudes between 1984 and 2011 [11]
To examine the response of drco2/dt to ΔT at various latitudes, two variables were further compared between 1979 and 2022 in the tropics, at northern latitudes, and at southern latitudes. ΔT in the tropics again strongly responds to El Niño, as shown in Figure 2(a). The increasing trend in temperature is greater in the north (20 N-90 N) than in the south (20 S-90 S). It can be seen that drco2/ dt at a sine latitude of 0.75 (= 50 N) responds more strongly to than does that in the tropics, as shown in Figure 2(b).

Figure 2(a): Temperature Change (ºC) between 1979 and 2022 in the Tropics (20 S-20 N, Red), North Latitude (20 N-90 N, Green), and South Latitude (20 S-90 S, Purple)

Figure 2(b): the Change Rate of Co2 Concentration (Ppm/Year) with Latitude between 1979 and 2022 at Sine Latitudes (-0.75=50 S: Purple, 0: Red, And 0.75=50 N: Green)
Let us investigate three temperature points, α, β, and γ, in Figure 2(a) and α’, β’, and γ’ in Figure 2(b). The times (years) at which the two local maximum values, ΔT (α, β, and γ) and drco2/dt (α’, β’, and γ’), are reached are almost the same. Figure 3 shows the CO2 concentrations (ppm, left scale) at Barrow, AK (71 N, green), Mauna Loa, HI (19 N, red), and Tutuila, American Samoa (14S, purple) and the changes in temperature anomalies (=, cyan, right scale) at northern latitudes (20 N-90 N) between 1979 and 2022. The timing of the CO2 concentration response to ΔT (α and γ; see red arrows in Figure 3) is delayed by several months. Moreover, the CO2 concentration at Barrow annually changes much more than that at Mauna Loa and Tutuila. The result is the same in that drco2/dt at a sine latitude of 0.75 (=50 N) significantly responds more strongly to than does that in the tropics, as shown in Figure 2(b).
The average annual increase rates of the CO2 concentration between 1979 and 2022 (see Figure 2(b)) are 1.85, 1.90 and 1.83 (ppm/year) for the tropics (20 S-20 N), the northern latitudes (20 N-90 N), and the southern latitudes (20S-90S), respectively. The global CO2 concentration increased at these rates during the study period, as shown in Figure 3. Although the CO2 concentration steadily increased during the present warming period, it is not clear whether this change in CO2 concentration caused an increase in the global temperature, as shown in Figures 1-3.

Figure 3: CO2 Concentrations (Ppm, Left Scale) between 1979 and 2022 at Barrow, Ak (Green); at Mauna Loa, Hi (Red); and at Tutuila, American Samoa (Purple); and Anomalies of Temperature Change (=, Cyan, Right Scale) between 1979 And 2022 at North Latitude (20 N-90 N).
Figures 4(a) and 4(b) show the drco2/dt (ppm/year) at sine lati- tudes of 0, 0.25, 0.50, 0.75, and 1.0) between 2008 and 2011 and between 2014 and 2017. These periods correspond to β and γ in Figure 2(a) and to β’ and γ’ in Figure 2(b), respectively. Both peri- ods are El Niño events, but the drco2/dt values at sine latitudes of 0 and 0.25 are quite different for both periods. Additionally, drco2/ dt at a sine latitude of 0.75 (=50 N) significantly responds to ΔT regardless of ENSO occurrence.
CO2 is emitted into the atmosphere from the Earth’s surface during El Niño, as shown in a previous paper [6]. One of the factors af- fecting CO2 emissions includes plant respiration. Plant respiration occurs in plant cells, but the process mediated by bacteria is also another form of respiration by which plant-derived material such as fallen leaves decomposes. Overall, respiration (or decomposi- tion) consumes O2 and releases CO2, as shown in the following equation.

Figure 4 (a): The Change Rate of Co2 Concentration (Ppm/Year) at Sine Latitudes (0: Red, 0.25: Yellow, 0.50: Blue, 0.75: Green, 1.0: Gray) between 2008 and 2011 (See Point Β In Figure 2(A) and Point Β’ in Figure 2(B))
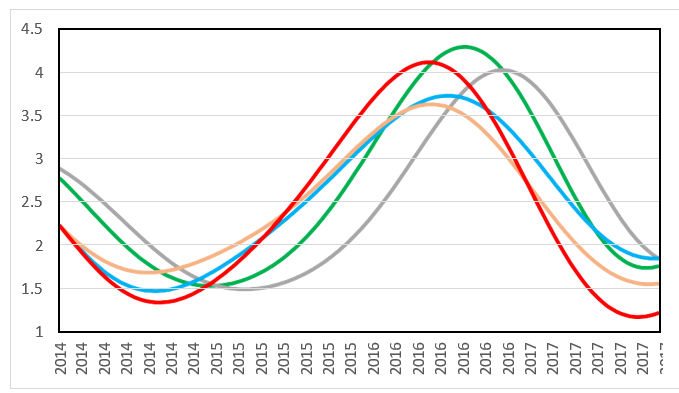
Figure 4 (b): The Change Rate of Co2 Concentration (Ppm/Year) at Sine Latitudes (0: Red, 0.25: Yellow, 0.50: Blue, 0.75: Green, 1.0 Gray) between 2014 and 2017 (See Point Γ in Figure 2(A) and Point Γ’ in Figure 2(B)).
C6H12O6 + 6 O2 = 6 CO2 + 6 H2O + energy (4)
C6H12O6 denotes representative plant debris. Respiration increases with increasing temperature. Four lines of evidence to support this interpretation are shown in the paper. The difference in vegeta- tion on Earth for plant respiration affecting CO2 emissions was investigated between land and sea in this study. Figure 5 shows the temperature changes in the southern (20S-90S) and northern (20 N-90 N) regions for land and sea, respectively, between 1979 and 2022. The difference in temperature between the land and sea is greater in the north (20 N-90 N) than in the south (20 S-90 S). The larger difference in the north between land and sea may reflect the difference in vegetation.

Figure 5 (a): Southern Latitude (20 S-90 S)
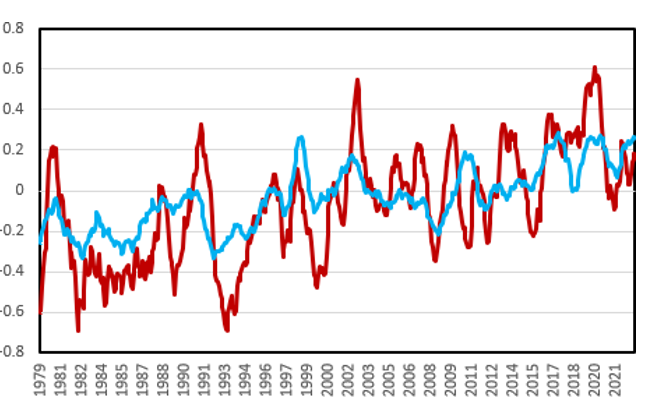
Figure 5 (b): Northern Latitude (20 N-90 N)
Figure 5: Temperature Changes (â??) on Land (Brown) and in the Ocean (Blue) between 1979 and 2022 at Southern Latitude (20 S-90
S) and Northern Latitude (20 N-90 N).
Plant photosynthesis and respiration play critical roles in the car- bon cycle, as discussed in a previous paper and the CO2 concentra- tion changes seasonally [6]. As shown in Figure 3, the change in seasonal CO2 concentration becomes greater in the north. Figure 6 shows a forest biomass map and Figure 7 shows the ratio of land to sea on Earth [12,13]. Land occupies approximately 30% of the Earth, and 30% of the land is forest. Approximately 10% of the Earth's surface is covered with forests. Subarctic forests ex- tend to 50 N-70 N in the Northern Hemisphere. In the Southern Hemisphere, it can be detected only at the southern tip of South America. The Southern Hemisphere has a small land area and a small forest area. On the other hand, the Northern Hemisphere has a large land area and a large forest area. Furthermore, compared to that in the tropics, the annual temperature change in the tropics is greater at higher latitudes. Therefore, changes in the amount of de- composed plant matter throughout the year are thought to increase in the Northern Hemisphere and further north.

Figure 6: Changes in Temperature and CO2 Concentration in the Atmosphere at Different Latitudes, and Forest Biomass Distribution [8]. See Table for the Descriptions Numbered
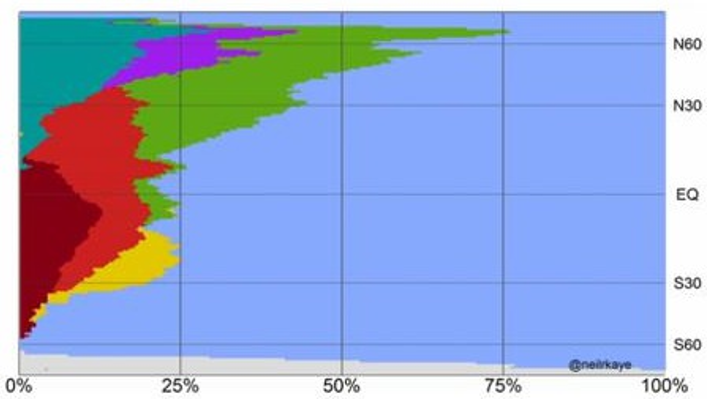
Figure 7 : Area Ratio between Land and Sea at Different Latitudes (the Blue Portion Denotes Sea, and Other Colors Denote Land). (See [13] for Details.)
Conclusion
Finally, we summarize the following points (see Figure 6 and Table).
1. The global average ΔT was correlated with the global average drco2/dt in CO2 in previous work, while the same correlation was observed at the same latitudes from north to south in this study.
2. drco2/dt followed ΔT for several months, and CO2 emissions at the Earth’s surface responded to temperature fluctuations in previous work. Similarly, drco2/dt followed ΔT at the same latitudes in this study.
3. However, the correlation between two variables differs depending on the latitude. In addition, the drco2/dt at a sine latitude of 0.75 =50 N) responds to ΔT regardless of whether ENSO occurs and responds more strongly to ΔT than does that in the tropics.
4. The difference in ΔT between land and sea is greater in the north (20 N-90 N) than in the south (20 S-90 S). The temperature increase trend is greater in the north (20 N-90 N) than in the south (20 S-90 S).
5. All the results obtained in this study support previous interpretations: (1) CO2 emissions due to higher temperatures are related to plant respiration or decomposition processes, and (2) temperature changes first and then drco2/dt follows ΔT suggested by equation (2) drco2/dt = γ ΔT (γ: constant, ΔT: temperature change).
6. The constant γ in eq. (2) may change depending on the vegetation type at different latitudes. The impact of plant respiration on carbon cycles may be much greater than expected. This proposition is important for understanding modern warm periods
|
Number |
Results |
Data |
|
1 |
Temperature change correlates with the change rate of CO2 concentration across latitudes from north to south. |
Fig. 1 |
|
2 |
Temperature change in the tropics strongly responds to El Niño. |
Fig. 1(a) & 2(a) |
|
3 |
A trend of the temperature increase is greater in the north (20 N-90 N) than in the south (20 S-90 S). |
Fig. 2(a) |
|
4 |
The change rate of CO2 concentration at sine latitudes 0.75(â??50 N) responds to temperature change more than in the tropics. |
Fig. 2 & 3 |
|
5 |
The change rate of CO2 concentration at sine latitudes 0.75(â??50 N) significantly responds to temperature change regardless of ENSO occurrences. |
Fig. 2 & 4 |
|
6 |
The difference of temperature change between land and ocean is larger in the south (20S-90S) than in the north (20 N-90 N). |
Fig. 5 |
Table : Summary of the Results Obtained in this Study. the Numbers Correspond to those in Figure 6
Acknowledgements
I am grateful to Dr Xin Lan at NOAA for kindly providing me the CO2 growth rate data at each latitude
References
- IPCC Assessment Report
- Global Warming.
- NOAA database.
- IPCC Assessment Report
- CORNIC Gabriel, Honorary Professor, Laboratoire d’écophysiologie des plantes, Université Paris-Saclay
- Salby, M. Relationship Between Greenhouse Gases and GlobalTemperature. Video Presentation,April 18, 2013. Helmut-Schmidt-Uni- versity Hamburg.
- Salby, M. Atmospheric Carbon. Video Presentation, July 18, 2016. University College London.
- Forest Biomass.
- Land Mass at Each Longitude and Latitude.
- Nishioka, M. Changes in Temperature and CO2 Concentration Induced by El Niño, Sci Rep in press
- Latest Global Temperatures.