


Research Article - (2023) Volume 8, Issue 2
Beat to Beat Continuous Blood Pressure Estimation using the Transmission Coefficient Waveforms out of On-body Continuous Wave Antennas
2Higher Colleges of Technology, Lebanon
3Abu Dhabi Campus: Khalifa University of Science and Technology, Lebanon
Received Date: Jun 08, 2023 / Accepted Date: Jul 10, 2023 / Published Date: Jul 19, 2023
Copyright: ©Â©2023 Mona K ElAbbasi, et al. This is an open-access article distributed under the terms of the Creative Commons Attribution License, which permits unrestricted use, distribution, and reproduction in any medium, provided the original author and source are credited.
Citation: ElAbbasi, M. K., Madi, M., Kabalan, K., Jelinek, H. (2023). Beat to Beat Continuous Blood Pressure Estimation using the Transmission Coefficient Waveforms out of On-body Continuous Wave Antennas. Cardio Open, 8(2), 40-44.
Abstract
Blood pressure (BP) is a clear sign of hypertension, a condition that can be hazardous and even fatal. Regular blood pressure monitoring is therefore crucial, but many people dislike cuff-based devices, and they can only be used while at rest. To address this need, this paper investigates the use of micro strip patch antenna technology to obtain BP values through an innovative technique. The change of transmission coefficient EM waveforms emitted by the antennas will be analyzed and correlated with brachial artery thickness to radius ratios and hence, blood pressure assessment at different pressure points. The suggested morphology based on simulations and data algorithms performed at couple of instances of brachial artery diameters to mimic the condition of blood flow. A dedicated analysis software provided to calculate the systolic and diastolic pressure levels.
Key Points
Blood Pressure, Microstrip Patch Antenna, Transmission Coefficient EM Waveforms, Brachial Artery Thickness to Radius Ratios, Cuff Less, Systolic Pressure, Diastolic Pressure
Introduction
The most significant and frequently done test in a doctor's office is blood pressure (BP) measurement [1]. According to the World Health Organization (WHO), hypertension which is considered as a significant risk factor of cardiovascular diseases (CVDs) accounting for about 32 percent for worldwide deaths [2]. Regular blood pressure monitoring is therefore crucial for the entire people, but it is especially crucial for those who already have hypertension or other disorders that are associated because they are more susceptible to elevated blood pressure [3]. It is reported that there are various ways to estimate blood pressure variations either using the Photoplethysmogram signal (PPG) then applying machine learning algorithms to detect the variations of blood pressure or by measuring the time difference between the peaks of electrocardiogram (ECG) and Photoplethysmogram (PPG) [4,5]. These methods used to develop wearable devices that can non-invasively and continuously measure blood pressure.
The authors proposes two pairs of wearable antennas for continuous and cuff less blood pressure monitoring [6]. The topology is based on simulating the two pairs of antennas on a simulated five-layer human arm model and then extracting the pulse transit time (PTT) between the proximal and distal transmission coefficient scattering waveforms measured out of the metallic sensors underlying the assumption that brachial. The standard non-linear Moens and Korteweg model is compared to the model showing good correlation between systolic and diastolic blood pressures. In the same manner, a new method is proposed and based on the increase of brachial artery thickness- radius ratio leads to an increase in absolute risk of arterial blood pressure. The results of both methods demonstrate how the radius estimates, along with electromagnetic (EM) antenna transmission propagation characteristics, used to estimate continuous BP non- invasively. In this paper, we will extract the feature points of the transmission coefficient waveforms out of the two pairs of antennas exposed, then through data analysis and MATLAB algorithms main blood pressure variations can be derived [6]. To the best of our knowledge, there is no mathematical model that demonstrates the correlation of the transmission coefficient between the pair of antennas in relation to variation of brachial artery thickness to radius variations and BP.
Materials and Methods
The block diagram of the proposed BP estimation algorithm shown in Figure 1. We will present the algorithms to effectively extract the key features of transmission coefficient waveforms. The proposed method is mainly performed in MATLAB. It starts by preprocessing algorithms for the transmission coefficient waveforms, then detecting and extracting the key points of the waveforms. Finally linking the BP levels to the waveforms by regression tree models.

Figure 1: Block Diagram of the Proposed BP Estimation Method Based on Detecting Key Points of the Transmission Coefficient Variation Waveforms
An obvious and innovative relationship between pressure and brachial artery thickness to ratio ratios throughout the cardiac cycle is proven possible in many medical reports [7,8]. Relative changes of the artery radius are linearly related to relative changes of pressure. The difference in electromagnetic properties is related to instantaneous artery properties in a wave reflection, and at the same time to instantaneous changes in pressure. Area under the curve (AUC) value of the transmission coefficient curves for variation of brachial artery diameter is used here as a basis to diagnose the simulated phantom without cardiovascular risk factors (0.11 vs. 0.14, p = 0.001). The built logistic model assures that any increase in area under curve leads to an increase in cardiovascular risk. Previous studies rarely prove the relationship of between the electromagnetic transmission coefficient waveforms and blood pressure [9,10]. However, subtle variations in the morphology of transmission coefficient waveforms; presented in this study; appear correlated to the pressure imposed by blood flow on the walls of vessels as shown in Figure 2.

Figure 2: Transmission coefficient pulses of transmitting/receiving antennas due to brachial artery thickness/radius waveforms in respect to pressure level variations in frequency domain analysis.
The graph shows direct association between brachial artery diameter and variation in transmission coefficient between the two antennas. Numerical simulations conducted on the heterogeneous sample demonstrated that the sensing thickness to radius variation depends strongly on dielectric properties variation between the frequency ranges from 2 GHz to 3 GHz. The ratio of area confined under transmission coefficient waveforms. These confined areas related to blood pressure coefficient levels. By breaking the area under the transmission coefficient pulses into two parts based on the location of the inflection point, the blood pressure parameters can be determined easily.
Before extracting the features of the transmission coefficient waveforms, the key points of each pulse need to be detected. As transmission coefficient curves have different morphologies, the point detection algorithms should have minimal sensitivities to different morphologies. If the brachial artery size changes due to variation in blood pressure, then the wave characteristics are altered. Accordingly, the response of our radiofrequency-based sensors maps that alteration to indicate the change in the BP, hence tracking its variation. S-parameters used here to describe the input-output EM relationship between the terminals of the sensor antennas. A transmission coefficient pulse has a few key points, such as maximum slope point, systolic peak and diastolic peak as shown in Figure 2. The regression tree model built in MATLAB can detect the blood pressure features. Due to differences in the cardiovascular system, the shape and morphology features of transmission signals vary from one person to another. This variation is the result of brachial artery thickness to radius ratios. Here, we identify the proposed method for detecting the key points to relate to systolic and diastolic BP features Fast Fourier Transform (FFT) from frequency domain to time domain extracts the following cardiac key frequency features. The extracted features listed below:
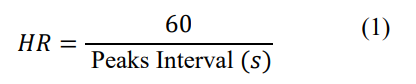
1. Heart Rate
Heart rate tracking can be obtained by counting the time interval between two consecutive systolic peaks or two consecutive minimums [11].
2.Reflection
Index Reflection index is a percentage ratio of pulse reflection. It is related to the height of systolic peak height to the inflection peak one. It can be obtained using [12].
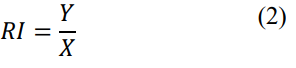
Where Y the amplitude of the inflection is point and X is the amplitude of the systolic pulse shown in Figure 2.
3.Large Artery Stiffness Index
The artery index of an individual is a measure of the stiffness of his arteries and expressed by [13].
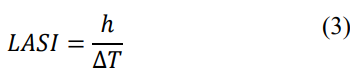
Where h is the height of the individual and â??T is the time interval between the systolic peak and the inflection point of a given pulse. Since the height of the subjects is not considered in this study, we set it to one for all subjects.
4.Ratio of Pulse Areas
The ratio of pulse areas is the ratio of different areas under a given pulse. By breaking the area under a transmission coefficient pulse into two parts based on the location of the inflection point. The authors in showed that the ratio of these two areas is related to the total peripheral resistance and BP [9,13]. From here, inflection Point Area ratio is calculated from

Figure 3: Shows a correlation between cardiac feature extractions from the different transmission coefficient waveforms due to different brachial artery thickness to radius ratios.
There is shown two slope features, two power areas, and three amplitude ratio features. The two-area ratios represent the relation of systole to diastole blood pressures. There is a significant positive correlation between brachial artery thickness and hypertension. Hypertension is defined as systolic blood pressure of >140 mm Hg or diastolic blood pressure of >90 mm Hg.
5. Crest Time
The crest time is defined as the time from the minimum point of the waveform to its peak as shown in Figure 4 [14]. The accurate extraction of features such as maximum slope point, systolic peak, inflection point, and diastolic peak, are directly correlated to BP variation levels. The blood pressure fluctuations in the human arm phantom are associated with changes within the transmitted waves. These characteristics are then processed and converted into BP levels by means of data analytics and smart algorithms. Due to different artery radius estimates, this can be expected to track the blood pressure over the short term. This explains that any increase in brachial artery thickness-to- diameter coefficient leads to an increase in the cardiovascular risk. The set of transmission coefficient values therefore, obtained at five different ratios reflect the effect of blood flow and thus the blood pressure estimation levels. More precisely, the changes in transmission scattering parameters are associated to the estimates of BP variation levels as predicted (Figure 4).

Figure 4: Shows a correlation between cardiac feature extractions from the different transmission coefficient waveforms correlated to mean BP levels through a set of algorithms and due to different brachial artery thickness to radius ratios. There is a significant positive correlation between brachial artery thickness and hypertension. Hypertension is defined as systolic blood pressure of >140 mm Hg or diastolic blood pressure of >90 mm Hg.
Results and Discussion
This section summarizes the performance of the algorithm used in this study. We experimented with MATLAB to classify BP based on transmission coefficient waveforms. We collected the data from the transmission coefficient waveforms based on the variation of thickness to radius brachial artery. The analysis of transmission coefficient waveforms was conducted. Each waveform was extracted into 2000 points. The feature extraction uses raw values of the transmission coefficient signals at a given time interval and was carried out point by point so physiological data can be explored optimally as shown in Figure 4. In this study, a comparative analysis conducted with other models of related works in relation to methodology, and estimation error. The results are also very close to the standard boundary with an average error close to zero for SBP estimation.
|
Cases |
Case 1:h/R=0.5 |
Case 2:h/R=0.7 |
Case 2:h/R=0.9 |
|||||||||
|
Algorithm |
Mean BP |
SBP |
DBP |
Average Error |
Mean BP |
SBP |
DBP |
Average Error |
Mean BP |
SBP |
DBP |
Average Error |
|
[6] |
100 |
120 |
60 |
0.17 % |
107 |
140 |
90 |
0.1 % |
107 |
140 |
90 |
0.12 % |
|
Present Study |
85 |
110 |
70 |
97 |
140 |
75 |
120 |
145 |
80 |
|||
Table
Analyses of the blood variation outcomes of both methods were broadly, showing evidence of effects in electromagnetic transmission waveforms in figuring systolic or diastolic blood pressure categories. The results demonstrate the applicability of the proposed algorithm in estimating BP noninvasively, cuff-less, calibration-free, and only by using the appropriate or inappropriate PPG signal. Beyond the prognostic value of blood pressure variation for cardiovascular outcomes, mounting evidence indicates that both discussed methods, the present study and the one presented [6].
Conclusion
The findings of this paper indicate that measurement out of the pair of antennas is a recent and actively emerging area of research. The major difference being that the proposed approach makes use of common, easily obtainable devices as opposed to sophisticated and expensive medical equipment. Algorithms proposed to better estimate BP from the electromagnetic transmission coefficient signal morphologies, such as systolic and diastolic peaks to improve the precision of feature extraction. The system used time domain and frequency domain and coded in MATLAB to extract the meaningful data. The system is on its way for clinical testing and validation on different human subjects. Therefore, at the next step, efforts are to develop a cuff less continuous BP device [15-17].
References
- Skerratt, S. M., & Wilson, O. G. (2021). Assessment of Cardiovascular Risk for Prevention and Control of Cardiovascular Disease in Ghana’s Northern Region A Cross-sectional Study of 4 Rural Districts using World Health Organization/International Society of Hypertension (WHO/ISH) Risk Prediction Charts. Global Journal of Health Science, 13(6), 1.
- Unnas, Kavita, Thakur, J. S., Ghai, S., & Saini, S. K. (2017). Cardiovascular Disease risk assessment by using WHO/ ISH CVD risk prediction charts in rural area of Chandigarh. Nursing & Midwifery Research Journal, 13(3), 109-117.
- Kinsara, A. J., Abuosa, A., Meer, A., Elsheikh, A. H., Abrar, M., & Vriz, O. (2020). Diagnostic Comparability and Interchangeability Between Daytime Ambulatory Blood Pressure Monitoring and 24-Hour Ambulatory Blood Pressure Monitoring in Detecting Masked Hypertension. Cureus, 12(11).
- Chowdhury, M. H., Shuzan, M. N. I., Chowdhury, M. E., Mahbub, Z. B., Uddin, M. M., Khandakar, A., & Reaz,M. B. I. (2020). Estimating blood pressure from the photoplethysmogram signal and demographic features using machine learning techniques. Sensors, 20(11), 3127.
- Feng, J., Huang, Z., Zhou, C., & Ye, X. (2018). Study of continuous blood pressure estimation based on pulse transit time, heart rate and photoplethysmography- derived hemodynamic covariates. Australasian physical & engineering sciences in medicine, 41, 403-413.
- El Abbasi, M. K., Madi, M., Jelinek, H. F., & Kabalan,K. Y. (2022). Wearable Blood Pressure Sensing Based on Transmission Coefficient Scattering for Microstrip Patch Antennas. Sensors, 22(11), 3996.
- Wang, J. J., Liu, S. H., Pan, Y. H., Tseng, W. K., & Chen, W. (2022). Theoretical and Experimental Study on Assessment of Flow-Mediated Dilatation Using the Cuff Method in Brachial Arteries. Electronics, 11(3), 351.
- Picone, D., Climie, R., Keske, M., & Sharman, J. (2014).2.6 Non-Invasive Estimation of Exercise Central Blood Pressure By Radial Tonometry May Be UnderestimatedDue To Brachial-To-Radial-Systolic-Blood-Pressure- Amplification And Is Related To Upper Limb Blood Flow Velocity. Artery Research, 8(4), 124-125.
- Nobre, F., & Mion Jr, D. (2005). Is the area under blood pressure curve the best parameter to evaluate 24-h ambulatory blood pressure monitoring data?. Blood pressure monitoring, 10(5), 263-270.
- Yavarimanesh, M., Chandrasekhar, A., Hahn, J. O., & Mukkamala, R. (2019). Commentary: Relation between blood pressure and pulse wave velocity for human arteries. Frontiers in Physiology, 10, 1179.
- Askarian, B., Jung, K., & Chong, J. W. (2019). Monitoring of heart rate from photoplethysmographic signals using a Samsung Galaxy Note8 in underwater environments. Sensors, 19(13), 2846.
- Sun, H., Yao, Y., Liu, W., Zhou, S., Du, S., Tan, J., ... &Avolio, A. (2023). Wave reflection quantification analysis and personalized flow wave estimation based on the central aortic pressure waveform. Frontiers in Physiology, 14, 287.
- Burgess, K., JovanoviÄ?, S., Sudhir, R., & JovanoviÄ?, A. (2019). Area under the curve analysis of blood pressure reveals increased spontaneous locomotor activity in SPAK knockâ?in mice: relevance for hypotension induced by SPAK inhibition?. Physiological Reports, 7(3), e13997.
- Lakhal, K., & Robert-Edan, V. (2017). Invasive monitoring of blood pressure: a radiant future for brachial artery as an alternative to radial artery catheterisation?. Journal of thoracic disease, 9(12), 4812.
- Beraia, M., & Beraia, G.(2018). Electromagnetic properties of the arterial blood flow. Biology, Engineering and Medicine, 3(2), 1-8.
- Monroy Estrada, G., Mendoza, L. E., & Molina, V. (2014). Relationship of blood pressure with the electrical signal of the heart using signal processing. Tecciencia, 9(17), 9-14.
- Bonarjee, V. V. (2018). Arterial stiffness: a prognostic marker in coronary heart disease. available methods and clinical application. Frontiers in Cardiovascular Medicine, 5, 64.