
Research Article - (2025) Volume 3, Issue 2
Assessment of Water Quality Pollution Index For Fishing in Jibia Dam, Katsina, Nigeria
Received Date: May 27, 2025 / Accepted Date: Jun 20, 2025 / Published Date: Jun 30, 2025
Copyright: ©©2025 Aminu Ibrahim. This is an open-access article distributed under the terms of the Creative Commons Attribution License, which permits unrestricted use, distribution, and reproduction in any medium, provided the original author and source are credited.
Citation: Ibrahim, A. (2025). Assessment of Water Quality Pollution Index For Fishing in Jibia Dam, Katsina, Nigeria. J Water Res 3(2), 01-07.
Abstract
The study aim to assess Water Quality Pollution Index for Fishing in Jibia Dam, Katsina State. Improper monitoring of level of water quality in the dam may lead to pollution of the water and the death of fish. Water samples were collected at ten points in the wet and dry seasons 2019/2020, i.e., ten sample stations, thirteen parameters were analyzed using standard laboratory techniques. The parameters include Temperature (T), pH, Electric Conductivity (EC), Total Dissolve Solid (TDS), Turbidity (Tur), Total Hardness (TH), Chloride (Cl), Nitrate (NO3), Dissolve Oxygen (DO), Biological Oxygen Demand (BOD), Ammonia (NH3), Nickel (Ni), and Lead (Pb). Based on findings metal pollution index, (Cd), and water pollution index (WPI) status were determined. Findings of the research show that the metal pollution index (MPI) of the parameters is pure except for Ni which is slightly affected. Contamination Index (Cd) all the parameters are low in contaminants except (BOD), which is medium, (TDS) and (NH3) are higher contaminant indexes. For Water Pollution Index (WPI); (Temp.), pH, (Tur.), (EC), (Ni) and (Pb) are rated as good water by status. (TDS), (DO), (BOD), and (NH3) are unsuitable for fishing. (CL) and (NO3) are excellent statutory. Total Hardness is the only poor statutory finding in the study area. It is recommended that effective fishing activity be carried out in the reservoir since the water meets the standards of fishing.
Keywords
Assessment, Parameters, Pollution, Quality, Index, Water
Introduction
The quality (status of physicochemical parameters) of the freshwater ecosystem interacts with the biotic components of the ecosystem, such as plankton, aquatic insects, snails, and fish. Water quality affects the abundance, species composition/diversity, stability, productivity, and physiological condition of indigenous populations of aquatic organisms. Some species flourish in highly eutrophic waters, while others are very sensitive to organic or chemical waste [1]. Pollution refers to the introduction of harmful substances, such as toxic chemicals or excessive amounts of nutrients, into the environment, resulting in negative impacts on the quality of life for both humans and other living organism, Including plants and animal’s pollution of surface and groundwater is often caused by a variety of human activities, such as industrializations, urbanization, and agriculture, which release pollutants into these sources of water [2].
Freshwater sources in the form of rivers are considered a fundamental for the well-being of a healthy society. Unfortunately, during the last decades, these natural resources were being contaminated due to anthropogenic activities and natural disasters such as floods evaluated the water quality of the River Kaduna using a water quality index and revealed that the water quality of 4 sampling stations was poor and the overall quality of water was in marginal class since 11 samples out of 15 felt within the marginal stage [5].
Many researchers have used various statistical techniques in evaluating river water quality, which include multivariate statistical techniques, statistical kriging, indexing approaches, Fuzzy theory methods, geograhic information system (GIS), and remote sensing [6-10]. Other researchers have applied a water quality index (WQI) to assess the quality of surface water, such as [11]. These methods were developed under specific conditions, and, therefore, there is a need to choose an optimal water quality assessment method for the specific purpose and particular watershed [12]. Therefore, this study aimed at assessing the Water Quality Pollution Index for Fishing in Jibia Dam, Katsina State. The results were compared with international standard safe limits and standards, which will produce the statutory background knowledge to land experts and stakeholders for necessary action.
Therefore, the gap here To our knowledge, only little research was performed on the water quality index (WQI) to evaluate the quality of Jibia Dam water, and the quality of the water has not been fully exploited so far. There is a need for periodic monitoring of physico- chemical parameters found in Jibia Dam. Results obtained from this study will reveal the status of fish consumed by the populous from different areas.
Materials and Methods
Study Area: The dam was designed in 1987 and completed in 1989 and was built to support irrigation activities in Jibia LGA. The study was conducted on Jibia Dam, located in Jibia Local Government Area of Katsina State, in northwestern Nigeria, bordering Maradi Town of the Niger Republic. Jibia Town is located about 43 km west of Katsina Town, in Katsina State. Its coordinates are latitudes 13°04'18"N, 13°10'N, and longitudes 07°15'06"E, 07°.30'E (Figure1). We conducted the study between 2019 and 2020.
Sampling Points: Ten (10) points (Figure 3) wereselected in the dam, the edges, upstream, middle and downstream, were consider in the selection of samples, and 105 m interval between each station was also looked into as adopted from [13].

Figure 1: Jibia Dam showing Sampling Locations (Source: Field work, 2020)
Analytical Procedures and Laboratory Analysis
Water samples were analyzed for temperature (T), pH, electric conductivity (EC), total dissolved solids (TDS), turbidity, total hardness, chloride (Cl), nitrate (NO3), dissolved oxygen (DO), biological oxygen demand (BOD), ammonia (NH3), nickel (Ni), and lead (Pb). Temperatures were measured using a thermometer. Hydrogen ion concentrations (pH) were measured using a pH meter (pH 3505 Janway). Electrical conductivity (EC) was measured using an EC meter (EC 4510 Janway). DO and BOD using the Hannah HI 9143 meter.
Total dissolved solids (TDS), chloride (Cl2), and total hardness (TH) were measured using the titrimetric method. The standard method described by the American Public Health Association was used in the determination of these parameters [14]. Nitrate was determined by the UV-Vis spectrophotometer method at 220 and 275 wavelengths (nm), 1.8 bandpass (nm), 1.0 cell length (cm), and cell type "Quartz." Ammonia and nitrite were toxic to the fish. Nitrate is harmless and is produced by the autotrophic Nitrobacter bacteria combining oxygen and nitrite. Nitrate levels are normally stabilized in the 50100 ppm range. For NH3 The use of a bulb pipette quantitatively to transfer a 10 ml aliquot of the cleaning solution sample to a 100 ml volumetric flask.
Dilute to the mark with distilled water, replace the stopper, and mix the contents by inverting and swirling the flask a number of times. Using a bulb pipette, quantitatively transfer a 25-ml aliquot of the diluted cleaning solution sample to a 250-ml Erlenmeyer flask. Wash down the inside of the flask with about 50 ml of distilled water delivered from a wash bottle. Add 2 drops of methyl red indicator and mix well, after which readings are obtained [15]. Nickel (Ni) and lead (Pb) were determined using the AAS standard method. The analysis was done at the Soil and Water Laboratory, Geography Department, Umaru Musa ‘Yar’adua University Katsina, Nigeria.
Results and Discussion
Water Quality Pollution Index
The descriptive statistics of physicochemical parameters and total metal concentrations in Jibia Dam were calculated.
Contamination Index (Cd)
The result reveals the level of contaminated parameters was compared based on water quality classification value for fishing. Among the 13 parameters tested, the result indicated low contaminant index (Table 1 and 2, Appendix I). The Cd values for ten parameters were found to be low with contamination of <1, which is 76.92%. This indicate that the Jibia Dam is low polluted with respect to temperature, pH, electric conductivity, turbidity, total Hardness, chloride, nitrate, dissolve oxygen, nickel and lead (Table 2). Only BOD is a medium contamination index, with contamination ranges between (1-3) and constituting 7.69%. TDS and NH3 have a high contaminants index, (>3), and cover 15.39 % of the total parameters analyzed. The result is contrary to that of [16].
Evaluation of water quality pollution indices for heavy metal contamination monitoring, a study case from Akpabuyo- Odukpani area, Lower Cross River Basin (Southeastern Nigeria). This happens due to anthropogenic activities like onloading and uploading of oil as well as the nature of the barren land in the area. The findings of this study are similar to those of [17]. Evaluation of water quality pollution indices for groundwater resources of New Damietta, Egypt, which reveals the values vary between -5.1 and -0.3, which indicate low concentration.
Among all the parameters analyzed, the finding shows that Total Dissolve Solid (TDS) has the highest value in all the ten (13) parameters analyzed with mean value of 741.46, and Dissolve Oxygen (DO) in the study shows the lowest value with a mean value of -0.076 (Table 2). Results show that Jibia Dam of the present study is acceptable for fish activities, and there is a significant acceptable contamination index (Cd) status in Jibia Dam.
|
CONTAMINATION INDEX(Cd) |
Water quality status |
|
<1 |
Low |
|
3-Jan |
Medium |
|
>3 |
High |
|
Source: [18] |
|
Table1: Water Quality Classification Based on Contamination Index (Cd) Value for Fishing
|
S/N |
PARAMETERS |
Cn |
Ca |
Cd |
Status |
|
1 |
TEMP. |
30 |
26.81 |
-0.106 |
Low |
|
2 |
pH |
9 |
6.99 |
-0.223 |
Low |
|
3 |
EC |
200 |
116.95 |
-0.415 |
Low |
|
4 |
TDS |
0.13 |
96.52 |
741.46 |
High |
|
5 |
TUR. |
80 |
30.6 |
-0.618 |
Low |
|
6 |
TH |
150 |
196.83 |
0.312 |
Low |
|
7 |
CL |
250 |
96.15 |
-0.615 |
Low |
|
8 |
NO3 |
100 |
13.41 |
-0.866 |
Low |
|
9 |
DO |
67.13 |
62.04 |
-0.076 |
Low |
|
10 |
BOD |
20 |
45.93 |
1.297 |
Medium |
|
11 |
NH3 |
0.02 |
11.93 |
595.5 |
High |
|
12 |
Ni |
0.2 |
0.24 |
0.2 |
Low |
|
13 |
Pb |
0.1 |
0.13 |
0.3 |
Low |
Table 2: Contamination Index (Cd)
Metal Pollution Index (MPI)
The result of the analysis of the physicochemical parameters of the dam shows temperature, pH, electrical conductivity, total dissolved solids, turbidity, total hardness, chloride, nitrate, DO, BOD, ammonia, and lead are within the range of pure status.
Only one variation in the Metal Pollution Index (MPI), which is nickel (Ni), is slightly affected by pollution (Table 3 and 4). The result is substantiated with Evaluation of Water Quality Pollution Indices for Ground Water Resources of New Damietta, Egypt [17]. The result showed that concentrations of the Metal Pollution Index (MPI) are within the permissible WHO limits; the ranges between stations are 0.00016 to 0.0016, 0.003 to 0.00, 0.00, 0.006 to 0.00, 0.00 to 0.004, and 0.002 mg/l. The result is contrary to our work but within the limit. The result of MPI shows 92.31% of the concentration is pure and 7.69 is slightly affected.
Among all the parameters analyzed, the finding shows that Total Nickel (Ni) has the highest value in all thirteen (13) parameters with a value of 1.20 mg/l, and Total Dissolved Solid (TDS) in the study shows the lowest value with 0.503 mg/l. There is a significant acceptable Metal Pollution Index (MPI) status in Jibia Dam (Table 4).
|
Class |
Characteristics |
MPI |
|
I |
Very pure |
<0.3 |
|
II |
Pure |
0.3-1.0 |
|
III |
Slightly affected |
1.0-2.0 |
|
IV |
Moderately affected |
2.0-4.0 |
|
V |
Strongly affected |
4.0-6.0 |
|
VI Seriously affected >6.0 |
||
|
Source: [19]. |
||
Table 3: Water Quality Classification using Metal Pollution Index
|
S/N |
PARAMETERS |
MAC |
Ci |
(MPI) |
Status |
|
1 |
TEMP. |
27 |
26.81 |
0.993 |
Pure |
|
2 |
pH |
7.27 |
6.99 |
0.963 |
Pure |
|
3 |
EC |
133.58 |
116.95 |
0.876 |
Pure |
|
4 |
TDS |
191.72 |
96.52 |
0.503 |
Pure |
|
5 |
TUR. |
55.66 |
30.6 |
0.55 |
Pure |
|
6 |
TH |
215.57 |
196.83 |
0.913 |
Pure |
|
7 |
CL |
103.49 |
96.15 |
0.93 |
Pure |
|
8 |
NO3 |
15.12 |
13.41 |
0.887 |
Pure |
|
9 |
DO |
67.13 |
62.04 |
0.924 |
Pure |
|
10 |
BOD |
51.01 |
45.93 |
0.9 |
Pure |
|
11 |
NH3 |
12.84 |
11.93 |
0.932 |
Pure |
|
12 |
Ni |
0.28 |
0.24 |
1.2 |
Slightly affected |
|
13 |
Pb |
0.2 |
0.13 |
0.65 |
Pure |
|
Source: Survey 2020 |
|||||
Table 4: Metal Pollution Index (MPI)
Water Pollution Index (WPI)
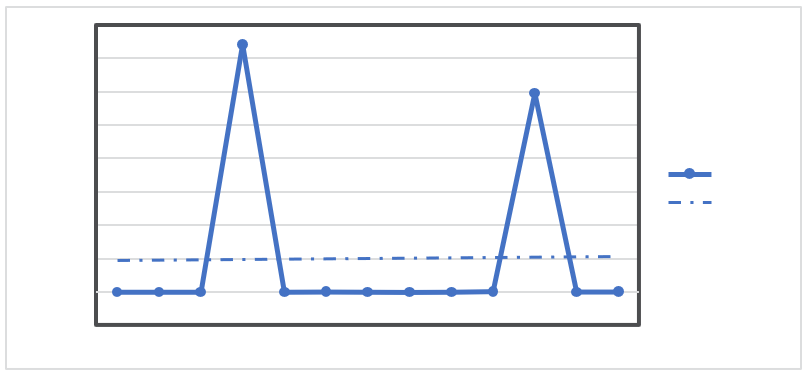
Water Pollution Index (WPI) was compared with Table 4 water quality classification value for fishing. Among the 13 parameters tested, the result indicated temperature, electrical conductivity, pH, biological oxygen demand, chloride, turbidity (Tur), total hardness (TH), nitrate (NO3), nickel (Ni), and lead (Pb) are very pure, which constitute 76.92%. Dissolve oxygen (DO) is the only pure that is 7.69% (Table 6). Ammonia (NH3) and Total Dissolve Solid (TDS) are the heavily impure, which is 15.39% based on the water pollution index status remark (Tables 5 and 6). The result shows that there is pronounced variation in terms of those parameters at Jibia Dam.
The result is substantiated by that of, who studied a comparative approach to a series of physicochemical quality indicators used in assessing water quality in the Lower Danube, Romania, which revealed major as pure based on WPI rank [20]. studied water pollution index assessment of capture and culture fisheries in Barpeta district, Assam, India [21]. The study reveals in both the capture and culture fisheries that a water pollution index is found indicating poor water quality status, which suggests proper management of the fisheries to yield better growth dynamics, contrary to those findings due to spacio- anthropogenic and climatic factors [22].
Among all the parameters analyzed, the finding of WPI shows that Total Dissolve Solid (TDS) has the highest value in all the ten (13) parameter stations with a mean value of 57.14 and Nitrate (NO3) with the lowest value of 0.01 from Jibia Dam. There is a significant acceptable water pollution index.
|
WPI Value |
Water Quality Class |
|
≤0.3 |
Very pure |
|
0.3–1.0 |
Pure |
|
1.0–2.0 |
Moderately polluted |
|
2.0–4.0 |
Polluted |
|
4.0–6.0 |
Impure |
|
≥6.0 |
Heavily impure |
|
Source: [23] |
|
Table 5: Water Quality Classification Based on the Water Pollution Index (WPI)
|
Parameters |
Ai |
T |
Ai/ T |
WPI |
Remark |
|
Temperature |
28.81 |
30 |
0.86 |
0.069 |
Very pure |
|
Electrical conductivity (EC) |
116.95 |
200 |
0.59 |
0.045 |
Very pure |
|
Ph |
6.99 |
9 |
0.78 |
0.06 |
Very pure |
|
Dissolved oxygen (DO) |
62.04 |
6 |
8.86 |
0.68 |
Pure |
|
Biological oxygen Demand (BOD) |
45.93 |
20 |
2.3 |
0.18 |
Very pure |
|
Chloride (CL) |
96.15 |
250 |
0.39 |
0.03 |
Very pure |
|
Ammonia (NH3) |
11.93 |
0.02 |
596.5 |
45.89 |
Heavily impure |
|
Total Dissolved Solid (TDS) |
96.52 |
0.13 |
742.46 |
57.14 |
Heavily impure |
|
Turbidity (TUR.) |
30.6 |
80 |
0.383 |
0.03 |
Very pure |
|
Total hardness (TH) |
196.83 |
150 |
1.31 |
0.1 |
Very pure |
|
Nitrate (NO3) |
13.41 |
100 |
0.13 |
0.01 |
Very pure |
|
Nickel (Pb) |
0.24 |
0.2 |
1.2 |
0.09 |
Very pure |
|
Lead (Pb) |
0.13 |
0.1 |
1.3 |
0.1 |
Very pure |
|
Source: [24] |
|||||
Table 6: Water Pollution Index (WPI)
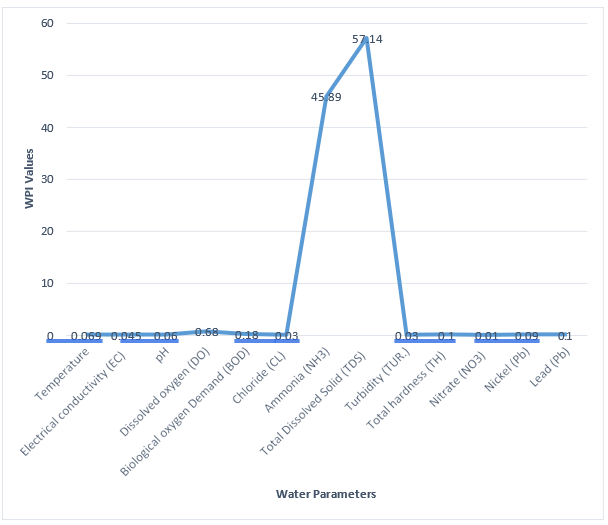
Figure 2: Graphical Presentation of Water Pollution Index Values
Conclusion
The result reveals the contamination index (Cd) level of parameters were compared based on water quality classification value for fishing, values for ten parameters were found to be low with contamination, which is 76.92%, 7.69% medium, and 15.39% are high. 92.31% of the metal Pollution Index (MPI) is within the range of pure status, only 7.69 are slightly affected. The water pollution index reveals 76.92% very pure, 7.69% pure, and 15.39% heavily impure for fish farming. The water is healthy for fishing. Conclusively Contamination Index (Cd), the metal pollution index (MPI) and the water pollution index (WPI) remarks show the water is healthy for fishing. Findings reveal without considering the level of water quality in the dam, which may lead to the death of fish and contamination of the water.
Acknowledgements
The authors acknowledge the technical assistance and contributions of the Geography department (in particular, Mal. Aminu Muazu and M. Abubakar) at Umaru Musa Yaradua University, Katsina.
Conflict of Interest
The Authors have declared that no conflict of interest.
References
- Auta, T., Alexander, A., & Bichi, A. H. (2023). Wet Season Water Quality and Zooplanktons Community of Jibia Lake, Katsina State, Nigeria. Asian Journal of Biological Science, 16, 175-186.
- Aminu, M., Musa, M. S., Chiroma, S. S., Nafiu, K., & Zainab,K. R. Assessment of seasonal variations of some heavy metals in water samples collected from Gwaigwaye, Maska and Zobe dams.
- Bora, M., & Goswami, D. C. (2017). Water quality assessment in terms of water quality index (WQI): case study of the Kolong River, Assam, India. Applied Water Science, 7, 3125- 3135.
- Mohammed, S. I., & Abdulrazzaq, K. A. (2018). Developing water quality index to assess the quality of the drinking water. Civil Engineering Journal, 4(10), 2345-2355.
- Ogbozige, F. J., Adie, D. B., Igboro, S. B., & Giwa, A. (2017). Evaluation of the water quality of River Kaduna, Nigeria using water quality index. Journal of Applied Sciences and Environmental Management, 21(6), 1119-1126.
- Chabuk, A., Al-Madhlom, Q., Al-Maliki, A., Al-Ansari, N., Hussain, H. M., & Laue, J. (2020). Water quality assessment along Tigris River (Iraq) using water quality index (WQI) and GIS software. Arabian Journal of Geosciences, 13, 1-23.
- Karamouz, M., Kerachian, R., Akhbari, M., & Hafez, B. (2009). Design of river water quality monitoring networks: a case study. Environmental Modeling & Assessment, 14, 705- 714.
- Donald, A. E., & Blessing, U. A. (2019). Index approach to water quality assessment of a south eastern Nigerian river. International Journal of Fisheries and Aquatic Studies, 7(1), 153-159.
- Wang, W. C., Xu, D. M., Chau, K. W., & Lei, G. J. (2014). Assessment of river water quality based on theory of variable fuzzy sets and fuzzy binary comparison method. Water resources management, 28, 4183-4200.
- Huda M, M., &Al-Ansari, N. (2018). Geographical Information System and Remote Sensing for WaterResources Management Case Study: The Diyala River, Iraq. International J. of Civil Engineering and Technology, 9(12), 971-984.
- Olasoji, S. O., Oyewole, N. O., Abiola, B., & Edokpayi, J. N. (2019). Water quality assessment of surface and groundwater sources using a water quality index method: A case study of a peri-urban town in southwest, Nigeria. Environments, 6(2), 23.
- Babic, G., Vukovic, M., Voza, D., Takic, L., & Mladenovic- Ranisavljevic, I. (2019). Assessing Surface Water Quality in the Serbian Part of the Tisa River Basin. Polish Journal of Environmental Studies, 28(6).
- Khan, W., Vahab, A., Masood, A., & Hasan, N. (2017). Water quality requirements and management strategies for fish farming (A case study of ponds around Gurgaon Canal Nuh Palwal). International Journal of Trend in Scientific Research and Development, 2(1), 388-393.
- Rice, E. W., Baird, R. B., Eaton, A. D., & Clesceri, L. S. (2012). Standard methods for the examination of water and wastewater.
- Arnold, G. E., Lenore, S. G., & Andrew, O. E. (1999). Standard methods for the examination of water and waste water. American Public Health Association, 1015 Fifteenth Street, Washington DC.
- Edet,A. E., & Offiong, O. E. (2002). Evaluation of water quality pollution indices for heavy metal contamination monitoring. A study case from Akpabuyo-Odukpani area, Lower Cross River Basin (southeastern Nigeria). GeoJournal, 57, 295-304.
- El-Hamid, H. T. A., & Hegazy, T. A. (2017). Evaluation of water quality pollution indices for groundwater resources of New Damietta, Egypt. MOJ Ecology Environmental Science, 2(6), 00045.
- Mohan, S. V., Nithila, P., & Reddy, S. J. (1996). Estimation of heavy metals in drinking water and development of heavy metal pollution index. Journal of Environmental Science & Health Part A, 31(2), 283-289.
- Lyulko, I., Ambalova, T., & Vasiljeva, T. (2001). To integrated water quality assessment in Latvia. In MTM (monitoring tailor-made) III, proceedings of international workshop on information for sustainable water management, Netherlands (pp. 449-452).
- Calmuc, M., Calmuc, V., Arseni, M., Topa, C., Timofti, M., Georgescu, L. P., & Iticescu, C. (2020). A comparative approach to a series of physico-chemical quality indices used in assessing water quality in the Lower Danube. Water, 12(11), 3239.
- Rajbongshi, M. K., Das, J., & Dutta, R. K. (2016). Water quality assessment of capture and culture fishery in Barpeta district, Assam, India. International Journal of Fisheries and Aquatic Studies, 4(5), 516-520.
- Al-Ani, I. A. (2019). Mathematical computation of water quality index for the assessment of Al-Hilla river ecosystem. International Journal of Civil Engineering and Technology, 10(1), 1862-1869.
- Ibrahim, A. (2022). Assessment of water quality for fishing in Jibia Dam, Katsina State. An M. Sc Dissertation submitted to the Department of Geography BUK.
- Hassan, M., & Salihu, N. (2021). Assessing River Water Quality using Weighted Arithmetic Water Quality Index in River Gada, Katsina State, Nigeria. Dutse Journal of Pure and Applied Sciences (DUJOPAS), 7.
Appendix I
Contaminant Index Status (Cd)