
Advances in Nanoscience and Nanotechnology(ANN)
ISSN: 2640-5571 | DOI: 10.33140/ANN
Impact Factor: 0.9

Research Article - (2025) Volume 9, Issue 2
Assessment of Water Quality of Private Dug Wells in Hebron District Using Water Quality Index
Received Date: Oct 22, 2025 / Accepted Date: Nov 21, 2025 / Published Date: Nov 27, 2025
Copyright: ©2025 Adel A. Salayma. This is an open-access ar-ticle distributed under the terms of the Creative Commons Attribution License, which permits unrestricted use, distribution, and reproduction in any medium, provided the original author and source are credited.
Citation: Salayma, A. A. (2025). Assessment of Water Quality of Private Dug Wells in Hebron District Using Water Quality Index. Adv Nanoscie Nanotec, 9(2),01-06.
Abstract
People in the West Bank of Palestine use groundwater as the main source of water, representing almost 90% of the total water supply. Water Quality Index (WQI) is one of the most effective tools to communicate information on the quality of water to the concerned citizens and policy makers. Water quality index was used as a tool to assess water quality of the private dug wells in Hebron district. This study reveals that 4 % of the tested wells have excellent water class, 21% of wells have good class, 28% of wells have poor water quality class, and 36% of wells were in unfit for direct use class.
Keywords
Groundwater Quality, Water Quality Index, Hebron DistrictIntroduction
Groundwater is about 20% of the world’s fresh water supply, which is about 0.61% of the entire world’s water; groundwater is formed by seepage from the seas, oceans and water bodies and direct seepage of rain water into the ground [1]. In arid and semi¬arid regions (like west bank of Palestine) the groundwater is the main source of water supply and approximately 50% of the urban population worldwide has been estimated to use groundwater [2-4]. Groundwater quality depends on soil formations, the chemical composition of the underlying rocks, and the length of time that the water body has been trapped underground [2].
The quality of groundwater has been deteriorating because of shrinking water table, introduction of chemical compounds, bad industrial waste management practices, improper sanitation, improper irrigation practices and by leachate produced by industrial waste disposed on land [5]. In West Bank of Palestine, mainly in rural areas, the most important source of groundwater pollution is cesspits, which lead to high nitrate concentration, excessive salinity and bacterial contamination [3].
The degree of groundwater pollution depends on the amount and types of waste disposed on land, hydrologic properties of the aquifer, recharge capacity of the area, climate, and rate of pumping out of water, the quality of groundwater must be checked from time to time in order to supply safe drinking water [5]. Drinking contaminated groundwater has been reported to cause various health problems, such as diarrhoea, cholera, dysentery, and skin infections [4].
Water quality index is valuable tool to reflect the overall water quality status in a single term, it enables to know the suitability of water for human consumption, to compare water quality of different areas at certain water body, to provide a general assessment of the water quality, helpful for the selection of appropriate treatment technique, and to provide information on the quality of water to the concerned citizens and policy makers [2,4-7].
Study Area
Hebron district (figure 1) is located in the south of the West Bank. It is a mountainous area with an average height of800 m, Hebron district climate ranges from arid to semiarid with an increase in aridity towards the Negev Desert in the south and the Jordan Valley in the east. The monthly average temperature ranges from 7.5 to 10°C in winter to 22°C in summer. The minimum temperature is -3°C in January and the maximum is 40°C in August. Most of the rainfalls are during December through February, although there may be rain from midâ?October to the end of April. The number of rainfalls per month ranges between 400 mm during the rainfall season [8].
Methodology
Groundwater quality data used in this study were obtained from the database of water quality laboratory of Hebron municipality from 14/10/2020 till 24/8/2022 with a total number of 53. No data were available about geographical distribution and depth of wells. The water quality index was calculated using Water Qual¬ity Index Calculator: Concentration to WQI (https://sciph.info/water-quality-index-calculator-concentra-tion-to-wqi/?_ga=2.18010105.1563190296.1692022213-1071520157.1692022213). The parameters used in WQI calculation were PH, turbidity, TDS, hardness, sulfate, nitrate, alkalinity and total coliform. The effect of each parameter on WQI result was studied using different concentration of each parameter, and which concentration of each parameter that change the class of water quality index was indicated. SPSS version 20 was used to analyse data which includes:
1. Descriptive analysis (min., max. and mean)
2. Correlation coefficient between parameters and WQI.
3. Frequencies of different parameters and WQI.
4. T test

Figure 1: Study area map (source: Security GIS Unit, Al-Istiqlal University, Jericho- Palestine)
Results and Discussion
Descriptive statistics for all water quality parameters of private dug wells in Hebron district are shown in Table 1; the parameters include many variables, such as the minimum value (Min), maximum value (Max), mean, and Standard Deviation (SD). Values of WQI ranges from 37.33 to 640.21 with average of 244.34. The percentages of each parameter that exceed Palestinian standards are shown in Table 2.
Table 1: Descriptive Statistics of Water Quality Parameters of Private Dug Wells at Hebron District
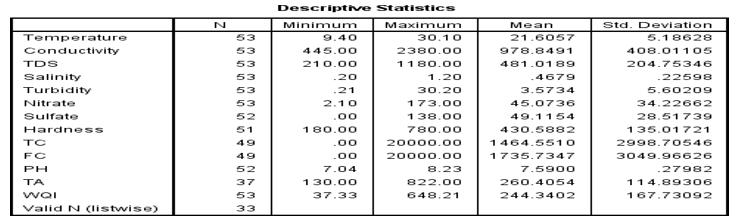
Table 2: Percentage of Each Parameter That Exceeds Who and Palestinian Standards
|
Parameter |
Palestinian Standards |
Parameters percentage of private dug well that exceed WHO and Palestinian standards |
|
Conductivity |
< 2000 |
3.8% |
|
TDS |
< 1000 |
43.4 % |
|
Salinity |
< 1 |
3.8% |
|
Nitrate |
50 |
35.8% |
|
Sulfate |
250 |
0% |
|
Hardness |
500 |
55% |
|
TC |
0 – 3 |
92.5% |
|
FC |
0 |
94.3% |
|
PH |
6.5 – 8.5 |
1.9% |
|
Total alkalinity |
< 400 |
3.8% |
|
Turbidity |
< 5.0 |
24.5% |
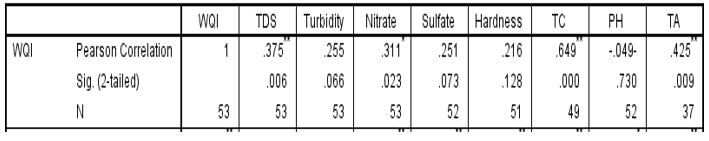
From correlation coefficient values between WQI and water quality parameters, the most affecting factors for WQI values were Conductivity, TDS, Salinity, Total alkalinity, Nitrate, TC and FC (Table 3).
Table 3: Correlation Coefficient Values Between Wqi and Water Quality Parameters
Water quality index results in this study shows that 4 % fall within excellent water quality class, 21% were located in good water quality class, On the other hand 39 % of wells were located in poor and very poor water quality classes, and 36 % in unfit for direct use class (Table 4) and figure 2.
Table 4: Percentage of Different Classification of Water Quality Index in Private Dug Wells in Hebron District
|
WQI Range |
Water Type |
Percentage |
|
< 50 |
Excellent water |
4 % |
|
50.1 - 100 |
Good water |
21 % |
|
100.1 - 200 |
Poor water |
28 % |
|
200.1 - 300 |
Very poor water |
11 % |
|
>300 |
Unsuitable for drinking purposes |
36 % |
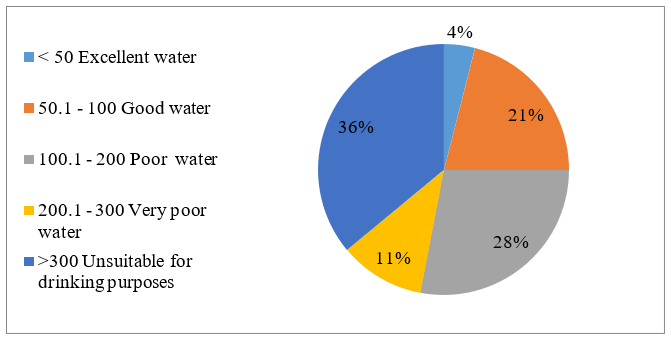
Figure 2: Pie Figure Illustrate Percentage of Different Classes of Water Quality Index at Hebron District – Palestine
Excellent water quality class could be used for drinking, irrigation and industrial uses, good water quality class could be used for domestic, irrigation, and industrial uses, poor water quality class could be used for irrigation and industrial uses, and water in unfit for direct use class will require proper treatment before use [9]. In excellent water class the concentration of water quality parameters were found to be below the standard limit, in good water class the concentration of the parameters were found to be within the standard limit, in poor water class the concentration of the parameters were found to be above the standard limit [7,10]. Hyarat et al, 2022 in her study Assessment of groundwater quality using water quality index (WQI) and multivariate statistical analysis in Amman-Zarqa area/Jordan, reported that 12% of water samples lie in the ‘excellent’ category, 53% in the ‘good’ one which is higher than the result of this study [10].
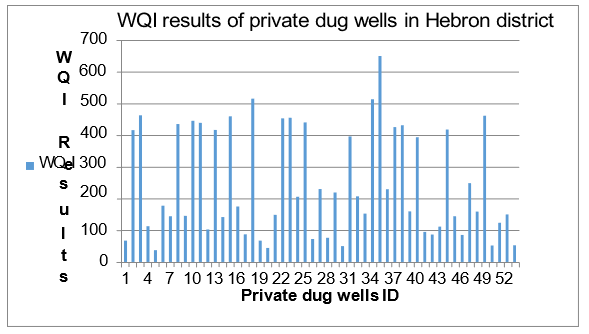
Fiqure 3: WQI Results of Private Dug Wells of Hebron District.
The WQI rating places 10% of the pre-monsoon groundwater samples in the excellent category and 52% in the good water category for drinking. Just 5% of the groundwater samples were deemed hazardous for ingestion, as opposed to 23% of the samples having terrible water quality and 10% having poor water quality figure 3 [11].
El Hammioui et al, 2024 in his study about assessing the groundwater quality in the Khenifra Province, Morocco reported that WQI results ranging from 55.24 to71 indicated that the groundwater quality in the study area was good throughout the study period without giving any percentage for these good results [12].
El Baba et al 2020 in his study about Evaluation of the Groundwater Quality Using the Water Quality Index and Geostatistical Analysis in the Dier al-Balah Governorate, Gaza Strip, of Palestine reported WQI results as GIS map in years 2009 through 2014 of wells of different regions of Dier al-Balah Governorate without giving percentage of water quality index classes [13].
Aish et al, 2023 in his study about Prediction of groundwater quality index in the Gaza coastal aquifer using supervised machine learning techniques reported that the results show that a total of 26,505, 964, 608, and 346 samples out of 2448 (1%, 21%, 39%, 25%and 14%) were classified into the groundwater categories of ‘excellent’, ‘good’, ‘poor', 'very poor’, and ‘unsuitable’, respectively [14].
Karakus, 2018 in his study Evaluation of groundwater quality in Sivas province (Turkey) using water quality index and GIS-based analytic hierarchy process, reported that WQI values in wet season were 56.25% of the water samples are rated as ‘excellent’, 35.41% are rated as ‘good’, 6.25% are rated as ‘bad’ and 2.08% are rated as ‘not suitable for drinking’ in terms of drinking water quality. In dry season 47.91% of the WQI values are rated as ‘excellent’, 29.16% are rated as ‘good’, 20.83% are rated as ‘bad’ and 2.08% are rated as ‘not suitable for drinking [15].
To study the effect of concentration of each parameter on WQI value, WQI value was calculated against different concentration of each parameter and T test was used to check if the change in WQI value is significant or not depending on p value of each test and to find which concentration of the parameter that change the class of WQI.
All the changes in WQI values due to changes in parameter concentrations are significant (2 tailed significance values are less than 0.05) even the change in the concentration itself is not significant for TDS, nitrate, total alkalinity, and total coliform (Table 5).
Table 5: P value for T Test of Each Parameter Concentration Change Used to Calculate WQI.
|
Parameter |
P values for parameters |
P values for WQI |
|
TDS |
0.198 |
0.004 |
|
Nitrate |
0.064 |
0.000 |
|
Sulfate |
0.012 |
0.000 |
|
Hardness |
0.020 |
0.000 |
|
Total Coliform |
0.072 |
0.012 |
|
PH |
0.000 |
0.000 |
|
Total alkalinity |
0.117 |
0.001 |
|
Turbidity |
0.048 |
0.006 |
The concentration of hardness that change the class of WQI from excellent to good is 200 mg/l, the change of concentration of sulfate from 1mg/l till 200mg/l doesn't change the class of WQI but still in good class, TDS concentration of 100 mg/l change the class from excellent to good, lowering PH below 7.0 increase WQI and increasing over 7.0 will increase WQI value.
Increase in turbidity lead to increase in WQI but still in the same class till 10 NTU. The high value of the water quality index (WQI) was due to high values of Iron, phosphate, pH and electrical conductivity [7].
Drinking water quality index, which, at low values, obscures or masks very important parameters such as nitrate despite having levels that exceed WHO guidelines, so he recommends to use nitrate pollution index in addition to WQI [16]. In this study results we found that nitrate result is less than 50 mg/l in samples categorized as excellent and good class except in 3 samples (18,29,43) which has values (65,56.5,55mg/l) respectively.
Conclusion
This study found that only 25 % of private dug well in Hebron district is suitable for drinking (excellent and good classes),39 % of dug wells have poor and very poor water quality which could be used for irrigation and industrial uses while 36 % were unfit for uses before proper treatment method.
Recommendation
All water produced from private dug wells should be tested before using it for drinking and food preparation.
Acknowledgment
The author greatly thanks Hebron municipality water quality laboratory for providing the data for dug wells testing results and to MR. Mohamad Burqan, security GIS unit, Al-Istiqlal university, Jericho - Palestine for providing Hebron district map.
References
- Salayma, A. (2025). Assessment of water quality of private dug wells in Hebron District using water quality index.
- Hosseinifard, S. J., & Mirzaei Aminiyan, M. (2015). Hydrochemical characterization of groundwater quality for drinking and agricultural purposes: a case study in Rafsanjan plain, Iran. Water Quality, Exposure and Health, 7(4), 531-544.
- Zohud, A., & Alam, L. (2022). A Review of Groundwater Contamination in West Bank, Palestine: Quality, Sources, Risks, and Management. Water 2022, 14, 3417.
- Wang, X., Tian, Y., & Liu, C. (2023). Assessment of groundwater quality in a highly urbanized coastal city using water quality index model and bayesian model averaging. Frontiers in Environmental Science, 11, 1086300.
- Kumari, S., & Rani, J. (2014). Assessment of water quality index of ground water in Smalkhan, Haryana. International journal of latest research in science and technology, 3(6), 169-172.
- Guettaf, M., Maoui, A., & Ihdene, Z. (2017). Assessment of water quality: a case study of the Seybouse River (North East of Algeria). Applied water science, 7(1), 295-307.
- Udom, G. J., Nwankwoala, H. O., & Daniel, T. E. (2016). Determination of water quality index of shallow quaternary Aquifer systems in Ogbia, Bayelsa State, Nigeria. British Journal of Earth Sciences Research, 4(1), 23-37.
- Anabtawi, F., Mahmoud, N., Al-Khatib, I. A., & Hung, Y. T. (2022). Heavy metals in harvested rainwater used for domestic purposes in rural areas: Yatta Area, Palestine as a case study. International Journal of Environmental Research and Public Health, 19(5), 2683.
- Atta, H. S., Omar, M. A. S., & Tawfik, A. M. (2022). Water quality index for assessment of drinking groundwater purpose case study: area surrounding Ismailia Canal, Egypt. Journal of Engineering and Applied Science, 69(1), 83.
- Hyarat, T., Al Kuisi, M., & Saffarini, G. (2022). Assessment of groundwater quality using water quality index (WQI) and multivariate statistical analysis in Amman-Zarqa area/Jordan. Water Practice & Technology, 17(8), 1582-1602.
- Sivakumar, V., Ramamoorthy, V. L., Muthaiyan, U. M., Kaliyappan, S., Ravindiran, G., Shanmugam, S., ... & Abdo,H. G. (2023). Assessing groundwater quality for sustainable drinking and irrigation: a GIS-Based hydro-chemical and health risk study in Kovilpatti Taluk, Tamil Nadu. Water, 15(22), 3916.
- El Hammioui, Y., Belghiti, M. L., Boutagayout, A., Hili, A., El Boute, S., Hilali, A., ... & Abba, E. H. (2025). Assessing the groundwater quality in the Khenifra Province, Morocco.Mediterranean Geoscience Reviews, 7(1), 119-137.
- El Baba, M., Kayastha, P., Huysmans, M., & De Smedt, F. (2020). Evaluation of the groundwater quality using the water quality index and geostatistical analysis in the Dier al-Balah Governorate, Gaza Strip, Palestine. Water, 12(1), 262.
- Aish, A. M., Zaqoot, H. A., Sethar, W. A., & Aish, D. A. (2023). Prediction of groundwater quality index in the Gaza coastal aquifer using supervised machine learning techniques. Water Practice & Technology, 18(3), 501-521.
- Karakus, C. B. (2019). Evaluation of groundwater quality in Sivas province (Turkey) using water quality index and GIS-based analytic hierarchy process. International journal of environmental health research, 29(5), 500-519.
- Khaled, E. B., Obeidat, M., Al-Ajlouni, A., Awawdeh, M., & Dalo, M. A. (2024). Demarcation of Groundwater Quality Using Drinking Water Quality Index (DWQI), Nitrate Pollution Index (NPI), and Irrigation Indices: A Case Study from Jerash Region. Jordan Journal of Earth & Environmental Sciences, 15(1).