
Journal of Plasma Chemistry and Plasma Processing Research(JPCPPR)
ISSN: 2834-359X | DOI: 10.33140/JPCPPR
Impact Factor: 1.20


Research Article - (2025) Volume 6, Issue 1
Assessment of Metal and Heavy Metal Concentrations in The Angola Catchment, Freetown, Sierra Leone
2Institute of Environmental Management and Quality Control, Njala University, Sierra Leone
3Mathematics Department, Milton Margai Technical University, Sierra Leone
Received Date: Jun 17, 2025 / Accepted Date: Jul 28, 2025 / Published Date: Aug 04, 2025
Copyright: ©©2025 Yahaya Kudush Kawa, et al. This is an open-access article distributed under the terms of the Creative Commons Attribution License, which permits unrestricted use, distribution, and reproduction in any medium, provided the original author and source are credited.
Citation: Kawa, Y. K., Tommy, S. S., Tommy, G. Kawa, V. O. (2025). Assessment of Metal and Heavy Metal Concentrations in The Angola Catchment, Freetown, Sierra Leone. J Pla Che Pla Pro Res, 6(1) 01-07.
Abstract
The study examines the levels of heavy metals in the Angola Catchment Area of Freetown, Sierra Leone, and their potential impacts on human health and the aquatic ecosystem. Monthly water samples were collected from March to December 2024 at three distinct locations: upstream, midstream, and downstream, totalling ten months of data collection. Seven heavy metals were analyzed: arsenic (As), manganese (Mn), copper (Cu), iron (Fe), zinc (Zn), lead (Pb), and chromium (Cr).
The results indicated that chromium, and manganese levels consistently exceeded the World Health Organization (WHO) recommended limits. In contrast, lead and arsenic were undetectable at all three sampling sites. These findings raise significant environmental concerns regarding heavy metal contamination, which poses health risks to both aquatic organisms and the local population due to the potential for bioaccumulation. The study underscores the urgent need for enhanced monitoring and regulation of human activities to mitigate the adverse effects of these hazardous metals in water bodies.
Keywords
Heavy Metals, Water Quality, Angola Catchment, Bioaccumulation, Aquatic EcosystemIntroduction
Heavy metal pollution is a pressing global environmental issue, with significant implications for human health and ecological integrity. Metals such as lead, cadmium, mercury, and arsenic are of particular concern due to their toxicity, persistence in the environment, and bioaccumulation potential [1,2]. In urban areas, the discharge of industrial effluents, untreated sewage, and runoff from roads and agricultural fields often leads to elevated levels of these metals in surface water and sediments [3].
In Sierra Leone, rapid urbanization and a lack of effective waste management systems exacerbate the risks of heavy metal con- tamination. Freetown, the capital city, has experienced significant population growth, resulting in increased pressure on local water resources [4]. This urban sprawl, combined with historical min- ing activities, raises serious concerns about the potential for heavy metal accumulation in local waterways, including the Angola Catchment.
The Angola Catchment is an essential water resource for commu- nities in Freetown, providing water for domestic, agricultural, and recreational purposes. However, the catchment is not only suscep- tible to pollution from urban runoff but also from nearby indus- trial activities and mining operations [5]. Previous studies have indicated that urban catchments often exhibit elevated heavy metal concentrations due to these anthropogenic influences [6].
Research has shown that heavy metals can have severe adverse effects on aquatic ecosystems. For instance, lead is known to cause neurological damage in both humans and wildlife, while cadmium is linked to renal dysfunction and skeletal deformities [7,8]. The bioavailability of heavy metals in aquatic systems can also lead to bioaccumulation in the food chain, posing risks to higher trophic levels, including humans [9].
The potential for heavy metal contamination in the Angola Catch- ment is compounded by the region's socio-economic challenges. Many residents rely on untreated water sources for drinking and cooking, heightening the risk of exposure to harmful substances [10]. This reliance underscores the importance of assessing water quality to protect public health and promote sustainable develop- ment in Freetown.
Despite the recognized importance of monitoring heavy metal levels, there is a significant lack of comprehensive data regarding the concentrations of these pollutants in the Angola Catchment. Few studies have systematically examined the extent of contamination or the seasonal variations in heavy metal concentrations [4]. This gap in knowledge presents a critical need for targeted research to understand the current status of water quality in this vital catchment.
This study aims to assess the concentration of heavy metals in both water and sediment samples from the Angola Catchment. By employing rigorous sampling and analytical techniques, this research will provide valuable baseline data that can inform local policymakers and stakeholders about the potential risks associated with heavy metal pollution. Furthermore, understanding the spatial and temporal patterns of contamination will be crucial for effective environmental management.
In addition to assessing current heavy metal concentrations, this study will explore potential sources of pollution within the catchment. Identifying key contributors to contamination can help target interventions and improve water quality management practices. The findings will also serve as a critical resource for raising public awareness about the dangers of heavy metal exposure and the importance of environmental stewardship.
The significance of this research extends beyond academic inquiry; it has the potential to contribute to the development of strategies aimed at mitigating heavy metal pollution in the Angola Catchment. By addressing the urgent need for data-driven decision-making, this study aspires to support the health and well- being of communities in Freetown while promoting sustainable environmental practices.
Materials and Methods
Description of the Study Area
The Angola Community is located in the eastern part of Freetown, Sierra Leone’s capital, within the Western Area Urban District as shown in Figure 1. This residential neighbourhood is characterized by high population density and features a mix of residential homes, small businesses, and local markets that serve the community’s needs.
The area is defined by its narrow streets, informal settlements, and a vibrant atmosphere that reflects a blend of modern and traditional Sierra Leonean culture. While some parts of Angola Community lack adequate infrastructure and facilities, housing varies from basic single-story dwellings to more developed multi- story buildings.
Residents of Angola Community engage in various local economic activities, including services, agriculture, and trading. However, the neighbourhood faces challenges associated with urbanization, such as limited access to sanitation facilities, electricity, and clean water in certain areas.
Like much of Freetown, Angola Community experiences a humid tropical climate, characterized by warm temperatures year-round and a distinct rainy season. Its strategic location near other significant neighbourhoods in Freetown allows for easy accessibility from the city centre and other key areas of the capital.

Figure 1: Map Showing Angola Catchment Area
Sample and Sampling Procedure
Water samples were collected from three distinct locations: upstream, midstream, and downstream. A total of 500 ml clean plastic bottles, each thoroughly rinsed with the water to be sampled, were utilized for this purpose. Sampling took place monthly over a ten-month period, from March to December 2024. At each of the three locations, 500 ml of water was collected for analysis each month.
To prevent contamination and waste, each sample was gathered in a new plastic bottle and sealedsecurely. Following collection, the samples were transported in an ice cooler to the National Laboratory of the Ministry of Water Resources in Freetown for further analysis
Laboratory Analyses
All parameters, except for lead and arsenic, underwent photometric chemical analysis. The water quality characteristics analyzed included chromium (Cr), zinc (Zn), manganese (Mn), lead (Pb), iron (Fe), and arsenic (As). For the determination of lead and arsenic levels, colorimetric methods were employed using specialized kits designed for these heavy metals.
Sample and Sampling Procedure
Three locations were used to collect water samples: upstream, midstream, and downstream. Using 500 fresh plastic bottles that had been well cleaned with the water to be collected, samples were taken every month for ten months starting from March to December 2024. 500ml of water was taken from each of the three locations for the analyses for each month. To avoid contamination and waste, each sample was taken in a brand-new, fresh plastic bottle and carefully sealed. For analysis, samples were shipped in an ice cooler to the Ministry of Water Resources' National Laboratory in Freetown.
Water Quality Index Calculation
The WQI was calculated using the weighted arithmetic index method of parameter computation. The WQI under consideration is of the following format:
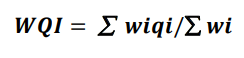
Where:
qi = Quality rating for the ith water quality parameters, Wi = Unit weight for the ith parameters In this study, there were four processes to calculating WQI:
The WQI criteria are chosen based on the World Health Organization's drinking water quality requirements (WHO)
Computation of the Sub-Index of Quality Rating (qi)
Quality rating or sub-index (qi) was determined using the following expression, according to Brown et al., 1972
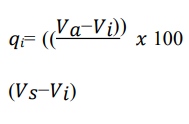
Where:
qi = Quality rating for the ith water quality parameters
Va = actual value present of the (ith) parameter at a given sampling station.
Vi = ideal value (0 for all parameters excepts pH 7.0 mg/lit respectively).
Vs = standard value
Unit Weight (Wi) Calculation
The suggested standards value of the linked parameters is inversely related to the unit weight (Wi) attributed to various water quality measurements
Where
Wi =unit weight for the ith parameters
si = standards value for the ith parameters
K = relative constant
K = 1/1/Sn1,2,3
Table 1: Explain the different classifications of water quality status based on water quality index [11].
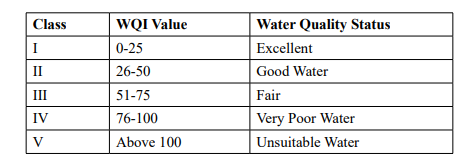
Table 1: Water Quality Classification Based on WQI Value
Results and Discussion
Temparature
The average water temperatures across the three segments of the Angola Catchment are as follows: 28.6°C for the upstream (US) region, 28.52°C for the midstream (MS) region, and 28.4°C for the downstream (DS) region. These measurements are detailed in The average water temperatures across the three segments of the Angola Catchment are as follows: 28.6°C for the upstream (US) Tables 1, 2, and 3. Temperature is a crucial parameter in aquatic chemistry, as it influences various chemical processes, including solubility, reaction rates, and biological activity [12,13].
pH
The pH of water is a critical parameter that indicates its acidity or basicity. The pH scale ranges from 0 to 14, with a recommended range of 6.5 to 8.5 for irrigation and drinking purposes [14]. Water with a pH below 6.5 is classified as acidic, and decreasing pH values indicate increasing acidity.
In the Angola Catchment, pH values range from 6.7 to 7.2, with an average of 6.94 in the upstream region. The midstream region shows pH values from 6.8 to 7.2, averaging 6.98, while the downstream region also ranges from 6.8 to 7.2, with an average of 6.96. These results are depicted in Figure 2 (Mean pH Level in Angola Catchment) and fall within the acceptable limits set by the WHO (6.50–8.50). Similar findings were reported by [15], where mean pH values of water samples in the estuary ranged between 6.8 and 7.7, also within the recommended values for domestic use.
Both temperature and pH significantly influence the toxicity and solubility of metals in aquatic environments. The relationship between these parameters and metal toxicity is crucial for understanding the health of aquatic ecosystems and assessing potential risks to human health.
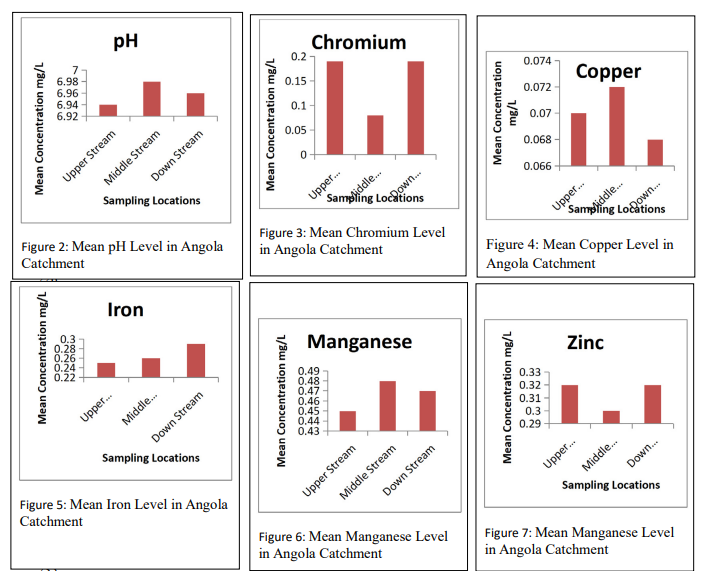
Figure 2: Shows the Average concentration of parameters
Chromium
Chromium concentrations in water samples from the Angola Catchment vary, with levels ranging from 0.06 mg/L to 0.28 mg/L and an average of 0.19 mg/L in the upstream region. The midstream region shows chromium levels between 0.05 mg/L and 0.17 mg/L, averaging 0.08 mg/L. In the downstream region, concentrations range from 0.07 mg/L to 0.26 mg/L, with an average of 0.17 mg/L. Notably, all mean chromium values for the upstream, midstream, and downstream areas exceed the World Health Organization's (WHO) recommended drinking water limit of 0.05 mg/L, as illustrated in Figure 3.
Chromium is a trace element that can exist in several oxidation Chromium concentrations in water samples from the Angola Catchment vary, with levels ranging from 0.06 mg/L to 0.28 mg/L and an average of 0.19 mg/L in the upstream region. The midstream region shows chromium levels between 0.05 mg/L and 0.17 mg/L, averaging 0.08 mg/L. In the downstream region, concentrations range from 0.07 mg/L to 0.26 mg/L, with an average of 0.17 mg/L. Notably, all mean chromium values for the upstream, midstream, and downstream areas exceed the World Health Organization's (WHO) recommended drinking water limit of 0.05 mg/L, as illustrated in Figure 3. states, with trivalent chromium (Cr(III)) being relatively non- toxic and hexavalent chromium (Cr(VI)) being highly toxic and carcinogenic and [16,2]. The elevated levels observed in this study raise concerns about potential health risks for communities relying on these water sources.
Copper
Analysis of water samples reveals that copper concentrations in the Angola Catchment vary across different locations. In the upstream region, copper levels range from 0.06 to 0.08 mg/L, while the midstream region shows concentrations between 0.061 and 0.088 mg/L. The downstream region has copper levels ranging from 0.058 to 0.069 mg/L, as detailed in Tables 2. The mean copper concentrations recorded are 0.07 mg/L for the upstream, 0.072 mg/L for the midstream, and 0.068 mg/L for the downstream.
Importantly, these mean concentrations within the World Health Organization's (WHO) drinking water guideline of 2 mg/L, as illustrated in Figure 4. Copper can pose health risks at elevated levels, including gastrointestinal disturbances and potential liver or kidney damage [17]. The findings highlight the need for continuous monitoring and management of copper levels in water sources to safeguard public health.
Iron
In the Angola Catchment, iron concentrations vary across the upstream, midstream, and downstream regions. Specifically, iron levels range from 0.2 to 0.3 mg/L in the upstream, from 0.21 to 0.34 mg/L in the midstream, and from 0.22 to 0.38 mg/L in the downstream region. The mean iron concentrations recorded for these locations are 0.25 mg/L for the upstream, 0.26 mg/L for the midstream, and 0.29 mg/L for the downstream. As illustrated in Figure 5, all measured iron mean concentrations fall well within the World Health Organization's (WHO) recommended limit of 0.3 mg/L. While iron is an essential nutrient for human health, excessive levels can lead to water quality issues, such as discoloration and an undesirable taste [18]. Therefore, ongoing monitoring of iron levels is crucial to ensure that they remain within safe limits for consumption and environmental health.
Manganese
In the Angola Catchment, manganese concentrations exhibit variability across different locations. In the upstream region, manganese levels range from 0.3 mg/L to 0.5 mg/L, with an average concentration of 0.45 mg/L. The midstream region shows values ranging from 0.33 mg/L to 0.53 mg/L, averaging 0.48 mg/L, while the downstream region has concentrations from 0.3 mg/L to 0.52 mg/L, with an average of 0.47 mg/L. The mean results from the three sampling points collected over ten months are illustrated in Figure 6.
Importantly, the mean manganese concentrations in all three regions exceed the World Health Organization's (WHO) guideline of 0.4 mg/L for drinking water. Comparatively, the mean manganese values found in the Angola Catchment are lower than those reported in similar studies conducted in Kenya, such as those in Winam Gulf, Lake Victoria, where concentrations ranged from 0.05 to 3.276 mg/L [19]. Elevated manganese levels can pose health risks, including neurological effects, particularly in vulnerable populations [20].
Arsenic
This recommendation is supported by toxicological and epidemi- ological data showing that prolonged exposure to drinking water containing arsenic can cause cancer, diabetes, cardiovascular dis- ease, and skin lesions [2]. During the monitoring periods, the up- per stream, middle stream, and downstream each recorded zero for all the months of collection as shown in Table 2.
Zinc
In the Angola Catchment, zinc concentrations vary across different regions. In the upstream area, zinc levels range from 0.31 mg/L to 0.41 mg/L, while the midstream region shows values between 0.33 mg/L and 0.41 mg/L. The downstream region exhibits zinc concentrations ranging from 0.31 mg/L to 0.42 mg/L. The average zinc concentrations for the monitored points are 0.35 mg/L for the upstream, 0.36 mg/L for the midstream, and 0.35 mg/L for the downstream, as illustrated in Figure 6.
All measured zinc values are well within the World Health Organization's (WHO) recommended guideline of 3 mg/L for potable water. Zinc is an essential trace element that plays a vital role in various biological processes; however, excessive levels can lead to adverse health effects, including gastrointestinal disturbances and interference with the absorption of other essential minerals [21]. Continuous monitoring of zinc levels is crucial to ensure water quality and public health safety.
Lead
Lead is a heavy metal that can naturally occur in environmental deposits, potentially contaminating groundwater sources [22]. According to the WHO's 2017 guidelines, the acceptable limit for lead in drinking water is no more than 10 micrograms per liter (10 µg/L), equivalent to 0.01 milligrams per liter (0.01 mg/L).
In the Angola Catchment, lead concentrations were consistently measured at zero across all sampling points during the monitoring periods, as presented in Tables 2. This absence of detectable lead is promising, indicating that the water quality in this region meets the WHO standards and suggests minimal risk of lead exposure from drinking water sources. However, continuous monitoring is essential, as lead can enter water supplies through aging infrastructure and industrial activities [23].
|
|
Upper Stream |
Middle Stream |
Down Stream |
||||||
|
Parameters |
Min |
Max |
Mean |
Min |
Max |
Mean |
Min |
Max |
Mean |
|
Temperature |
28.1 |
28.9 |
28.6 |
28 |
28.7 |
28.52 |
27.8 |
28.6 |
28.4 |
|
pH |
6.7 |
7.2 |
6.94 |
6.8 |
7.2 |
6.98 |
6.8 |
7.2 |
6.96 |
|
Chromium |
0.06 |
0.28 |
0.19 |
0.05 |
0.17 |
0.08 |
0.07 |
0.26 |
0.19 |
|
Copper |
0.06 |
0.08 |
0.07 |
0.061 |
0.088 |
0.072 |
0.058 |
0.069 |
0.068 |
|
Iron |
0.2 |
0.3 |
0.25 |
0.21 |
0.34 |
0.26 |
0.22 |
0.38 |
0.29 |
|
Manganese |
0.3 |
0.5 |
0.45 |
0.33 |
0.53 |
0.48 |
0.3 |
0.52 |
0.47 |
|
Arsenic |
0.00 |
0.00 |
0.00 |
0.00 |
0.00 |
0.00 |
0.00 |
0.00 |
0.00 |
|
Zinc |
0.3 |
0.41 |
0.35 |
0.33 |
0.41 |
0.36 |
0.31 |
0.42 |
0.35 |
|
Lead |
0.00 |
0.00 |
0.00 |
0.00 |
0.00 |
0.00 |
0.00 |
0.00 |
0.00 |
Table 2: Summary Results for Upper Stream, Middle Stream, and Down Stream at Angola Catchme
|
Upper Stream |
Middle Stream |
|||||||||||||
|
SI. No |
Pa- rame- ters |
Stan- dard Values (Si) |
1/Si |
Unit Weight (Wi) |
Ob- served Values |
Qual- ity Rating (qi) |
Weighted (Wiqi) |
Pa- rame- ters |
Stan- dard Values (Si) |
1/Si |
Unit Weight (Wi) |
Ob- served Values |
Quality (Rat- ing) (qi) |
Weight- ed (Wiqi) |
|
1 |
pH |
8.5 |
0.1176 |
0.00047 |
6.94 |
-4 |
-0.00188 |
pH |
8.5 |
0.1176 |
0.00047 |
6.98 |
-1.333 |
-0.00063 |
|
2 |
Chro- mium |
0.05 |
20.0 |
0.08 |
0.19 |
380 |
30.4 |
Chro- mium |
0.05 |
20.0 |
0.08 |
0.08 |
160 |
12.8 |
|
3 |
Copper |
2.0 |
0.5 |
0.002 |
0.07 |
3.5 |
0.007 |
Copper |
2.0 |
0.5 |
0.002 |
0.072 |
3.6 |
0.0072 |
|
4 |
Iron |
0.3 |
3.333 |
0.0133 |
0.25 |
83.33 |
1.108289 |
Iron |
0.3 |
3.333 |
0.0133 |
0.26 |
86.67 |
1.1527 |
|
5 |
Manga- nese |
0.4 |
2.5 |
0.01 |
0.45 |
112.5 |
1.125 |
Manga- nese |
0.4 |
2.5 |
0.01 |
0.48 |
120 |
1.2 |
|
6 |
Arsenic |
0.01 |
100 |
0.4 |
0.00 |
0.00 |
0.00 |
Arsenic |
0.01 |
100 |
0.4 |
0.00 |
0.00 |
0.00 |
|
7 |
Zinc |
3.0 |
0.333 |
0.00133 |
0.35 |
11.67 |
0.01552 |
Zinc |
3.0 |
0.333 |
0.00133 |
0.36 |
12 |
0.01596 |
|
8 |
Lead |
0.01 |
100 |
0.4 |
0.00 |
0.00 |
0.00 |
Lead |
0.01 |
100 |
0.4 |
0.00 |
0.00 |
0.00 |
|
|
|
|
226.7836 |
∑Wi= 0.9071 |
|
|
∑Wiqi= 32.65393 |
|
226.7836 |
|
∑Wi= 0.9071 |
|
|
∑Wiqi= 15.17523 |
|
|
WQI= 35.998 |
WQI= 16.73 |
||||||||||||
Table 3a: Water Quality Index Calculation for Angola Upper Stream and Middle Stream
|
Down Stream |
|||||||
|
SI. No |
Parameters |
Standard Values (Si) |
1/Si |
Unit Weight (Wi) |
Observed Values |
Quality Rating (qi) |
Weighted (Wiqi) |
|
1 |
pH |
8.5 |
0.1176 |
0.00047 |
6.96 |
-2.67 |
-0.00125 |
|
2 |
Chromium |
0.05 |
20.0 |
0.08 |
0.19 |
380 |
30.4 |
|
3 |
Copper |
2.0 |
0.5 |
0.002 |
0.068 |
3.4 |
0.0068 |
|
4 |
Iron |
0.3 |
3.333 |
0.0133 |
0.29 |
96.67 |
0.19334 |
|
5 |
Manganese |
0.4 |
2.5 |
0.01 |
0.47 |
117.5 |
1.175 |
|
6 |
Arsenic |
0.01z |
100 |
0.4 |
0.00 |
0.00 |
0.00 |
|
7 |
Zinc |
3.0 |
0.333 |
0.00133 |
0.35 |
11.67 |
0.0155 |
|
8 |
Lead |
0.01 |
100 |
0.4 |
0.00 |
0.00 |
0.00 |
|
|
|
|
226.7836 |
∑Wi= 0.9071 |
|
|
∑Wiqi= 31.78939 |
|
|
WQI= 35.05 |
||||||
Table 3b: Water Quality Index Calculation for Angola Down Stream
In the upper stream as shown in Table 3a, the WQI IS 35.998 which shows that the water quality is good. Compared to the upper stream, the middle stream's WQI of 16.73 from Table 3a indicates exceptional water quality. This section's overall WQI is much lower than the upper stream, indicating that the water quality is getting better. The downstream WQI of 35.05 as shown in Table 3b is very similar to the upper stream, indicating that water quality does not improve substantially by the time it reaches the downstream. Certain parameters are above the WHO limits across all three sections of the river (upper, middle, and down streams), with pollutants like chromium, and manganese levels being the key contributors. However, the Middle Stream shows a slight improvement compared to the upper and down Streams.
Conclusions
The assessment of heavy metals in the Angola Catchment Area revealed the presence of several hazardous metals, notably chromium, and manganese, at concentrations exceeding the World Health Organization's (WHO) drinking water standards. These elevated levels pose a significant health risk to the local community, which may be exposed to contaminated water through drinking, agriculture, and fishing activities. While arsenic and lead were not detected in any samples, the high concentrations of other metals suggest considerable contamination, likely stemming from waste discharges, agricultural runoff, and inadequate waste management practices.
The findings of this study underscore the critical need for ongoing water quality monitoring to detect heavy metal pollution in aquatic systems. Given the potential for metals to accumulate and biomagnify in these environments, there is an urgent necessity for effective management strategies and regulatory measures aimed at reducing heavy metal discharges into water bodies. Furthermore, raising public awareness about the health risks associated with contaminated water sources and enhancing wastewater treatment facilities are essential steps for protecting both human and environmental health in the region.
Future research should focus on understanding the long-term impacts of these pollutants on the ecosystem and developing sustainable approaches for pollution management.
Declarations
“All authors have read, understood, and have complied as applicable with the statement on “Ethical responsibilities of Authors” as found in the Instructions for Authors” for Journal Environmental Monitoring and Assessment.
References
- Alloway, B. J. (Ed.). (2012). Heavy metals in soils: trace metals and metalloids in soils and their bioavailability (Vol. 22). Springer Science & Business Media.
- World Health Organization. (2017). Heavy metals in drinking water: Background document for development of WHO Guidelines for Drinking-water Quality. Geneva: WHO.
- Abdallah, M. F., et al. (2018). Assessment of heavy metal pollution in urban water bodies: A review. Environmental Monitoring and Assessment, 190(9), 515.
- Kanu, S. S., et al. (2020). The impact of urbanization on water quality in Sierra Leone. International Journal of Environmental Research and Public Health, 17(4), 1345.
- Mansaray, S. A., et al. (2019). Assessing water quality in Freetown: Impacts of urbanization on heavy metal concentrations. Water Research, 154, 304-312.
- Berglund, M., et al. (2020). Health effects of lead and cadmium exposure: A systematic review. Environmental Research, 183, 109238.
- Cohen, S. M., et al. (2017). The role of lead and cadmium in kidney and bladder cancer: Epidemiological and toxicological evidence. International Journal of Environmental Research and Public Health, 14(12), 1447.
- Shaker, H. A., et al. (2021). Ecotoxicological effectsof cadmium and lead on aquatic organisms: A review.Ecotoxicology and Environmental Safety, 213, 112054.
- Chowdhury, R., Warnakula, S., Kunutsor, S., Crowe, F., Ward, H. A., Johnson, L., ... & Di Angelantonio, E. (2014). Association of dietary, circulating, and supplement fatty acids with coronary risk: a systematic review and meta- analysis. Annals of internal medicine, 160(6), 398-Ð?.
- Mahlert, B. (2022). From per capita income to the Human Development Index: a pathway for imagining development through numbers. In Imagining Pathways for Global Cooperation (pp. 188-208). Edward Elgar Publishing.
- Brown, R. M., McClelland, N. I., Deininger, R. A., & O’Connor, M. F. (1972, June). A water quality index—crashing the psychological barrier. In Indicators of Environmental Quality: Proceedings of a symposium held during the AAAS meeting in Philadelphia, Pennsylvania, December 26–31, 1971 (pp. 173-182). Boston, MA: Springer US.
- Wetzel, R. G. (2001). Limnology: lake and river ecosystems. gulf professional publishing.
- Chapman, D. V. (2021). Water quality assessments: a guide to the use of biota, sediments and water in environmental monitoring. CRC Press.
- World Health Organization. (2004). Guidelines for drinking-water quality (Vol. 1). World health organization.
- Fianko, J. R., et al. (2006). Water quality assessment of the estuary: Implications for domestic use. Environmental Monitoring and Assessment, 120(1-3), 345-355.
- Wilbur, S. B. (2000). Toxicological profile for chromium.
- López, A., et al. (2020). Health effects of copper exposure: A review. Environmental Science and Pollution Research, 27(10), 11589-11600.
- Benoit, J. M., et al. (2020). Iron in drinking water: Effects onhealth and water quality. Water Research, 183, 116073.
- Lalah, J. O., et al. (2008). Distribution and sources of trace metals in Winam Gulf, Lake Victoria, Kenya. Environmental Monitoring and Assessment, 148(1-4), 341-.
- Kumar, A., et al. (2021). Health implications of manganese exposure: A review. Environmental Science and Pollution Research, 28(30), 39710-39727.
- Davis, C. D., et al. (2020). Zinc: An essential micronutrient in human health. Journal of Nutrition, 150(3), 552-556.
- World Health Organization. (2004). Guidelines for drinking-water quality (Vol. 1). World health organization.
- Graham, J. D., et al. (2020). Lead contamination in drinking water: A review of health risks and mitigation strategies. Environmental Science and Pollution Research, 27(9), 10470- 10486.