
World Journal of Forest Research(WJFR)
ISSN: 2994-5569 | DOI: 10.33140/WJFR


Research Article - (2025) Volume 4, Issue 1
Assessment of Carbon Sequestration by Herbs and Soil in Wetlands of the Bhopal District of Central India
2Department of Zoology and Applied Aquaculture, Barkatullah University, M.P, India
3Department of Biosciences, Barkatullah University, M.P, India
Received Date: Apr 14, 2025 / Accepted Date: May 16, 2025 / Published Date: May 29, 2025
Copyright: ©Â©2025 Ankita Singh, et al. This is an open-access article distributed under the terms of the Creative Commons Attribution License, which permits unrestricted use, distribution, and reproduction in any medium, provided the original author and source are credited.
Citation: Singh, A., Sejpada, S., Shekhawat, M., Singh, P., Vyas, V. (2025). Assessment of Carbon Sequestration by Herbs and Soil in Wetlands of the Bhopal District of Central India. World J Forest Res, 4(1), 1-11.
Abstract
Wetlands in urban areas act as natural buffers that control floods, mitigate fire risk, and regulate local climates, helping reduce the impact of extreme weather events on communities. Quantifying carbon stocks is critical for evaluating the potential of an ecosystem to mitigate the effects of global climate change and the concentration of carbon dioxide (CO2 ) emitted from industries, the burning of fossil fuels, and deforestation, which results in greenhouse gases (GHGs). Hence, vegetation near wetlands in terms of agroforestry, plantations, and reforestation has been suggested as one of the most appropriate land management systems for mitigating atmospheric CO2 through the photosynthesis process. Natural herbs, grasses, and soil were studied near the wetland ecosystem in Madhya Pradesh, India to understand how much vegetation and soil are applicable for capturing carbon in urban areas as a carbon pool or carbon reservoir among the sites. The results indicated that the biomass of the wetland (near the natural ecosystem) was 1.68 t ha-1, whereas that of the wetland (near the manmade ecosystem) was 0.83 t ha-1. The total carbon stock in wetlands ranges between 16.34 t C ha-1 and 23.28 t C ha-1. Greater biomass accumulation and carbon stocks have been recorded in wetlands that are near natural ecosystems or away from human interference. Proper efforts are required to manage these diverse ecosystems to obtain higher biomass and sustainable ecological services.
Keywords
Carbon Sequestration, Herb Carbon Stock, Soil Carbon Stock, Biomass, Wetlands
Introduction
Carbon sequestration is the process by which carbon dioxide (COâ??) is captured and stored, thereby reducing the amount of COâ?? in the atmosphere. This is crucial in mitigating the impacts of climate change. Wetlands, which include marshes, swamps, bogs, and fens, play a significant role in this natural process [1-3].
Wetlands are unique ecosystems characterized by water saturation influencing soil and vegetation. They are incredibly efficient at sequestering carbon due to their dense plant life and anaerobic (oxygen-poor) soil conditions [4]. Plants in wetlands absorb COâ?? from the atmosphere through photosynthesis. When these plants die, they decay slowly in the waterlogged, anaerobic soil, preventing carbon from being released into the atmosphere [5]. Instead, carbon is stored in organic matter, often for thousands of years.
This natural mechanism makes wetlands one of the most effective carbon sinks on the planet, sequestering more carbon per unit area than forests do [6]. However, wetlands are threatened by human activities such as agriculture, urban development, and drainage for land use, which can lead to the release of stored carbon back into the atmosphere, exacerbating climate change.
Soil in wetlands plays a pivotal role in carbon sequestration, contributing significantly to global carbon storage and climate regulation. Soils are among the major carbon sinks on earth, because of their relatively high organic matter content [7]. Soils can act as sinks or sources of carbon in the atmosphere depending on changes in soil organic matter. The equilibrium between the rate of decomposition and the rate of supply of organic matter is disturbed when forests are cleared and land use is changed. Soil organic matter can also increase or decrease depending on numerous factors, including climate, vegetation type, nutrient availability, disturbance, and land use and management practices [8]. Wetland soils accumulate organic matter over time, which is derived from plant debris, roots, and microbial activity. This organic matter contains carbon that is stored in the soil in the form of humus and other organic compounds. Wetlands are known to store a large amount of carbon per unit area, often more than terrestrial ecosystems such as forests, because their waterlogged conditions slow decomposition rates [9]. The anaerobic (low oxygen) conditions in wetland soils slow down the decomposition of organic matter. As a result, the carbon that enters wetland soils through plant biomass and organic inputs tends to accumulate rather than being rapidly released back into the atmosphere as COâ??. This process effectively sequesters carbon over long periods, contributing to climate change mitigation. In certain wetlands, particularly bogs and fens, conditions favour the formation of peat—a type of soil composed primarily of partially decayed plant material [10,11]. Peat soils can store immense amounts of carbon over millennia because the decomposition of organic matter is extremely slow under waterlogged, acidic conditions. Wetland soils are integral to the global carbon cycle. They act as significant carbon sinks, offsetting carbon dioxide emissions from human activities such as fossil fuel combustion and land-use changes. By sequestering carbon, wetlands help regulate atmospheric COâ?? concentrations, thereby mitigating the impacts of climate change. Healthy soils in wetlands support the growth of vegetation, including sedges, rushes, and other wetland-adapted plants. These plants contribute to carbon sequestration through photosynthesis, where atmospheric COâ?? is absorbed and converted into plant biomass.
Herbs and grasses in wetlands contribute significantly to carbon sequestration, enhancing the ecosystem's ability to mitigate climate change. Herbs and grasses in wetlands engage in photosynthesis, absorbing carbon dioxide (COâ??) from the atmosphere. This process converts COâ?? into organic carbon compounds, which are stored in plant tissues and roots [12,13]. These plants accumulate biomass over time as they grow and reproduce. The carbon stored in their biomass remains sequestered as long as the plants are alive and continues to increase with their growth. The root systems of herbs and grasses play crucial roles in carbon sequestration. They penetrate the soil, where they contribute organic matter to the soil carbon pool [14,15]. This organic matter is often protected from decomposition due to the waterlogged conditions typical of wetlands, thus enhancing long-term carbon storage. The presence of herbs and grasses in wetlands increases the overall SOC stock. Through root exudates and decomposition of their organic matter, they enrich the soil with carbon, contributing to the formation of humus and stable soil organic matter.
In summary, soil in wetlands serves as a vital reservoir for carbon sequestration, playing a critical role in global carbon cycling and climate regulation. Protecting and conserving wetland soils is essential for maintaining their capacity to store carbon and mitigate the impacts of climate change on a global scale. Herbs and grasses in wetlands are crucial components of carbon sequestration processes. Their ability to absorb COâ??, accumulate biomass, enrich soil carbon stocks, stabilize soil structure, and support biodiversity underscores their importance in mitigating climate change impacts and maintaining the health of wetland ecosystems [16]. Protecting and restoring these plant communities is essential for maximizing their carbon sequestration potential and ensuring the long-term sustainability of wetland habitats.
Understanding the role of wetlands in carbon sequestration is vital for developing strategies to protect and restore these ecosystems. By conserving and rehabilitating wetlands, we can increase their capacity to sequester carbon, contributing to climate change mitigation and the preservation of biodiversity.
Data and Methods
Study Area
The study area is located in Bhopal, Madhya Pradesh (Figure 1). Bhopal is in the central part of India and is surrounded by lakes and hills, and the district is famous for its natural beauty. The city has uneven elevation and small hills within its boundaries. The city’s geography has two lakes, namely, the upper lake and the lower lake. Bhopal has an average elevation of 500 meters (1401 ft), and the city hosts a humid subtropical climate in general. The flora of the Bhopal area is changing frequently due to human activities and land use. The physiographic divisions of the regions are highlands, uplands, and central plains. The climate of the district is characterized by hot summers and well-distributed rainfall during the monsoon season. The soils of the Bhopal district can be broadly classified into four major classes: red and yellow soils, alluvial soils, laterite soils, and mixed soils. The study was conducted in eight selected wetlands (parts of Upper Lake and Lower Lake i.e. Bhoj Wetland; and other lakes) of Bhopal (Figure 2) for a period of 4 months from February to May 2023, as detailed in Table 1.
|
Serial No. |
Site Name |
Latitude |
Longitude |
|
01. |
Shahpura Lake |
23°12'23.4"N |
77°25'26.7"E |
|
02. |
Bhadbhada Dam |
23°12'25.0"N |
77°13'47.4"E |
|
03. |
Kerwa Dam |
23°09'59.3"N |
77°22'17.1"E |
|
04. |
Kaliasot Dam |
23°11'39.7"N |
77°24'13.0"E |
|
05. |
Laharpur Dam |
23°11'48.3"N |
77°28'47.4"E |
|
06. |
Hataikheda Dam |
23°16'34.8"N |
77°29'55.7"E |
|
07. |
University Pond |
23°11'44.9"N |
77°27'12.6"E |
|
08. |
Jawahar Bal Udyan Lake |
23°13'29.3"N |
77°25'17.1"E |
Table 1: Geographic Information of the Study Sites
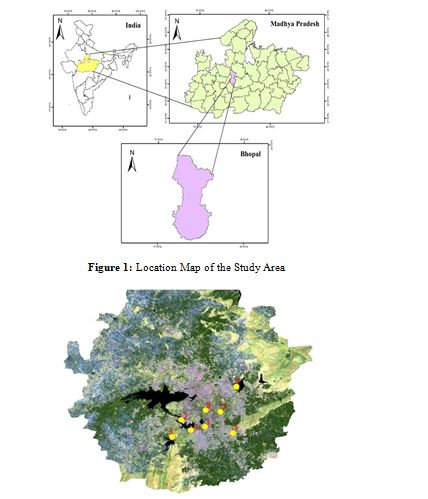
Figure 2: Study Sites Across Bhopal (1-Shahpura Lake, 2-Bhadbhada Dam, 3-Kerwa Dam, 4-Kaliasot Dam, 5-Laharpur Dam, 6-Hataikheda Dam, 7-University Pond, 8-Jawahar Bal Udyan Lake)
Sampling Design
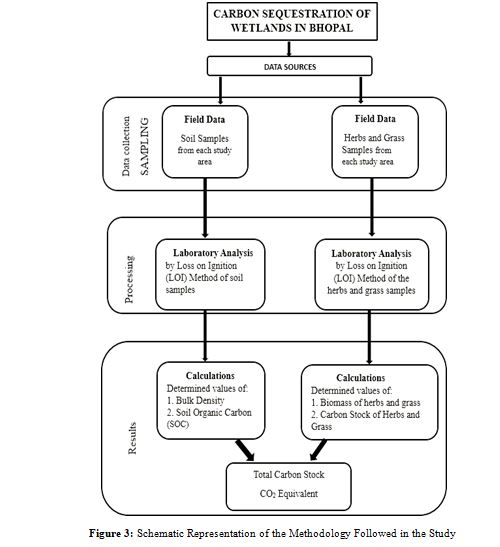
The wetlands present in Bhopal city were first identified, and each study site’s GPS coordinates were recorded via Google Maps. The herbs and grasses collected as samples were identified with the help of two books, i.e., the Handbook on Weed Identification by Dr. V. S. G. R. Naidu and Common Plants of the Riparian Zone of the River Narmada by U. Umrao and others. The live components, i.e., herbs and grass near the wetland (outside the flood plain), were collected destructively by clipping all the vegetation down to ground level from a nested subplot of size 1x1 m. Sample plots were randomly overlaid to carry out the sampling in the field. The fresh weight of each sample was recorded within 0.1 g precision. A sub-sample of approximately 100 g was subsequently marked bag and taken to the laboratory to calculate its oven-dry weight. [17,18].
Afterward, the percentage of carbon content was determined via the loss of ignition (LOI) method of Allen et al., 1986. For this method, fresh-weight samples were taken and brought to the laboratory to oven-dry them. The oven was set at 80ºC for 48 hours, after which the dry weight of each sample was recorded. The oven-dried samples were ground and 5 grams were taken from preweighed crucibles. The crucible containing the sample was put into the furnace for ignition at 550 ºC for two hours [19,20].
For soil carbon analysis, a core sampler with a height of 15 cm and a diameter of 4.04 cm was used to obtain soil core samples for bulk density estimation. The soil samples were collected from a depth of 12 cm at all the study sites. The collected soil samples were transferred from the core sampler to zip lock bags, and the wet weight (W1) of each soil sample was noted to determine the soil organic carbon (SOC), and the loss on ignition (LOI) method was applied [21]. In this method, fresh weighed samples are initially taken and brought to the laboratory to oven dry them. The oven was set at 80â?? for 48 hrs, after which each sample's dry weight (W2) was noted. Oven-dried ground samples were taken (5.00 g) from preweighed crucibles and subsequently placed in a furnace at 550°C for 1 h to ignite. The crucibles were cooled slowly inside the furnace. The weight of ash (W3) after cooling was noted, the crucibles with ash were weighed, and the percentage of organic carbon was calculated [22].
Methodology
Calculation of the Biomass of Herb and Grass
Biomass is the mass of living biological organisms in a given area or ecosystem at a given time. Here we calculate the biomass of herbs and grasses to further understand the carbon stock they store via Eq. (1)-
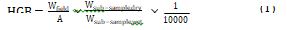
where ‘HGB’ is herb and grass biomass (t ha-1). ‘W field’ is the weight of a wet field sample of herb and grass sampled within an area of size A (g). ‘A’ is the size of the area in which the herb and grass were collected (ha). ‘W-subsample dry’ is the weight of the oven-dried subsample of herb and grass (g), and ‘W subsample wet’ is the weight of the fresh subsample of herb and grass.
Calculation of % of Ash
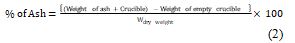
where ‘% of ash’ is the percentage of ash left from the dry weight of the sample after ignition in Eq. (2).
Calculation of % of Carbon
% C = 0.5 * (100 - % of Ash) (3)
where ‘% C’ is the carbon fraction and ‘% Ash’ is the percentage of ash left from the dry weight in Eq. (3).
Calculating the Hg Carbon Stock
The carbon stock refers to the amount of carbon stored in the environment (here, wetlands), typically in plants, soils, and aquatic systems. The greater the carbon stock is, the greater the wetland’s capacity to absorb and sequester carbon dioxide (CO2), the main greenhouse gas in the atmosphere, through photosynthesis [23
HG Carbon stock = HGB * %C (4)
where, ‘HG Carbon stock’ is the herb and grass carbon stock (t C/ ha), and ‘HGB’ refers to herb and grass biomass (t/ha), Eq. (4).
To Calculate the Bulk Density of the Soil
Bulk density is an estimate of soil compaction, important for understanding the suitability of soil for root penetration, soil permeability, physical behavior of soil, and soil porosity [17].
BD = W2/V (5)
(V= πr2 × h) (6)
where, BD = bulk density (G/cm3); W2 = weight of the oven-dried sample(g); V = volume of core sampler (cm3); r = radius of the core sampler (cm); and h = height of the core sampler (cm) in Eq. (5,6).
For Calculating the %C of the Soil
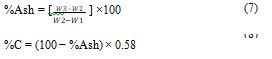
By considering 58% carbon in ash-free soil material for Eq. (7,8), W1= weight of crucible(g), W2= weight of the oven-dried grind sample and crucible (g), and W3= Weight of ash and crucible(g).
To Calculate Soil Organic Carbon (SOC) Stock
Soil organic carbon refers only to the carbon component of organic compounds; it remains in the soil after the decomposition of any material produced by living organisms, which is calculated via Eq. (9).
SOC stock = BD * d * %C (9)
where, SOC = soil organic carbon stock per unit area (t C/ ha), BD = bulk density (g cm3),
d = the total depth at which the sample was taken (cm), and %C = Carbon concentration (%).
Calculating the Total Carbon Stock
The carbon values for each carbon pool were summed to estimate the total carbon stock of the wetland. Eq. (10) was used to calculate the total wetland carbon stock:
TCS = SOC + C (HG) (10)
where ‘TCS’ is the total carbon stock of the wetland (t C/ha), ‘SOC’ is the soil organic carbon (t C/ha), and ‘C(HG)’ is the carbon stock in herbs and grasses of the wetland (t C/ha).
The CO2 Equation (Carbon Dioxide Equivalent) Can Be Calculated as Follows
The CO2 equivalent (CO2 eq) is a measure used to compare the warming potential of different greenhouse gases by converting them into the amount of carbon dioxide that would have the same impact. The CO2 eq of the total carbon stock was obtained by multiplying the carbon stock by (molar conversion factor of) 3.67 or 44/12 [17].
CO2 eq = TC × 3.67 (11)
where CO2 eq is the carbon dioxide equivalent (t CO2/ha) and TC is the total carbon stock (t C/ha).
Statistical Analysis
Multivariate ordination analysis was used to statistically examine the data. The Box Plot Model and Principal Component Analysis (PCA) were used to express the significant differences and similarities between the various carbon pools in the wetland sites. A correlation matrix was used to assess the relationships between the carbon stocks in the soil and plants by expressing overall trends in the total carbon stock among the forests under study. ÃÂ?¿ = 0.05 was the significance level that was applied [24].
Results and Discussion
Biomass and Carbon Stock of the Herbs or Grass
The vegetation assessment revealed that some of the species recurred at almost every study site such as Cynodon dactylon, Parthenium hysterophorus, Cassia tora and Rumex dendatus. Meanwhile, as the summer months increased, the vegetation around the study site started drying, and most of the study sites were susceptible to pollution due to anthropogenic activities and as tourist spots. Cattle grazing was also common. The average total biomass of all the study sites was calculated and ranged from 0.83 t ha-1 to 1.75 t ha-1 and the average carbon stock of the study sites ranged from 0.41 t C ha-1 to 0.87 t C ha-1 as described in Table 2.
|
S. No. |
Study Site Name |
Total Biomass (Average) (t Ha-1) |
Carbon Stock (Average) (t C Ha-1) |
|
01. |
Shahpura Lake |
1.2 |
0.59 |
|
02. |
University Lake |
0.83 |
0.41 |
|
03. |
Laharpur Dam |
1.16 |
0.58 |
|
04. |
Hataikheda Dam |
1.68 |
0.84 |
|
05. |
Char Imli Park |
0.94 |
0.46 |
|
06. |
Bhadbhada Dam |
1.41 |
0.70 |
|
07. |
Kerwa Dam |
1.75 |
0.87 |
|
08. |
Kaliasot Dam |
1.31 |
0.65 |
Table 2: Average Biomass and Average Carbon Stock of Herbs, and Grasses in the Wetlands of Bhopal
Bulk Density and Carbon Stock of the Soil
The average bulk density of each wetland was calculated (Table 3) and ranged from 0.9 g/cm3 to 1.33 g/cm3. The highest bulk density was found at Jawahar Bal Udhyan (Charimlli Park), and the lowest bulk density was found at Laharpur Dam. This generally indicates that the organic matter content of the Laharpur Dam is high and low in Charimlli Park (as low bulk density indicates high porosity and in general, high organic matter content).
|
S. No. |
Sites Name |
BD (Average) (g/cm3) |
SOC (Average) (t C/ha) |
|
01. |
Shahpura Lake |
1.1 |
19.69 |
|
02. |
University Lake |
1.09 |
20.56 |
|
03. |
Laharpur Dam |
0.91 |
15.75 |
|
04. |
Hataikheda Dam |
1.18 |
21.28 |
|
05. |
Char Imli Park |
1.33 |
17.54 |
|
06. |
Bhadbhada Dam |
1.01 |
18.31 |
|
07. |
Kerwa Dam |
1.24 |
22.41 |
|
08. |
Kaliasot Dam |
1.18 |
21.39 |
Table 3: Average Bulk Density and Average Carbon Stock of Soil in Wetlands of Bhopal
The average soil organic carbon (SOC) of each wetland was calculated (Table 3) and ranged from 15.75 t C/ha to 22.41 t C/ha. The factors that increase the soil carbon content are no-tillage, less anthropogenic activities, reduced grazing, and forest restoration. Most of these factors are in place around and at Kerwa Dam, and, as per the data collected, the highest carbon content is found at Kerwa Dam. The organic carbon content of the soil depends on substrate availability, temperature, and climate, due to which there is variation in the carbon content of the soil in the soils of the study areas. Laharpur Dam has the lowest soil carbon content; the factors that decrease the soil carbon content are cultivation, grazing, pollution, and degradation, and most of these factors are present in Laharpur Dam.
Total Carbon Stock
The total carbon stock was calculated by combining the vegetation data (HG carbon stock) with the soil data obtained (SOC). It ranged from 16.34 t C ha-1 to 23.28 t C ha-1. In Figure 4, the graph shows the total carbon stock of both the soil and the herbs and shrubs; accordingly, the wetland soil carbon stock is greater than the carbon stock of the wetland vegetation.
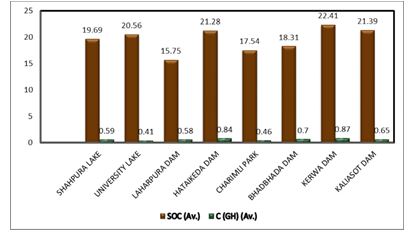
Figure 4: Total Soil Carbon Stock and Carbon Stock of Herbs and Grass of Wetlands in the Bhopal District
Assessing COâ?? equivalents during carbon sequestration analysis involves quantifying the amount of carbon dioxide (COâ??) that is captured and stored in various forms such as soil organic carbon, biomass, and other carbon sinks. This process helps in understanding the impact of different agricultural practices on climate change mitigation. The CO2 equivalent values ranged from 59.96 tons to 85.43 tons. Hataikhedha Dam, Kerwa Dam, and Kaliasot Dam have the highest percentages of CO2 eq, i.e., 14%, followed by University Lake with 13% CO2 eq (Figure 5).
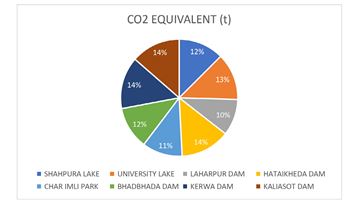
Figure 5: Pie-Chart Showing Co2 Equivalent Values at the Study Sites in Bhopal
Statistical Calculation
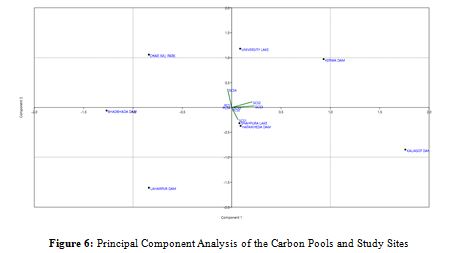
Principal component analysis (PCA) was used for site-specific data, yielding 52.103% and 25.45% variances, respectively, with the first two components' respective Eigenvalues of 18.397 and 37.664 reflecting the test's statistical power. Concerning the total biomass and carbon stocks along the X-axis, PCA identified and distinguished the locations of Kaliasot Dam, Hathaikhedha Dam, and Kerwa Dam based on the maximum carbon stock values. The segregation of the Kerwa Dam site, which is located on the upper right and has a maximum biomass value of 1.75 t/ha, with a maximum SOC value of 22.14 t/ha, is another noteworthy finding of the PCA biplot. The Laharpur Dam site, which had the lowest values of plant carbon stock (PCS) and soil carbon stock (SCS), 0.58 and 15.75 t/ha, respectively, was placed separately on the bottom, indicating nonsignificant associations with any variable. In contrast, the sites with very similar and moderate carbon stock values were clustered near the center top. Herbs, grasses, and soil constituents were found to be non-significant contributors to the local carbon stocks because they presented limited vector lengths in the PCA biplot (Figure 6).
The provided image (Figure 7) is a correlation matrix heatmap that visualizes the relationships between various carbon-related parameters across different locations. The heatmap includes parameters such as the soil carbon stock, soil carbon stock bulk density, plant carbon stock, and plant carbon stock biomass. Each of these parameters is measured at multiple sites, including University Lake, Shahapura Lake, Laharpur Dam, Kerwa Dam, Kaliasot Dam, Hataikhedha Dam, Char Imli Park, and Bhadbhada Dam.
Y-axis (Variable 1), lists various parameters related to soil carbon stock, soil carbon stock bulk density, plant carbon stock, and plant carbon stock biomass, each measured at different locations. X-axis (Variable 2), mirrors the Y-axis, listing the same parameters and locations. Blue shading indicates positive correlations (ranging from 0 to 1.0). Red shading indicates negative correlations (ranging from 0 to -1.0). White represents no correlation (correlation coefficient of approximately 0). Strong positive correlations are represented by dark blue shading, suggesting that as one variable increases, the other variable also increases. For example, parameters such as the plant carbon stock at various sites are highly positively correlated with the plant carbon stock biomass at corresponding sites, indicating that a relatively high plant carbon stock tends to be associated with relatively high plant biomass. Strong negative correlations are depicted by dark red shading, suggesting that as one variable increases, the other decreases. Some soil carbon stock bulk density measurements might be negatively correlated with certain plant carbon stock measurements, indicating that higher soil bulk density could be associated with lower plant carbon stock. White areas indicate no significant linear relationship between the variables.
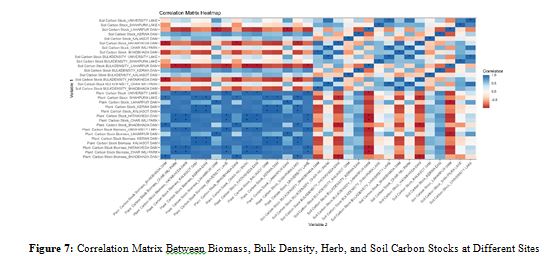
Some parameters, particularly those from different sites, might show little to no correlation, suggesting independent variation. Asterisks (*) mark statistically significant correlations, indicating that the observed correlation is unlikely to be due to random chance. This is particularly useful for identifying which relationships are robust and worthy of further investigation.
The heatmap provides a comprehensive overview of how different carbon-related parameters interact across various locations. Visualization helps identify patterns and relationships, such as consistent positive correlations between plant carbon stocks and plant biomass at the same sites. Varied correlations between the soil carbon stock and plant-related parameters, depending on the location and specific measurement. The presence of statistically significant correlations highlights important relationships that could inform further ecological or environmental studies. This correlation matrix heatmap is a valuable tool for identifying and interpreting the complex interdependencies between different ecological variables across multiple study sites
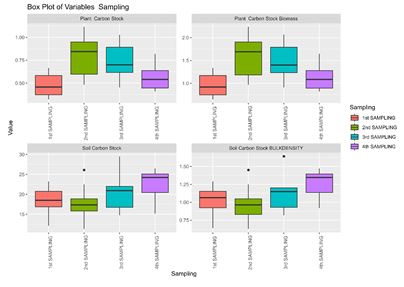
Figure 8: Box Plots of Plant Biomass, Soil Bulk Density, and Plant and Soil-Based Carbon Stocks for Each Sample
In the box-plot tests the discrimination power of the parameters was examined by their degrees of interquartile (IQ) overlap in the box-plot tests. The box plots are based on the values between the reference sites and impaired sites for each index, and the 25% quartile (Q1), median value (Q2), and 75% quartile (Q3) of each “box” are compared. The parameters were considered to have significant discrimination if the Q2 of each “box” was not between Q1 and Q3 of the other “box”. The image (Figure 8) displays four box plots illustrating the variation in four different carbon-related parameters across four distinct sampling periods. The parameters evaluated are the plant carbon stock, plant carbon stock biomass, soil carbon stock, and soil carbon stock bulk density. The data are categorized into four sampling periods: the 1st sampling, 2nd sampling, 3rd sampling, and 4th sampling, each distinguished by a unique color. The Y-axis shows the Value (arbitrary units) and the X-axis shows the sampling period i.e. 1st sampling (Red), 2nd sampling (Green), 3rd sampling (Cyan), and 4th sampling (Purple).
For Plant Carbon Stock, the 1st sampling period displays a lower median value than the other periods, with a relatively wide interquartile range. The 2nd sampling period has the highest median value and a moderate interquartile range. The 3rd sampling period has a median value similar to the 2nd but with a narrower interquartile range. The 4th sampling period indicates a lower median value, with the interquartile range indicating less variability than earlier periods. For Plant Carbon Stock Biomass, the 1st sampling period shows a relatively low median value with a moderate interquartile range. The 2nd sampling period has the highest median value, indicating a significant increase in biomass, with a wide interquartile range. The 3rd sampling period presents a high median value with considerable variability. The 4th sampling period shows a decrease in the median value, with a moderate interquartile range.
For Soil Carbon Stock, the 1st sampling period shows a moderate median value with some variability. The 2nd sampling period has a slightly lower median value and reduced variability. The 3rd sampling period shows an increase in the median value, with a broad interquartile range. The 4th Sampling period indicates the highest median value and the greatest variability, suggesting an increase in soil carbon stock over time. For Soil Carbon Stock Bulk Density, the 1st sampling period shows a moderate median value with some variability. The 2nd sampling period has a slightly lower median value and reduced variability. The 3rd sampling period shows an increase in the median value with a moderate interquartile range. The 4th sampling period indicates the highest median value and variability, suggesting increased soil bulk density over time.
These box plots provide a detailed visualization of the distribution and variability of plant carbon stock, plant carbon stock biomass, soil carbon stock, and soil carbon stock bulk density across four different sampling periods. The variations in median values and interquartile ranges indicate dynamic changes in these parameters over time, highlighting potential trends in carbon sequestration and soil properties.
Discussion
The results of this research highlight the pivotal role that wetlands play in carbon sequestration through both plant biomass and soil organic matter. This discussion delves into the findings, compares them with literature, explores the implications for climate change mitigation, and identifies areas for further research. Our study demonstrated that wetland herb/grass biomass, including aboveground and belowground components, significantly contributes to carbon sequestration. The average biomass was calculated for each wetland and ranged from 0.83 t/ha to 1.75 t/ha, and the carbon stock ranged from 0.41 t C/ha to 0.87 t C/ ha, with the lowest being recorded at University Lake and the highest at Kerwa Dam. This indicated that University Lake had the lowest mass present in the plants during the study and that Kerwa Dam had more plants with greater biomass. Our study indicates that herbaceous wetlands have considerable potential for carbon storage, which is consistent with findings from similar studies [25,26]. The aboveground biomass of herbs, though often seasonal, can sequester significant amounts of carbon during peak growing periods [27]. The belowground biomass, including that of roots and rhizomes, is particularly important for long-term carbon storage. These structures contribute to soil organic matter as it decays, increasing soil carbon stocks over time. Herbaceous plants exhibit seasonal growth patterns, with carbon sequestration rates peaking during the growing season and declining during dormancy. This variability underscores the need for year-round monitoring to assess annual carbon sequestration rates accurately [28]. The above findings suggest that interannual variability should be considered in long-term carbon budgeting for these ecosystems. Herbaceous wetlands differ from forested wetlands, such as mangroves and peatlands, in terms of their carbon storage dynamics. Studies by Chmura et al., and Donato et al., have shown that while mangroves and peatlands are more effective in storing carbon aboveground, herbaceous wetlands can be equally effective when considering belowground carbon stocks [29,30].
Several factors can be responsible for these results, such as University Lake being excluded, but anthropogenic activities take place there. This area is also a location for cattle grazing and fishing activities and is quite polluted i.e., both lake water and the surrounding area. In the case of Kerwa Dam and Hataikheda Dam, fewer anthropogenic activities, reduced cattle grazing, a good amount of forest cover, and high temperatures as herbs store more biomass at high temperatures were in place [31].
Results support the extensive literature on wetland soil carbon dynamics [32,33]. The total carbon stock of each wetland was calculated by combining data on the average carbon stock in herbs, shrubs, and grasses (HGC) and soil organic carbon (SOC). It ranged from 16.34 t C/ha to 23.28 t C/ha. In general, soil captures more carbon than does vegetation in wetlands and the results revealed that the SOC was greater than the carbon stock of vegetation [34]. After combining both methods, the results revealed that the Kerwa Dam had the highest stock of carbon stored, followed by the Hataikheda Dam, the Kaliasot Dam, and the Laharpur Dam, which stored the least amount of carbon.
The reasons that can be listed for Kerwa Dam having the highest carbon stock include appropriate land use practices such as less deforestation, less urbanization near the Dam, along with no to minimum soil tillage, optimum temperature and moisture content for more sequestration, minimum grazing, and pollution around. The Laharpur Dam, first and foremost under constant tilling, and covered with invasive weeds all over i.e., water hyacinth, prominent cattle grazing, and agricultural practices near the dam were observed which do not provide enough room for carbon capture. The CO2 equivalent values ranged from 59.96 tons to 85.43 tons. Herbaceous wetlands play a crucial role in carbon sequestration through both aboveground and belowground biomass. Protecting and restoring these ecosystems is vital for increasing their carbon storage capacity and mitigating climate change [35]. Continued research and adaptive management are essential to optimize the carbon sequestration potential of herbaceous wetlands and to integrate them effectively into global carbon management strategies [36-40].
Conclusion
Wetlands act as major carbon reservoirs on Earth. They play an important role in the circulation of different resources. Plants in the wetlands take up atmospheric CO2 during photosynthesis and convert it into carbohydrates. In this way, atmospheric carbon dioxide will enter the food web and be consumed by other organisms. According to the Ramsar secretariat, approximately 1/3rd of the world's terrestrial carbon is trapped and stored in wetlands, which is double that of forests. This study highlights the importance of wetlands as reliable sources for capturing carbon and mitigating climate issues. Additionally, the study of herbs, shrubs, and grasses has generally been ignored in the context of biomass and carbon sequestration in wetlands, as they constitute a small fraction of the whole process but play an important role in the carbon cycle, therefore, more studies are necessary at the global level, they would be important in terms of carbon sequestration. Concerning wetlands, they have the potential to sequester carbon and store it for long periods, but some necessary action should be taken first. Sustainable land-use planning, considering the ecological value of wetlands, is crucial for their conservation.
The integration of traditional ecological knowledge with scientific research can provide valuable insights into wetland management. Minimizing human interference and all related anthropogenic activities, enforcing no pollution near these sites, and restricting tourist spots are one way to do so. Some wetlands such as Jawahar Bal Udyan Park, Bhadbhada Dam, and Laharpur Dam need urgent attention as they have been affected the most. Citizens should be made aware of our wetlands and how the wetlands can prove to be saviors in the crisis of climate change.
References
1. Bassi, N., Kumar, M. D., Sharma, A., & Pardha-Saradhi, P. (2014). Status of wetlands in India: A review of extent, ecosystem benefits, threats and management strategies. Journal of hydrology: Regional studies, 2, 1-19.
2. Smith, P., Martino, D., Cai, Z., Gwary, D., Janzen, H., Kumar, P., ... & Smith, J. (2008). Greenhouse gas mitigation in agriculture. Philosophical transactions of the royal Society B: Biological Sciences, 363(1492), 789-813.
3. Gayathri, R., Mahboob, S., Govindarajan, M., Al-Ghanim, K. A., Ahmed, Z., Al-Mulhm, N., ... & Vijayalakshmi, S. (2021). A review on biological carbon sequestration: A sustainable solution for a cleaner air environment, less pollution and lower health risks. Journal of King Saud University-Science, 33(2), 101282.
4. Chen, Y., Liu, Z., Rao, X., Wang, X., Liang, C., Lin, Y., ... & Fu, S. (2015). Carbon storage and allocation pattern in plant biomass among different forest plantation stands in Guangdong, China. Forests, 6(3), 794-808.
5. Du, W., Li, Z., Zhang, Z., Jin, Q., Chen, X., & Jiang, S. (2017). Composition and biomass of aquatic vegetation in the Poyang Lake, China. Scientifica, 2017(1), 8742480.
6. Nag, S. K., Das Ghosh, B., Nandy, S., Aftabuddin, M., Sarkar,
U. K., & Das, B. K. (2023). Comparative assessment of carbon sequestration potential of different types of wetlands in lower Gangetic basin of West Bengal, India. Environmental Monitoring and Assessment, 195(1), 154.
7. Rosli, F. A., Lee, K. E., Goh, C. T., Mokhtar, M., Latif, M. T., Goh, T. L., & Simon, N. (2017). The Use of Constructed Wetlands in Sequestrating Carbon: An Overview. Nature Environment & Pollution Technology, 16(3).
8. Lal, R. (2021). Soil management for carbon sequestration. South African Journal of Plant and Soil, 38(3), 231-237.
9. Malak, D. A., Marín, A. I., Trombetti, M., & Roman, S. S. (2021). Carbon pools and sequestration potential of wetlands in the European Union. Viena and Malaga: European Topic Centre on Urban, Land and Soil Systems.
10. Kell, D. B. (2012). Large-scale sequestration of atmospheric carbon via plant roots in natural and agricultural ecosystems: why and how. Philosophical Transactions of the Royal Society B: Biological Sciences, 367(1595), 1589-1597.
11. Chen, H., Popovich, S., McEuen, A., & Briddell, B. (2017). Carbon and nitrogen storage of a restored wetland at Illinois’ Emiquon Preserve: potential for carbon sequestration. Hydrobiologia, 804, 139-150.
12. Yao, X., Yang, G., Wu, B., Jiang, L., & Wang, F. (2021). Biomass estimation models for six shrub species in hunshandake sandy
land in inner Mongolia, Northern China. Forests, 12(2), 167.
13. Acosta Mireles, M., Carrillo Anzures, F., Buendía Rodriguez, E., Benavides Solorio, J. D. D., Flores Ayala, E., & González Molina, L. (2020). Carbon in soil, herbs and shrubs in a plantation forest in Jalisco, Mexico. Revista mexicana de ciencias agrícolas, 11(6), 1377-1387.
14. Gogoi, A., Ahirwal, J., & Sahoo, U. K. (2021). Plant biodiversity and carbon sequestration potential of the planted forest in Brahmaputra flood plains. Journal of Environmental Management, 280, 111671.
15. Jhariya, M. K., & Yadav, D. K. (2018). Biomass and carbon storage pattern in natural and plantation forest ecosystem of Chhattisgarh, India. Journal of forest and environmental science, 34(1), 1-11.
16. Bazezew, M. N., Soromessa, T., & Bayable, E. (2015). Carbon stock in Adaba-Dodola community forest of Danaba District, West-Arsi zone of Oromia Region, Ethiopia: An implication for climate change mitigation. Journal of Ecology and the Natural Environment, 7(1), 14-22.
17. Pearson, T. R. (2007). Measurement guidelines for the sequestration of forest carbon (Vol. 18). US Department of Agriculture, Forest Service, Northern Research Station.
18. Meena, A., Bidalia, A., Hanief, M., Dinakaran, J., & Rao, K. S. (2019). Assessment of above-and belowground carbon pools in a semi-arid forest ecosystem of Delhi, India. Ecological processes, 8, 1-11.
19. Negash, M., & Starr, M. (2015). Biomass and soil carbon stocks of indigenous agroforestry systems on the south-eastern Rift Valley escarpment, Ethiopia. Plant and soil, 393, 95-107.
20. Wei, D., Qi, Y., Ma, Y., Wang, X., Ma, W., Gao, T., ... & Wang, X. (2021). Plant uptake of CO2 outpaces losses from permafrost and plant respiration on the Tibetan Plateau. Proceedings of the National Academy of Sciences, 118(33), e2015283118.
21. Allen, S. E., Grimshaw, H. M., Rowland, A. P. (1986). Chemical analysis. In ‘Methods in plant ecology’. (Eds PD Moore, SB Chapman) pp. 285-344. (Blackwell Scientific Publications: Oxford).
22. Bhattacharyya, S. S., Mondaca, P., Shushupti, O., & Ashfaq, S. (2023). Interplay between plant functional traits and soil carbon sequestration under ambient and elevated CO2 levels. Sustainability, 15(9), 7584.
23. Atsbha, T., Desta, A. B., & Zewdu, T. (2019). Carbon sequestration potential of natural vegetation under grazing influence in Southern Tigray, Ethiopia: implication for climate change mitigation. Heliyon, 5(8).
24. Chave, J., Réjouâ?Méchain, M., Búrquez, A., Chidumayo, E., Colgan, M. S., Delitti, W. B., ... & Vieilledent, G. (2014). Improved allometric models to estimate the aboveground biomass of tropical trees. Global change biology, 20(10), 3177-3190.
25. Mitsch, W. J., & Gosselink, J. G. (2000). The value of wetlands: importance of scale and landscape setting. Ecological economics, 35(1), 25-33.
26. Bridgham, S. D., Megonigal, J. P., Keller, J. K., Bliss, N. B., & Trettin, C. (2006). The carbon balance of North American wetlands. Wetlands, 26(4), 889-916.
27. Salunkhe, O., Khare, P. K., Gwalwanshi, D. R., & Uniyal, S. (2014). Biomass estimation from herb, shrub and litter component of tropical dry deciduous forest of Madhya Pradesh state of India. J Ecol, 109, 358-362.
28. Baggaley, N., Britton, A., Sandison, F., Lilly, A., Stutter, M., Rees, R. M., ... & Buckingham, S. (2022). Understanding carbon sequestration from nature-based solutions. The James Hutton Institute.
29. Chmura, G. L., Anisfeld, S. C., Cahoon, D. R., & Lynch, J. C. (2003). Global carbon sequestration in tidal, saline wetland soils. Global biogeochemical cycles, 17(4).
30. Donato, D. C., Kauffman, J. B., Murdiyarso, D., Kurnianto, S., Stidham, M., & Kanninen, M. (2011). Mangroves among the most carbon-rich forests in the tropics. Nature geoscience, 4(5), 293-297.
31. Sangma, T. D., Das, M. (2019). Biomass of herbs and litter in the tropical forests of Garo hills, Meghalaya, India. International Journal of Emerging Technologies and Innovative Research, 6(4), 510-516.
32. Mitsch, W. J., Bernal, B., Nahlik, A. M., Mander, Ü., Zhang, L., Anderson, C. J., ... & Brix, H. (2013). Wetlands, carbon, and climate change. Landscape ecology, 28, 583-597.
33. Lal, R. (2004). Soil carbon sequestration impacts on global climate change and food security. science, 304(5677), 1623- 1627.
34. Waqar Ahmed Khan, R., Shaheen, H., & Awan, S. N. (2021). Biomass and soil carbon stocks in relation to the structure and composition of Chir Pine dominated forests in the lesser Himalayan foothills of Kashmir. Carbon Management, 12(4), 429-437.
35. Gautam, T. P., & Mandal, T. N. (2016). Effect of disturbance on biomass, production and carbon dynamics in moist tropical forest of eastern Nepal. Forest Ecosystems, 3, 1-10.
36. Alemu, B. (2014). The role of forest and soil carbon sequestrations on climate change mitigation. Res J Agr Environ Manage, 3(10), 492-505.
37. Chopra, N., Tewari, L. M., Tewari, A., Wani, Z. A., Asgher, M., Pant, S., ... & Siddiqua, A. (2023). Estimation of biomass and carbon sequestration potential of Dalbergia latifolia Roxb. and Melia composita Willd. plantations in the Tarai Region (India). Forests, 14(3), 646.
38. Karki, S., Joshi, N. R., Udas, E., Adhikari, M. D., Sherpa, S., Kotru, R., ... & Ning, W. (2016). Assessment of forest carbon stock and carbon sequestration rates at the ICIMOD Knowledge Park at Godavari.
39. Naidu, V. S. G. R. (2012). Hand book on weed identification. Directorate of weed science research, Jabalpur, India, 354.
40. Umrao, U., Biswal, A., Upadhyay, R., Tiwari, K., & Negandhi, D. (2018). Common Plants of the Riparian Zone of the River Narmada: Hoshangabad and Harda Districts. New Delhi, India: The Nature Conservancy India.