


Research Article - (2025) Volume 3, Issue 3
Appropriate Method of Determination the Sediment Retained by Check Dams in Arid Region (South Eastern Iran)
Received Date: Aug 01, 2025 / Accepted Date: Sep 03, 2025 / Published Date: Sep 19, 2025
Copyright: ©©2025 Mansour Jahantigh, et al. This is an open-access article distributed under the terms of the Creative Commons Attribution License, which permits unrestricted use, distribution, and reproduction in any medium, provided the original author and source are credited.
Citation: Jahantigh, M., Jahantigh, M. (2025). Appropriate Method of Determination the Sediment Retained by Check Dams in arid Region (South Eastern Iran). J Water Res, 3(3), 01-15.
Abstract
Check dams as an important engineering structure are widely used to modify the hydrological responses and reduce soil erosion in watersheds. Hence, to identify the effectiveness of check dams and gain better insight into the construction of this structure in arid areas, it is necessary to present the adapted method to calculate the sediment volume trapped by check dam system. In this study, we evaluate three methods to calculate and estimate the sediment volume trapped by check dam systems based on geometric shapes including U-shaped geometric, Prism, and Pyramid. These methods were tested on a sample of 25 check dams that were constructed in the Snib basin (southeast Iran). by topographical survey and applying technical field works, the dimensions of the sediment deposited behind of each check dam were measured and the volume of retained sediment, Trap efficiency, sediment yield, total sediment yield and sediment emission was calculated for each check dams. The results showed that absolute variation in the volume of retained sediment and sediment yield based on the U-shaped method comparing other methods is from 23% to 34%. Meanwhile, due to the high variability of the check dam, comparing methods in groups combined present significant differences in sediment volumes, sediment yield, and total sediment yield when check dams are between 15 - 35 m in length and have a height of between 2 and 4 m. Overall, the use of U-shaped geometric method with high accuracy can provide valuable information to estimate total sediment yield and evaluate check dam effects when valleys present a uniform U-shape such as our study area. The outcome of these studies can be used as a basis for evaluating the effects of check dams to estimate sediment yields and mitigate natural hazards at ungauged basins in arid areas.
Keywords
Gullies, Erosion Models, Check Dam, Sediment Wedge, Topographic Survey
Introduction
Currently, gully erosion is a prominent environmental challenge in arid regions which accelerates the land degradation process. The alarming consequences of this phenomenon appear as sediment transport and deposition in natural lakes and water reservoirs, silting channel, water quality deterioration, soil fertility, and land disasters which threatens sustainable development goals [1-3]. In this regard, the construction of check dams as an important engineering structure can modify the hydrological responses and reduce soil erosion, especially in arid regions [3,4]. Therefore, these structures in valley river beds by mitigating the flood velocity and sediment delivery have a key role in soil and water conservation in arid areas. For this reason, their construction is very common in land restoration projects worldwide [5-7]. Hence, to identify the effectiveness of check dams and obtain satisfactory results from these engineer structures at ungauged basins, it is necessary to present the adapted method to calculate the sediment volume trapped by check dam system. The efficiency of check dams usually estimates based on the volumes of sediment trapped by check dams. Recently, many models with different accuracy, precision and complexity had used to estimates the sediment volumes [8- 10]. Some reports illustrated that, due to the complexity, precision, and accuracy of these methods, the requires data of each model and the suitability of the model for the study area should be taken into account; therefore, this hypothesis is highlighted in ungauged basins, especially in arid regions [6,8,11]. Many studies such as calculated the sediment received behind the check dams based on a simple hypothesis which estimates the sediment retain according to the sediment wedge volume behind the check dam with a solid of known geometry [8,11-13]. In parallel, to determine the sediment trapping, presented a methodology based on a topographical survey together with a calculation process matrix in Spain, which depicted the suitable results in the studied area. Besides that, to calculate the volume of trapped sediments by each structure using Prism, Pyramid, Trapezoids, and Section Methods, indicated that the Section method due to involves detailed and precise topographic surveys presents the most accurate than other methods [14]. As, inference from researches, the method approaches and their precision strongly depends on the accuracy of data collection and accessible morphometric parameters, which trigger to present acceptable methodology to estimate sediment volume by check dams and consequently calculation of sediment yield at watershed level. Hence, the analysis of the different models provides a basis line to gain a better insight into the estimation of the potential sediment volume trapped by check dam systems and erosion rate in ungauged basins, especially in arid regions. The Taftan watershed, which is located in southeast Iran, has a arid climate with critical ecological conditions. Meanwhile, the synergistic effect of uniformity of distribution of precipitation, drought and lack of vegetation have led to accelerated land degradation over the basin, while livelihoods predominantly depend on agricultural and livestock products in this area [4,15]. For this reason, the restoration projects by construction check dams were conducted to modify the hydrological responses and control gully erosion and consequently increase rural livelihoods, and welfare and improve ecosystem services in this area during the 1991s. Therefore, the aim of the present study is to evaluate the volume of sediment trapped by a sample of check dams and consequently determine the sediment yields at the watershed level through exact measuring of the sediment deposited behind check dams. Hence, we use the different models based on topographical manner to estimate the amount of sediment trapped by check dams in the Snib basin of Taftan watershed. The results of this study will provide valuable information to determine the most accurate method for determining sediment yield rates in the Taftan watershed.Material and methods
Description of Study Site
The Snib basin is located between 28° 40′ and 28° 3′ N latitude and 60° 57′ and 60° 46′ E longitude in Sistan and Baluchestan Province, south-eastern Iran. This watershed is part of the Taftan sub-basin (about 30 km northwest of Khash city) which is at an average altitude of 2301 m above sea level (Figure 1). The livelihood of stakeholders in Snib basin is profoundly dependent on crop production and livestock, while water scarcity and lack of vegetation are prominent challenges in this area [16]. Rainfall is highly sporadic, both in terms of total winter and temporal distribution. The annual average precipitation in the study area is 174.9 mm, most of which occurs from January to May. This region has a dry climate and the average annual temperature is 15.7° C. the soil in the mentioned area is depthless (10 to50 cm), characterized by coarse sand and light textured. Geologically, the area is mainly covered by hard rocks. The plant community in the study area belongs to 47 families of which 62.4% and 37.6% are related to annual and perennial plants respectively [15]. The rainfall intensity for the 24-hour period for 2, 5, 10, 25, 50. and 100 year return period is equal to 38.2 54.6, 65.4, 79, 89.1, and 99.7 mm, respectively. Hence the peak discharges of Taftan basin were 16.8, 32.7, 44.1, 59.5, 71.5 and 83.9 m3 respectively (Table 1). The Snib watershed has an area of 699.6 ha and a length of 4.12 km, with an elevation difference of 864-metre and high erosion potential. The check dams in the study area were structured by loose rock cement during the 1991s to control flood risk and soil erosion (Figure 2)
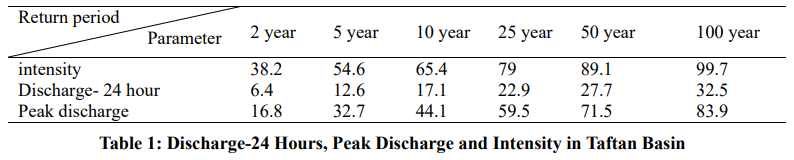

Figure 1: Location of the Study Area: A Map of Iran, B the Location of Sistan and Baluchestan Province in Iran, C Location of Taftan Watershed in Khash County, D Studied Area in Taftan Watershed, E Google Earth Image for the Study Area Includes Check Dams, Basin Boundary and Digital Elevation Model (DEM).
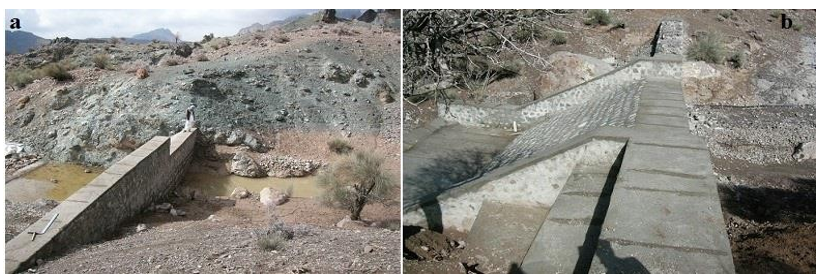
Figure 2: View of Loose Rock-Cement Check Dam Number 13 (a) and 16 (b) Built in the Study Area
Methodology
To conduct this research, first the basic field reports of the Snib watershed were studied. In a second step field visits were made and data were collected. In this regard, 25 check dams within this basin were selected to assess the sediment retention capacity of the check dam reservoirs. In this research, the volume of retained sediment was determined by three topographic methods including U-shaped geometric, Prism shape, and Pyramid shaped for each check dams [8,17]. Topographic survey for all methods was obtained during field work and cross profiles of the sediment received by each check dam were estimated. The schematics of three methods to estimate the volume of the sediment wedge and their necessary field measurements are presented in Figure. 3.
Volume of Trapped Sediment
To determine the volume of retained sediment behind the check dams the U-shaped method used Eq. 1 [17]. This method considers the topographical survey on the sediment begetting by the existence of the check dams.
V = L * dm * wm (1)
Where V is the sediment volume, L is the length of the sediment reserve, dm and wm are the mean sediment depth and mean sediment width in every 5 m of sediment length, respectively. The Pyramid method considers the medium width of the sediment deposited (w) as the width of a theoretical trapezoid. This is praised as the mean in the middle of the channel width up the ground across profile downstream of the check dam (wb) and the mean width of the cross profile on the sediment wedge (ws). The sediment volume was calculated by using Eq. 2 [8].
V= w * ls* h*1/2 (2)
Where ls is the length of the sediment deposit, h is the sediment height calculated from the bottom to the top of the structure, and V is the sediment volume. To calculate the sediment wedge length and w the mean width of the sediment wedge used Eq. 3.
w = (wb + ws) / 2 (3)
The pyramid method proposed by Romero with trapezoidal base to estimate the sediments volume according Eq. 4. This method considers the volume of sediment like a pyramid in a horizontal position for each check dams [18].
V = b * H/3 (4)
Where V is the volume of the retained sediment, H the length of sediment wedge, and b is the area of the pyramid base of check dam.
Bulk density
To determine the bulk density of sediment wedge used cylinders method. Sediment samples (75 samples) have been taken along the sediment wedge lengths, at 1m from the check dam spillways with 3 points and 6 m between samples [17,19,20].
Trap efficiency
The efficiency of check dams because it is mainly related to the depository capacity of the check dam and the sediment drainage region, was estimated through their Trap efficiency [6,20,21]. To calculated the TE used equation (Eq.5) as follow :
TE = 100 * (1- 1/(1 + 0.0021D * C/W)) (5)
Where D is theoretical factor that can changes from 0.046 and 1 depending to the reservoir characteristics,) proposed D value near to 1 when reservoir sub-basin low [22]. C is the reservoir capacity (m3) and W is the drainage area (km2).
Sediment yield, Total sediment yield and Sediment emission
Sediment yield (SY; t ha-1 year-1) and total sediment yield and erosion rate (TSY; t ha-1 year-1) were measured for each check dam by using Eq 6 and 7, similar in other studies [17,20,21].
SY = (p*V)/(A*Y) (6)
TSY = (SY/TE) (7)
Where ρ is the bulk density (t m3) of the sediment received by each check dam, V is the volume of the sediment deposited in each check dam reservoir (m3), A is the drainage area to each check dam (ha), Y is the time since the check dam was made until the sediment volume was estimated (years) and TE is the trap efficiency of every check dam (in percentage). We measured the sediment emission (SE S; t ha-1 year -1) for each check dam and method according to Eq.7.
TSY = SY + SE (8)
Where TSY is total sediment yield (t ha-1 year-1), SY is sediment yield (t ha-1 year-1) and SE is the sediment emission (t ha-1 year-1). The mentioned equation helps us to calculate the quantitative from the total sediment that wasn’t deposited behind the check dams and was integrated enter into the drainage catchment.
Statistical analysis
In the first step, we performed the NOVA test to compare the V, WS, TE, SY, TSY, and SE between study methods. Then to gain a better insight into the capability of estimating between study methods, we classify the check dam with similar characteristics such as sediment volume, sediment weight, Sediment yield, total sediment yield, sediment emission, bulk density, height, and length of check dams. Hence a cluster analysis was performed using squared Euclidean distance and Ward's grouping method [14]. Then to reveal the difference between groups used a ONE- WAY ANOVA. To compare the difference between groups and methods a repeated-measures ANOVA test by employing a PROC MIXED model was performed. Moreover, we used a simple linear regression analysis between the study methods to determine the best correlation between the U-shaped and other methods. All the analyses were conducted using the R programing software, version 4.3.2. In this study we used packages dplyr, Cluster, emmeans, and lsmeans for data analysis and clustering and package ggplot2 for Graph plotting and exploring the correlation between study methods [23-25].
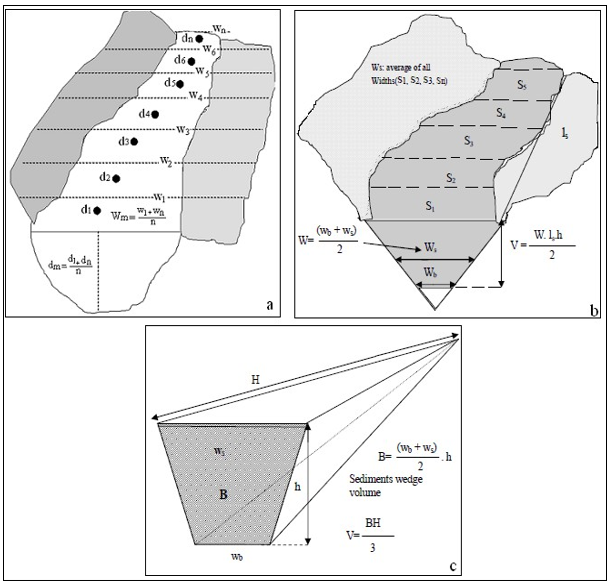
Figure 3: Schematic of Methods to Calculating Sediment Volume Behind the Check Dams, a U-Shaped Geometric, b Prism Shape, c Pyramid Shaped.
Result
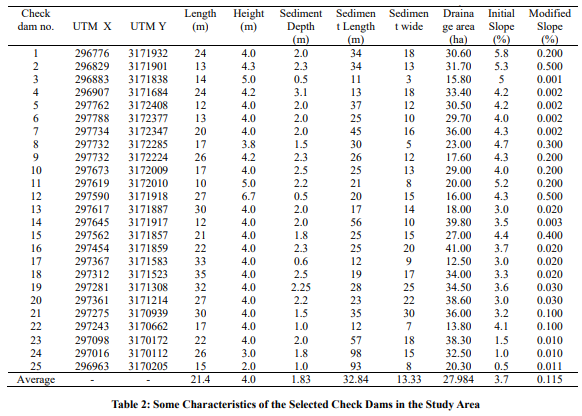
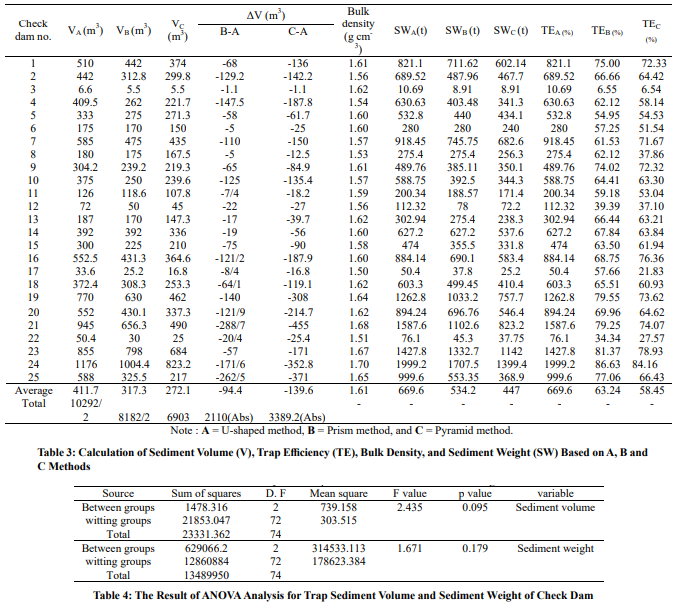
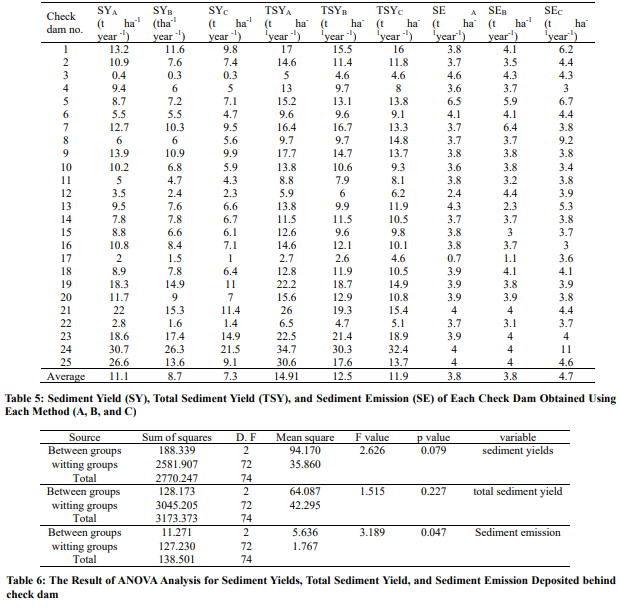
The result of field measurement indicates that the size of these structures at the watershed level is different; the average width and height of check dams are 21.4 and 4 m, respectively (Table 2). The total and average length of the sediment wedge is equal to 821 and 32.84 m; the sediment wedges had an average slope of 3.7% and the sediment texture was mainly sandy. The results of calculation of sediment volume, sediment weight, and trap efficiency using tree methods are presented in Table 3. Using the U-shaped method, the total volume of retained sediment was estimated equal to 10299.2 m3 for all the check dams. Also, the average sediment volume was calculated at about 411.7 m3 with a minimum retained volume by check dam of 6.6 m3 and a maximum of 1176 m3. In contrast, the total sediment trapped based on Prism and Pyramid methods were estimated equal to 8211.2 and 6903 m3 respectively [8,18]. The average sediment volume was calculated in the order 317.3 and 272.1 m3 according to mentioned methods. Moreover, the lowest amount of sediment volume is estimated in the order of 5.5 m3 (VC) and 5.5 m3 (VB) and the highest in order of 1004.4 (VB) > 823.2 (VC) m3. Differences in mean values with respect to the reference U-shaped method are 23 % and 34% for the B and C methods respectively. Despite notable difference between study methods, but there were no significant differences between the sediment volumes (Table 4). Comparing the total results manifests that differences between methods are not high. Hence to gain better insight into the capability of estimating between study methods, we determined the absolute values by calculating the differences in volume for each check dam. According to the result, the difference in volume in absolute value is equal to 3389.2 m3 and 2110 m3 which are estimated by the C and B method respectively. However, the analysis of the absolute values indicates that the volume differences according to methods C and B are 23% and 34% lower than the A method. The bulk density of the retained sediment in the check dam range is from 1.5 to 1.7 g cm-3 with a mean value of 1.61 g cm-3, which was relatively homogeneous among all the check dams (standard deviation = 0.049, coefficient of variation, Cv = 3.1 %). Thus, with this assumption, the mean weight of sediment trapped by check dams was in the order 669.6 (ton) > 534.2 (ton) > 447 (ton) based on the A, B, and C methods respectively. while the differences between methods are clear but showed no significant difference (Table 4). As inference from Table 3, the trap efficiency variation (TE) among the methods is remarkable. The mean TE for all of the check dams was approximately 63.32 % which refer to relatively good value of trap efficiency. The mean TE among the methods in the order is 68.27% > 63.24 % > 58.45 %, which estimated by the A, B, and C methods respectively. Additionally, we determined the sediment yield (SY), total sediment yield (TSY), and sediment emission based on each method to reveal their efficiency in the study area. As shown in Table 5 using the U shape method the mean value of SY and TSY was estimated equal to 11.1 (t ha-1 year-1) and 14.91 (t ha-1 year -1) for all the check dams, while based on the Prism and Pyramid methods estimated to 8.7, 7.3 and 12.5, 12 (t ha-1 year -1). Hence, the differences in mean values based on B and C methods are approximately 22%, 34%, and 17 %, 20 % less than the reference method (A). According to the results analyzing these parameters did not present significant differences between the evaluated methods (Table. 6) The maximum sediment emission was obtained by method C with a mean value of 4.7 t ha- 1year -1, which was 19 % higher than A (3.8) and B (3.8) methods.
Furthermore, data analysis highlighted that the variability of V, SW, SY, TSY, and ES (coefficient of variation Cv > 60 %) within each method between check dams is remarkable (Figure. 4). this variability, due to the different check dam sizes, by error balance between check dams can trigger to overriding the individual differences of study indexes at the watershed level. So, to better identify the changes of indices for each method between check dams, it is necessary to classify the check dam with similar characteristics. Hence, we used a multivariate cluster analysis to determine groups of check dams. As shown in Figure. 5 data is grouped into five meaningful, which details are presented in Table 7. According to results the groups summarized as follows as:
1. Group 1 includes check dams 1, 7, 9, 13, 16, 9, 18, and 20, With height ranges between 4 and 4.20 m, length ranges between 20 and 31m, whose trapped sediment volume ranges and sediment yield ranges from 168.1 to 498.3 m3 and 7.70 to 11.53 t ha-1 year -1 respectively.
2. Group 2 includes check dams 2, 3, 5, 6, 11 and 14, with height ranges between 4 and 5m, length ranges between 10 and 14 m, whose sediment volume ranges from 168.1 to 498.3 m3 and Sediment yield ranges is between 0.33 and 8.63 t ha-1 year -1.
3. Group 3 includes check dams 4, 8, 9, 10, 15, 17, and 22, whose height ranges between 3.8 and 4 m, length ranges between 17 and 33m, and sediment volume ranges is 25.2 and 297.7 m3 and Sediment yield ranges is 1.5 and 7.63 t ha-1 year -1.
4. Group 4 includes check dam 12 with the highest height (6.7 m >) and lowest sediment volume and Sediment yield (> 55.66 m3 and > 87.7) t ha-1 year -1).
5. Group 5 includes check dams 19, 21, 23, 24, and 25, whose trapped sediment volume and Sediment yield are the highest (1001.03 > V, 26.16 > SY). Their height is lower than 4 m and their length ranges from 15 to 35 m.

Figure 4: Dispersion Plot of Sediment Volume (a), Sediment Weight (b), Sediment Yield (c), and Total Sediment Yield (d) for Each Check Dam and Method (n=25) with the Variation Coefficient (Cv) Calculated for Each Method.
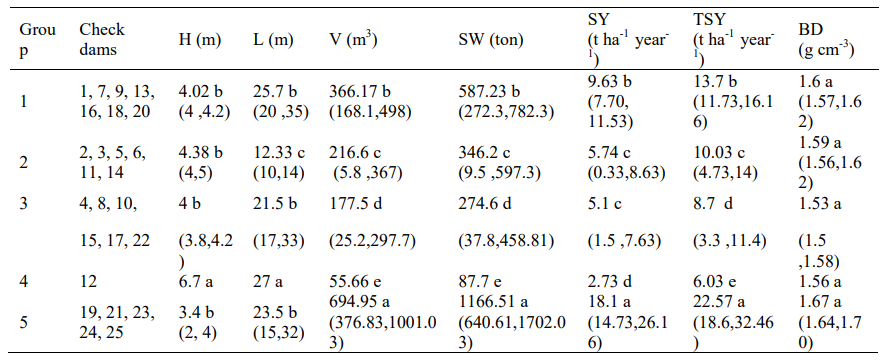
Table 7: Groups of Cluster Analysis and Main Characteristics of Check Dams, Different Letters Indicate Significant Differences Between Groups (H : Check Dam Height, L : Check Dam Length, V : Sediment Volume, SW: Sediment Weight, SY: Sediment Yield, TSY: Sediment Yield, BD: Bulk Density)

Figure 5: The Results of Cluster Analysis for Check Dams as a Function of Mean Sediment Volume, Sediment Weight, Sediment Yield, Total Sediment Yield, Sediment Emission, Bulk Density, Height, and Length of Measured Check Dams
To compare the differences between the check dam group and methods a repeated-measures ANOVA was performed. According to results, the mixed model showed that the study indexes between methods and check dam group are significantly different at 0.05 level, while the iteration between these indexes is not statistically significant. To better interpret the results, we analyze the LS- means between methods and check dam groups. As shown in Figure. 6 the A method (U-shape) presented statistically significant differences in sediment volume, sediment weight, sediment yield and, total sediment yield compared to other methods (with p-value = 0.023, p-value = 0.013, p-value = 0.032, and p-value = 0.034 respectively). The difference between the Prism method (B) and Pyramid (C) are not significant and present similar results to each other. Analyzing the check dam groups indicates that groups 1 and 5 are significantly different (p-value <0.05) from other groups in volume of sediment trapped, sediment weight, sediment yield, and total sediment yield (Figure. 7). However, groups of 2 and 3 with different sizes did not present significantly differences in study indexes. Moreover, analyzing these groups we found that groups 2 and 3 did not present significant differences in sediment volume based on of B and C methods (p-value > 0.05). Furthermore, other groups depicted similar behavior that was revealed by studied methods. Analogously, we observed a similar trend in sediment weight, sediment yield, and total sediment yield by methods and groups mentioned above (Figure. 8). To sum up the comparison of methods we used correlation analysis to evaluate the different methods versus the reference U shape method (A) to determine the best estimation. As shown in Figure. 9, it is possible to detect that the Pyramid method (C) presents a lower correlation (r = 0.942) in sediment volume compared to the Prism method (r =0.96) versus the U-shape method. Similarly, the estimation of sediment weight, sediment yield, and total sediment yield based on method C shows lower correlation (0.95, 0.92, and 0.84 respectively) than method Prism (0.97, 0.94, and 0.94) versus the A method too. The reason can attributed to the use of best topographic information as kye in U-shape and Prism methods, which result in high correlation in estimated factors.

Figure 6: Comparison of LS-Mean Of Sediment Volume (a), Sediment Weight (b), Sediment Yield (c), and Total Sediment Yield (d) According to Each Method. The Different Letters Above Each Method Indicate Significant Differences in LS Mean At the 95% Confidence Level Among Methods.
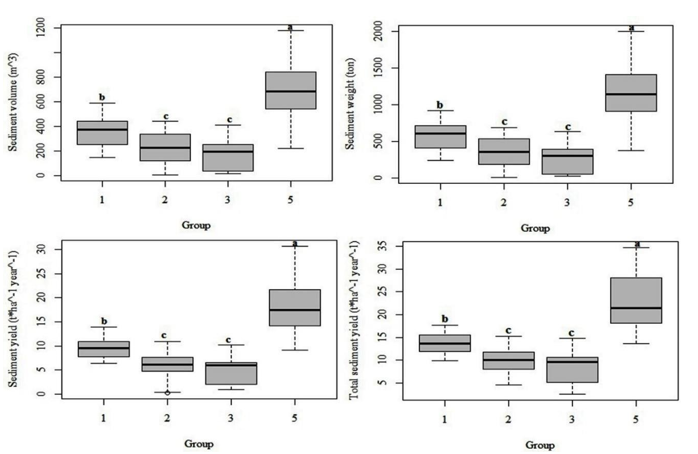
Figure 7: Comparison of LS-Mean of Sediment Volume (a), Sediment Weight (b), Sediment Yield (c), and Total Sediment Yield (d) According to Each Group. The Different Letters Above Each Method Indicate Significant Differences in LS Mean at the 95% Confidence Level Among Groups Check Dam Groups.
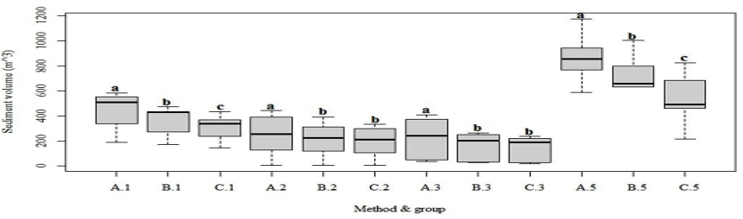
Figure 8: Comparison of LS-Mean of Sediment Volume (a), Sediment Weight (b), Sediment Yield (c) and Total Sediment Yield (d) for Interaction Method-Check Dam Groups. The Different Letters Above the Methods Indicate Significant Differences in LS Mean at the 95% Confidence Level Among Methods.

Figure 9: Regression Analyses Between the U-Shape Method (A), Prism Method (B) and Pyramid Method (C)
Discussion
Arid lands in southeastern Iran are characterised by relative extremes in the hydrological cycle, including high evaporation and temperature, low precipitation with high-intensity storms, short flow duration with high volume of runoffs as well as channel transmission losses. Meanwhile, check dam construction as a key watershed management operation by modifying the hydrological responses in the watershed triggers to mitigate flood and sediment delivery at the watershed level [2,4,23]. The aim of constructing check dams in the Taftan watershed was to control and store surface runoff and consequently mitigate the sediment yield at the watershed level. Field measurements reveal that the average slope of the gully bed was modified by 0.115, while the initial gully bed slope was 3.7 percent for check dams which depicted an average decreasing of 3.58% (Figure. 10). As precipitation drainage into the main river is largely related to the bed slope, it is clear this decrease in slope leads to lesser sediment in the channel. Hence to obtain satisfactory results from these engineer structures at ungauged basins in arid regions, it is necessary to present the adapted method to calculate the sediment volume trapped by the check dam system to identify the effectiveness of check dams and gain better insight into construction of these structures in arid area. In this research, we used three topographic methods including U-shaped geometric (A), Prism shape (B), and Pyramid shaped (C) to measure V, SW, SY, and TSY by each check dam. The total volume of trapped sediment was estimated based on methods A, B, and C are equal to 10299.2, 8211.2, and 6903 m3 respectively. According to the results, the difference of absolute value in sediment volume respect to the reference U-shaped method is equal to 3389.2 m3 and 2110 m3 which shows 23 % (B) and 34 % (C) differences in the sediment volume compare to A method. Also, differences between methods are clear but do not show significant difference. Analogously, we observed similar trend in other parameters. In this respect, Ramos- Diez stated that differences between estimate methods to assess studied indices are very small when considering the data as a whole [14]. Ramos pointed out that sometimes the methods due to overestimate or underestimate the shape of the sediment wedge for every check dam trigger to error measure compensation [27]. By classifying the check dam into five meaningful groups, the result indicated that the changes of indices for each method between check dams are remarkable. So, the U-shape method presented statistically significant differences in sediment volume, sediment weight, sediment yield, and total sediment yield compared to other methods (p-value > 0.05). Despite notable difference between the Prism shape (B) and Pyramid shape (C), but there were no significant differences between the study indexes. As results illustrate that there are differences between methods to determine indices when the check dams are between 15 and 35 m in length and have a height of between 2 and 4 m, however when check dams are between 4 and 5 m in height are present similar accuracy. As results depicted, there were no differences between the Prism and Pyramid methods for determining study indices [8]. In parallel, (2011) reported that using Prism and Pyramid method due to shape of simple prismatic approximation, presents similar estimates of erosion rates and sediment volume [17]. The mean Trap efficiency (TE) for all of the check dams which constructed by loose rock- cement was approximately 63.32 %. (2012) estimated check dam TE by using the Brown and Jarvis model in the Quipar catchment (Murcia) approximately 83.9%, which is perceptibly higher than our result in the Taftan watershed [6]. This fact could be attributed to various factors such as catchment geomorphology and soil depth [3]. As inference from results, the reliability of estimates between study methods are different and it is necessary to determine which method is more reliable. Previous studies have illustrated that the methods must correctly represent some parameters such as sedimentary wedges, fitting their shapes as well as possible, and tacking into account the basic rules of geometric calculus [14,28]. The U-shape method can consider variations in the streambed along the length of the sediment wedge for each check dam when valleys present a uniform U-shape as our study area [14,29]. Some reports stated that the U-shape method uses data from other gullies whose shape with the real and natural streambed measured, while Pyramid and Prism methods propose the natural streambed as a polygonal surface and appropriate when valleys V shape [14]. Hence the U-shape method is the most influential in calculating the total volume of the trapped sediment when the shape of the sediment wedge is not simple and can provide a higher accuracy to measure the sediment yield at the watershed level [14,28]. Therefore, we conclude that the U-shape method can be considered more accurate than other methods in the calculation study indices which presents the sediment wedge with the lowest error by means of a detailed topographical survey [30,31].
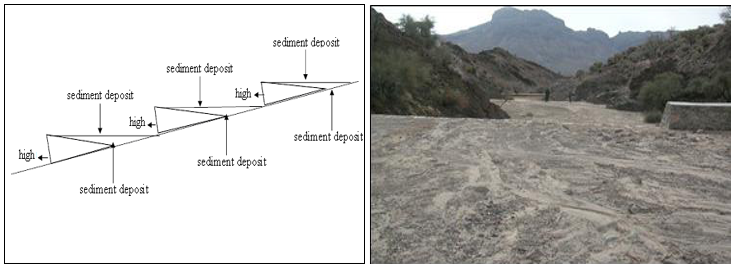
Figure 10: a) Typical Check Dams After Were Received Sediment, b) Check Dam Reservoirs Which Filled With Sediment
Conclusion
Check dams as an important engineering structure are widely used to modify the hydrological responses and mitigate sediment transport to soil and water conservation and also environmental sustainability in arid areas. Estimate methods of sediment volume trapped by check dams due to the complexity and quality of required field data by each methods present different results. Hence, to identify the effectiveness of check dams it is necessary to use methods with high accuracy. The results depict that Trapezoids and Pyramid methods based on simple geometric figures trigger underestimated the V (23% and 34%) and TSY (22% and 34%) at the Snib watershed. As becomes evident the U-shaped method uses the best detail and represents the most real estimation for V, SW, SY, TSY, and ET in the study area. The reason is largely attributed to more detailed topographical survey than other methods which results in the best geometrical calculation and consequently best estimation in study indices. Additionally, the U-shape method can consider variations in the streambed or gullies with U-shape such as our study area. Therefore, check dam reservoirs based on U-shape method can receive 73.8% of the suspended solids from channel runoff, while according to Trapezoids and Pyramid methods estimated by 60.8 and 58.4 % at watershed level respectively. Based on this reality, the U-shape method can present real results due to the better accuracy from the topographic scrutiny. Overall, choosing estimation methods depends on the complexity of the area and quality of field data, which should be analyzed at ungauged basins.
Declaration
Competing Interests
The authors declare no competing interests.
Financial Interests
Authors declare they have no financial interests.
Author Contributions
All authors contributed to the study conception and design.
Data Availability
All data supporting the findings of this study are included within the article
References
- Singh AK (2010) Current status of degraded lands in India, Soil and Water Conservation Today, News Letter 5(2).
- Jahantigh, M., & Pessarakli, M. (2011). Causes and effects of gully erosion on agricultural lands and the environment. Communications in soil science and plant analysis, 42(18), 2250-2255.
- Margiorou, S., Kastridis, A., & Sapountzis, M. (2022). Pre/post-fire soil erosion and evaluation of check-dams effectiveness in mediterranean suburban catchments based on field measurements and modeling. Land, 11(10), 1705.
- Jahantigh, M., & Jahantigh, M. (2023). Evaluating the impact of watershed management on the environmental sustainability of the Taftan watershed in arid areas of southeast Iran. Arabian Journal of Geosciences, 16(6), 377.
- Boardman, J., & Foster, I. D. (2011). The potential significance of the breaching of small farm dams in the Sneeuberg region, South Africa. Journal of Soils and Sediments, 11(8), 1456- 1465.
- Romero-Díaz, A., Marín-Sanleandro, P., & Ortiz-Silla, R. (2012). Loss of soil fertility estimated from sediment trapped in check dams. South-eastern Spain. Catena, 99, 42-53.
- Zhao, G., Klik, A., Mu, X., Wang, F., Gao, P., & Sun, W. (2015). Sediment yield estimation in a small watershed on the northern Loess Plateau, China. Geomorphology, 241, 343- 352.
- Castillo, V. M., Mosch, W. M., García, C. C., Barberá, G. G., Cano, J. N., & López-Bermúdez, F. (2007). Effectiveness and geomorphological impacts of check dams for soil erosion control in a semiarid Mediterranean catchment: El Cárcavo (Murcia, Spain). Catena, 70(3), 416-427.
- Vanacker, V., Bellin, N., Molina, A., & Kubik, P. W. (2014). Erosion regulation as a function of human disturbances to vegetation cover: a conceptual model. Landscape ecology, 29(2), 293-309.
- Polyakov, V. O., Nichols, M. H., McClaran, M. P., & Nearing,M. A. (2014). Effect of check dams on runoff, sediment yield, and retention on small semiarid watersheds. Journal of soil and water conservation, 69(5), 414-421.
- Quiñonero-Rubio, J. M., Nadeu, E., Boix-Fayos, C., & de Vente, J. (2016). Evaluation of the effectiveness of forest restoration and check-dams to reduce catchment sediment yield. Land Degradation & Development, 27(4), 1018-1031.
- Castillo, C., Pérez, R., & Gómez, J. A. (2013). A conceptual model of check dam hydraulics for gully control. Hydrology & Earth System Sciences Discussions, 10(9).
- Boix-Fayos, C., de Vente, J., Martínez-Mena, M., Barberá,G. G., & Castillo, V. (2008). The impact of land use change and check-dams on catchment sediment yield. Hydrological Processes: An International Journal, 22(25), 4922-4935.
- Ramos-Diez, I., Navarro-Hevia, J., Fernández, R. S. M., Díaz-Gutiérrez, V., & Mongil-Manso, J. (2017). Evaluating methods to quantify sediment volumes trapped behind check dams, Saldaña badlands (Spain). International Journal of Sediment Research, 32(1), 1-11.
- Jahantigh, M. (2017). Study effect of watershed management on sediment control in dryland region (Case study Taftan basin).
- Jahantigh M (2015) Impacts of Runoff and Sediment Control Mechanical Structures on Runoff Supply in Taftan Catchments, Soil conservation and watershed management institute, 72.
- Sougnez, N., van Wesemael, B., & Vanacker, V. (2011). Low erosion rates measured for steep, sparsely vegetated catchments in southeast Spain. Catena, 84(1-2), 1-11.
- Romero-Díaz, A., Alonso-Sarriá, F., & Martínez-Lloris, M. (2007). Erosion rates obtained from check-dam sedimentation (SE Spain). A multi-method comparison. Catena, 71(1), 172- 178.
- Díaz, V., Mongil, J., & Navarro, J. (2014). Proposal of a new methodology to assess the effectiveness of check-dams. Cuad Invest Geog, 40, 169-190.
- Bellin, N., Vanacker, V., van Wesemael, B., Solé-Benet, A., & Bakker, M. M. (2011). Natural and anthropogenic controls on soil erosion in the Internal Betic Cordillera (southeast Spain). Catena, 87(2), 190-200.
- Díaz, V., Mongil, J., & Navarro, J. (2014). Topographical surveying for improved assessment of sediment retention in check dams applied to a Mediterranean badlands restoration site (Central Spain). Journal of Soils and Sediments, 14(12), 2045-2056.
- Brown, C. B. (1943). Discussion of" Sedimentation in reservoirs". In Proc. ASCE (Vol. 69, No. 6).
- Lenth R (2023) emmeans : Estimated Marginal Means, aka Least-Squares Means_. R package version 1.9.0.
- Maechler, M. (2018). Cluster: cluster analysis basics and extensions. R package version 2.0. 7–1.
- Wickham, H. (2016). Data analysis. In ggplot2: elegant graphics for data analysis (pp. 189-201). Cham: Springer international publishing.
- Jahantigh, M., & Jahantigh, M. (2020). Investigating of land use change effect on some soil physical-chemistry characteristics and Erosion in arid areas (case study: Hirmand of sistan). Environmental Erosion Research Journal, 9(4), 92- 118.
- Ramos-Diez, I., Navarro-Hevia, J., Fernández, R. S. M., Díaz- Gutiérrez, V., & Mongil-Manso, J. (2016). Geometric models for measuring sediment wedge volume in retention check dams. Water and Environment Journal, 30(1-2), 119-127.
- Ramos, I., Navarro, J., Bartolomé, D., Díaz, V., Mongil, J. (2013). Sediment and erosion control in the hydrological and forest restoration of Saldaña (Palencia). Proceedings of the VI Spanish forest congress. In J Sedi Rese 32(1):1-11.
- Bombino, G., Barbaro, G., D’Agostino, D., Denisi, P., Labate, A., & Zimbone, S. M. (2022). A method for estimating stored sediment volumes by check dam systems at the watershed level: example of an application in a Mediterranean environment.Journal of Soils and Sediments, 22(4), 1329-1343.
- Huang, J., Hinokidani, O., Yasuda, H., Ojha, C. S., Kajikawa, Y., & Li, S. (2013). Effects of the check dam system on water redistribution in the Chinese Loess Plateau. Journal of Hydrologic Engineering, 18(8), 929-940.
- Martín-Moreno, C., Hijano, C. F., Duque, J. M., Martín, J. G., Alonso, I. Z., & Laronne, J. B. (2014). The Ribagorda sand gully (east-central Spain): Sediment yield and human-induced origin. Geomorphology, 224, 122-138.