

Archives of Epidemiology & Public Health Research(AEPHR)
ISSN: 2833-4353 | DOI: 10.33140/AEPHR
Impact Factor: 1.98


Research Article - (2022) Volume 1, Issue 2
Anxiety, Depression, and Stress among Female Community Health Volunteers during COVID-19 Pandemic in Province 1, Nepal
2Instructor, Adult Health Department, Tribhuvan University Institute of Medicine Biratnagar Nursing C, Nepal
Received Date: Nov 09, 2022 / Accepted Date: Nov 30, 2022 / Published Date: Dec 10, 2022
Copyright: ©Saraswati Basnet. This is an open-access article distributed under the terms of the Creative Commons Attribution License, which permits unrestricted use, distribution, and reproduction in any medium, provided the original author and source are credited.
Citation: Saraswati Basnet and Suveckshya Silwal (2022). Anxiety, Depression, and Stress among Female Community Health Volunteers during COVID-19 Pandemic in Province 1, Nepal. Arch Epidemiol Pub Health Res, 1(2), 84-96.
Abstract
Introduction: Female Community Health Volunteers (FCHVs) are an integral part of various community-based health programs visiting households and communities to screen for diseases, risk factors and educate on basic health issues. A profound and wide range of psychological health issues (anxiety, stress, and depression) at the individual, community, and international levels has been reported during the COVID-19 outbreaks. Methods: An analytical cross-sectional study design was used to assess the anxiety, depression, and stress level among rural and urban FCHVs during the COVID-19 in Province 1. A multistage random sampling technique was be used the select the sample. The total sample size was 384. Semi-structured structured valid Depression, Anxiety and Stress Scale (DASS-21) was used for measuring the Depression, Anxiety, and Stress level of FCHVs. Descriptive analysis i.e. frequency, percentage, mean, median, and standard deviation was used to assess the level of anxiety, depression, and stress among adults. Inferential analysis i.e. logistic regression was used to find the association between dependent and selected demographic variables. Findings: The study revealed that the prevalence of extremely severe levels of anxiety was 35.5 % of the Female Community Health Volunteers (FCHVs) 23.4% of moderate level of stress and 21.6% of respondents were a severe level of depression respectively. There is significant association between level anxiety and ethnicity (p=0.040; OR=1.562; CI=1.021-2.390), occupation (p=0.013; OR=3.861; CI=1.325-11.249) and place of residence (p≤ 0.001; OR=1.959; CI=1.470-3.413). There is significant association between level stress and occupation (p=0.037; OR=3.363; CI=1.074-10.531) place of residence (p=0. 005; OR=1.817; CI=1.193-2.767). There is significant association between level depression and ethnicity, occupation (p≤0.001; OR=2.117; OR=1.391-3.222) and place of residence (p=0. 026; OR=3.371; CI=1.158-9.812). The study concluded that the female community Health Volunteers was mild, moderate, severe and extremely severe level of anxiety, stress and depression level so prompt psychiatric intervention to enhance the mental wellbeing of FCHVs.
Keywords
Anxiety, Stress and Depression, Female Community Health Volunteer, Logistic Regression.
Introduction
Female Community Health Volunteers (FCHVs) are the pillars of community health programs in Nepal. Being healthcare represen-tatives in community settings, they play a crucial role to prevent and control the COVID-19 pandemic by educating the community on social distancing principles, hand hygiene, and safety measures. However, due to overburden of large coverage area, technical in¬competence in different aspects of health, inadequate knowledge, sometimes lack of family support, fewer competencies in digital reporting, and limited access to mass media, they may face vari¬ous forms of imputation, isolation, and can be socially blackballed in the community [1, 2]. In South Africa, the important role of Community Health Workers (CHWs) during this pandemic has been highlighted by improving COVID-19 health education and early screening [3, 4]. Over 1 million COVID-19 screening ac-tivities were conducted over 9 months in the study district con-cluded they are means to provide equitable, affordable access to quality basic health services directly to the community [5]. Low and Middle-Income Countries (LMICs) are increasingly strength-ening their CHW programs, for attaining the purpose of universal health coverage, as an affordable and critical intervention [6, 7]. Furthermore, the study conducted among 1139 Health Care Work¬ers (HCWs) working in Oman finding shows that nearly 32.3% of them had depression, 34.1% had anxiety, 23.8% had stress and 18.5% had insomnia respectively. HCWs working in the frontline group were 1.5 times more likely to report anxiety and insomnia as compared with those in the non-frontline group. HCWs had higher hopelessness and anxiety levels than non-HCWS [8].
In Nepal, the network of Female Community Health Volunteers created in 1988 provides support for maternal and child health through the sharing of information and collaboration with local health services and plays a vital role in the healthcare system. [9] In fiscal year 1988/89, the Government of Nepal (GoN) initiated this program in 27 districts by selecting one Female Community Health Volunteer per ward regardless of the population size, and later in 1993/94, a population-based approach was introduced in selected 28 districts. Then the program was established in all 75 districts by 1995. Altogether there are 51,416 FCHVs in the coun-try (46,088 FCHVs at rural/Rural Municipality level and 5,328 at urban/municipality level). The major roles of the FCHV are the linkage between the health facility and the community and pro-viding referral services, especially for Maternal and Child Health (MCH) services, Community Based- Integrated Management of Neonatal and Childhood Illness (CB-IMNCI) services [10]. FCH-Vs make door-to-door visits and counsel parents about getting their children vaccinated. During the earthquake in Nepal, they were on the front lines, providing psychological support to prevent post-traumatic stress disorder in victims [11]. GoN has acknowl-edged that the FCHVs have contributed significantly to achieving the milestones of Nepal's Millennium Development Goals 4 and 5 by providing basic health services to women and children in the community. They counsel mothers, dispense health commodities such as zinc, ORS, pills, or condoms, and refer to health centers by screening [13]. The benefits to community women from the female volunteers’ work were significant; as a result pregnant women and mothers from the poorest communities were aware of existing healthcare services and would visit health centers [12]. FCHVs being the first contact health workers in the community faced anxi¬ety and stress during the COVID-19 pandemic in Nepal because of their limited activities, resources, and training to handle immediate outbreak response [14].
FCHVs play a crucial role and key team members of COVID-19 prevention group which is accountable for prevention and control of COVID 19 at ward level. FCHVs have numerous qualities for mobilize their communities, they have been successful in building trust and rapport with the people in their respective areas; available 24 hours and can be mobilized immediately. [2]
Materials and Methods
Data was collected using Standard Valid Depression, Anxiety and Stress Scale (DASS-21) was used as the research instruments.
Ethical approval: Ethical clearance for the study was obtained from the Ethical Review Board of Nepal Health Research Council (Ref. No-1135/22 November, 202I), and written informed consent was obtained from each of the participants. The consent was docu¬mented from each respondent before the initiation of the response. Before data collection, all the participants were informed about the aims, objectives, and background of the study. Likewise, they were also informed regarding the risks and benefits of the study. Only those willing to participate and those providing informed consent were included in the study. Participants had the right to withdraw from the study at any point, if they so wish, without any negative repercussions. Confidentiality of the participant was maintained throughout the study and after data collection.
Study design: A quantitative analytical cross-sectional study was used to assess the anxiety, depression, and stress level among rural and urban female community health volunteers during the COVID-19 in Province No 1.
Study Setting and Population: The setting of the study was all wards of selected rural and urban municipalities of Province 1. Province no. 1 is divided into 14 districts and then those districts are subdivided into Municipalities. There is one metropolitan city i.e. Biratnagar, two sub-metropolitan cities i.e. Itahari and Dharan. Altogether, there are 46 municipalities and 88 rural municipalities [16]. The population of Province No. 1 is 4,534,943 among which total FCHVs is 51470 (including 47,328 FCHVs at rural/ VDC level 4142 at urban/municipality) in Nepal [17]. The study pop¬ulation was recruited from all FCHVs of selected rural and urban municipalities of Province No 1.
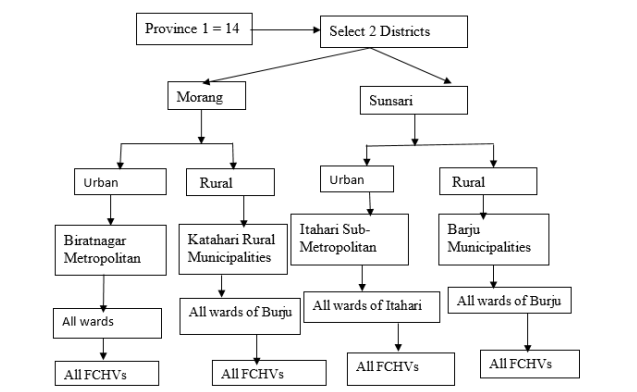
Study Population: The study population was all the FCHVs of one Metropolitan, one sub-metropolitan, and two rural municipalities (Biratnagar Metropolitan, Budiganga rural municipality of Morag district, and Itahari Sub metropolitan and Barju rural municipality of Sunsari district). The age of the study population was 20 to 60 years of FCHVs of Morang and Sunsari districts of Province No 1.
Sampling technique and sample size: For this study, a multistage random sampling technique was used for the selection of the sam¬ple. At the first stage, a total of two districts were selected by using a simple random technique among the 14 districts of Province No. 1. At the second stage, two municipalities (one urban and one ru¬ral) were selected from each district via a simple random sampling (lottery) method. However, the administrative and ethical clear¬ance purpose of the NHRC, lottery method has been conducted among 14 districts of province 1 where Morang and Sunsari had been withdrawn. In Morang district altogether there are 17 munic¬ipalities (1 metropolitan, 8 urban municipalities, and 8 rural mu¬nicipalities). Similarly in Sunsari district altogether there are 12 municipalities (two sub metropolitans’ four urban municipalities and six rural municipalities). Among 17 municipalities Biratnagar metropolitan as urban and Budiganga as the rural municipality had been selected by simple random method from the Morang district. Likewise, Sunsari district Itahari sub-municipality as urban and Barju as rural municipalities was selected by simple random (lot¬tery method) technique among 12 municipalities from Sunsari dis¬tricts. Total FCHVs were selected by the census method from these four municipalities.
Criteria for sample selection: first setting of the sample (Metro¬politan, sub-metropolitan, and two rural municipalities) was se¬lected with the bottleneck rotation method which is neck pointed direction was selected first then done accordingly. But the sample (FCHVs) was selected for the census method. Inclusion Criteria were those all-female community health volunteers present who were available at the time of data collection and were willing to participate in the study. Exclusion Criteria was the participants di¬agnosed with any kind of mental illness: depression, anxiety, and other psychological problems.
Sampling Frame
Sample Size: The sample size was calculated based on Cochrane’s formula.
I.e. Sample size (n) = z2pq/d2
z = 1.96 at 95% Confidence Level
p = 42%= 0.42 (prevalence=41.9%~42%, obtained from the study on prevalence of mental health impacts among health workers during COVID-19 in a low resource setting: a cross-sectional sur¬vey from Nepal [29].
q = 1-p = 1- 0.42= 0.58
d = allowable error (5% = 0.05)
Then, after calculation, the sample size was 412 after adding 10% non-response but available total respondents were only 384 during data collection.
Instrumentation: A structured interview schedule was developed by researchers based on the objectives of the study. The study in¬strument was divided into two parts: Part 1: Socio-Demographic information of the participant Part 2: Questions related to inter¬personal factors (social support system, social network, family, friendship, workgroup network) and organization factors (Pol-icy-rules & regulation, Workplace, climate) of the participants. Part 3: Standard Valid Depression, Anxiety and Stress Scale (DASS 21). The instrument was translated in Nepali with the help of bilingual experts and as well as the back translation was done. Pretesting of the instrument was done among 10% (i.e. 41, where n=412) among FCHVs of Jhapa district for any clarity and modi¬fication in the research tool [19].
Table 1: The Recommended Cut-Off Scores for Conventional Severity Levels (Normal, Moderate, Severe) Are as Follows.
|
Severity Level |
Depression |
Anxiety |
Stress |
|
Normal |
0-9 |
0-7 |
0-14 |
|
Mild |
10-13 |
8-9 |
15-18 |
|
Moderate |
14-20 |
10-14 |
19-25 |
|
Severe |
21-27 |
15-19 |
26-33 |
|
Extremely Severe |
28+ |
20+ |
34+ |
|
Note: Total Scores need to be multiplied by 2 to calculate the final score |
|||
Validity and reliability of tool: The tool consists of three-part, part I consist of socio-demographical portion, part II consists of interpersonal factors of FCHVs, and part III consists of standard valid Depression, Anxiety and Stress Scale (DASS 21) was adopt-ed which is developed by Lovibond & Lovibond. [19] It is used in various settings and various researchers in the world as well as Ne-pal too. The tool further consultation with research experts too for maintaining validity. The English version of the tool was translated into Nepali version by bilinguistic experts. The team researchers assess each item of the instruments along with all study variables for its relevancy by using the evaluation method via pretesting of the instruments and interview to measure the anxiety, depression, and stress level of the FCHVs. Each item of the tool measures the same theoretical construct asset objective of the study. The con¬tent validity was maintained by consultation with subject experts. For maintaining consistency, the principal researcher herself was engaged in data collection and monitoring, data entry, editing, and processing and analysis procedure.
Data Collection Procedure: Data Collection Technique Data was collected via face-to-face interviews using a structured interview schedule for about one and half months (30th November to 30th December 2021). Each participant has explained the nature and purpose of the study. Safety precautions were maintained (physi-cal distancing, using mask and sanitizer) before an interview. In-formed consent (both verbal & written) was taken before perform-ing the interview. The time duration for each interview was about 15-20 minutes. Collected data was checked for its completeness and editing was done on the same day to prevent recall bias, ensure the quality & accuracy of the study.
Data Analysis Procedure: Collected data was checked daily for its completeness. All the data was kept for editing and coding. At first data entry was done in MS-excel followed by using the computer Statistical Package for the Social Sciences (SPSS) ver-sion 20.00. Descriptive analysis i.e. frequency, percentage, mean, median, and standard deviation was used to assess anxiety stress and depression level of the Female community health Volunteer of province one. Inferential analysis i.e. logistic regression was used to find the association between dependent and selected de-mographic variables p-value of ÃÃÂ???0.05 was considered to indicate statistical significance at a 95% confidence level. Analyzed data was presented in the relevant tabular form.
Results
Table 2: Socio-Demographic Characteristics of The Respondents n=384
|
Variable |
frequency (f) |
Percentage (%) |
|
Age |
||
|
20 to 40 years |
84 |
21.9 |
|
41 to 60 years |
277 |
72.1 |
|
>60 |
23 |
6.0 |
|
Mean±SD |
47.51±9.28 |
|
|
Sex |
||
|
Male |
1 |
0.3 |
|
Female |
383 |
99.7 |
|
Ethnicity |
||
|
Brahmin/Chhetri |
152 |
39.6 |
|
Janajati |
34 |
8.9 |
|
Madeshi |
174 |
45.3 |
|
Muslim |
14 |
3.6 |
|
Dalit |
10 |
2.6 |
|
Religion |
||
|
Hindu |
366 |
95.3 |
|
Buddhist |
2 |
0.5 |
|
Muslim |
14 |
3.6 |
|
Christian |
2 |
0.5 |
|
Education |
||
|
Literate only |
106 |
27.6 |
|
Primary |
48 |
12.5 |
|
Secondary |
104 |
27.1 |
|
SLC |
108 |
28.1 |
|
Bachelor and above |
18 |
4.7 |
|
Occupation |
||
|
FCHVs with Service |
9 |
2.3 |
|
FCHVs with Business |
10 |
2.6 |
|
only FCHVs |
365 |
95.1 |
|
Type of Family |
||
|
Nuclear |
255 |
66.5 |
|
Joint |
129 |
33.5 |
|
Marital status |
||
|
Married |
381 |
99.2 |
|
Unmarried |
3 |
0.8 |
|
Personal habit |
||
|
Relax |
381 |
99.2 |
|
Tense |
3 |
0.8 |
|
Place of Residence |
||
|
Urban |
200 |
58.1 |
|
Rural |
184 |
47.9 |
Table 2 showed that nearly third-fourth (72.1%) of respondents were aged 40 to 60 years of age and 21.9% of respondents were aged 20 to 40 years. The mean age was 47.5 years whereas only 6.0% of respondents were aged above 60 years. Almost of the (99.7%) respondents were Female whereas only 0.3 % was male. Less than half (45.3%) of the respondents were Madhesi and more than one-third (39.6%) of respondents were Brahmin and Chhetri. Only 2.6% of Respondents were Dalit. Most of them (95.3%) of respondents were Hindu whereas 0.5% of respondents were Bud¬dhist and Christian. More than one-fourth (28.1%) of the respon-dent’s education level was SLC whereas only 4.7% of respondents' education level was Bachelor and above. almost (95.1%) of the respondent's occupations were only FCHVs whereas only 2.3% of the respondents were FCHVs with did service. Two-thirds (66.4%) of the respondents had nuclear families whereas only 33.5% had a joint family. Similarly, almost of the respondents were married whereas 0.8 % were unmarried.
Table 2 B: Socio-Demographic Characteristics of Respondents n=38
|
Variable |
frequency (f) |
Percentage (%) |
|
Personal habit |
||
|
Relax |
381 |
99. |
|
Tense |
3 |
0.8 |
|
Social network |
||
|
Use properly |
371 |
96.6 |
|
Not use properly |
13 |
3.4 |
|
Family support |
||
|
Supportive |
377 |
98.2 |
|
Not supportive |
7 |
1.8 |
|
Workplace Climate |
||
|
Favorable |
380 |
99.0 |
|
Unfavorable |
4 |
1.0 |
|
working environment |
||
|
Supportive |
373 |
97.1 |
|
Unsupportive |
11 |
2.9 |
|
Policy |
||
|
Favorable |
381 |
99.2 |
|
Unfavorable |
3 |
0.8 |
Table 2 revealed that almost (99.2%) of respondents were looked relaxed whereas only 0.8% of respondents were looked tense. Similarly, most of (96.6%) the respondents had a proper social network. Likewise, almost (98.2%) of the respondents had sup¬portive families whereas only 1.8% of the respondent’s families had unsupportive. Almost (99.0%) of the respondents had favor¬able working environments whereas only 2.9% of respondents had unfavorable working environments. Similarly, almost (99.2 %) of respondents had expressed unfavorable policy for them whereas only 0.8% of respondents had expressed unfavorable policy for them.
Table 3: Respondent’s response on different variables of Depression Anxiety Stress
|
Variable |
Did not apply to me at all (f) % |
Apply to me some degree (f) % |
Apply to me considerable degree (f) % |
Apply to me very much (f) % |
|
I found it hard to wind wound |
147 (38.3) |
197 (51.3) |
21 (5.5) |
19 (4.9) |
|
It was aware of dryness of mouth |
167 (43.5) |
172 (44.8) |
27 (7.0) |
18 (4.7) |
|
I couldn’t seem to experience any positive feeling at all |
190 (49.5) |
144 (37.5) |
30 (7.8) |
20 (5.2) |
|
I experienced breathing difficulty |
201(52.3) |
138 (35.9) |
29 (7.6) |
16 (4.2) |
|
I found it difficult to work up the initiative to do things |
200 (52.1) |
139 (36.2) |
27 (7.0) |
18 (4.7) |
|
I tended to over-react to situations |
199 (51.8) |
138 (35.9) |
27 (7.0) |
20 (5.2) |
|
I experienced trembling (e.g. in the hands) |
207 (53.9) |
133 (34.6) |
28 (7.3) |
16 (4.2) |
|
I felt that I was using a lot of nervous energy |
206 (53.6) |
129 (33.6) |
29 (7.6) |
20(5.2) |
|
I was worried about situations in which I might panic and make a fool of myself |
201 (52.3) |
132 (34.4) |
34 (8.9) |
17 (4.4) |
|
I felt that I had nothing to look forward to |
210 (54.7) |
131 (34.1) |
24 (6.3) |
19 (4.9) |
|
I found myself getting agitated |
210 (54.7 |
132 (34.4) |
23 (6.0) |
19 (4.9) |
|
I found it difficult to relax |
218 (56.8) |
122 (31.8) |
25 (6.5) |
19 (4.9) |
|
I felt down-hearted and blue |
208 (54.2) |
129 (33.6) |
28 (7.3) |
19 (4.9) |
|
I was intolerant of anything that kept me from getting on with what I was doing |
210 (54.7) |
122 (31.8) |
32 (8.3) |
20 (5.2) |
|
I felt I was close to panic |
213 (55.5) |
123 (32.0) |
33 (8.6) |
15 (3.9) |
|
I was unable to become enthusiastic about anything |
213 (55.5) |
125 (32.6) |
30 (7.8) |
16 (4.2) |
|
I felt I wasn’t worth much as a person |
220 (57.3) |
121 (31.5) |
26 (6.8) |
17 (4.4) |
|
I felt that I was rather touchy |
210 (54.7) |
126 (32.8) |
31 (8.1) |
17 (4.4) |
|
I was aware of the action of my heart in the absence of physical exertion |
219 (57.0) |
121 (31.5) |
26 (6.8) |
18 (4.7) |
|
I felt scared without any good reason |
217 (56.5) |
127 (33.1) |
23 (6.0) |
17 (4.4) |
|
I felt that life was meaningless |
218 (56.8) |
123 (32.0) |
24 (6.3) |
19 (4.9) |
Table 3 illustrated that in terms of, I found it hard to wind wound, more than half (51.3%) of respondents agree to apply to me some degree whereas more than one-third (38.3%) of respondents were agreed to apply to did not apply to me at all. in terms of, it was aware of dryness of mouth, less than half of respondents (44.8%) were agreed with applying to me some degree whereas (4.7%) of respondents were agreed with applying to me very much. Simi¬larly, in terms of, I couldn’t seem to experience any positive feel¬ing at all, nearly half of the respondents (49.5%) agreed that did not apply to me at all whereas only (5.2%) of respondents agreed that apply to me very much. In terms of, I experienced breathing difficulty, more than (51.8%) of respondents agreed that did not apply to me at all whereas only 4.2% of respondents agreed with applying to me very much. In terms of, I found it difficult to work up the initiative to do things more than half (52.1%) of respondents agreed that did not apply to me at all-in terms of, I experienced trembling (e.g. in the hands) more than half (53.9%) of the respon-dents agreed that did not apply to me at all whereas only 7.3% of respondents were agreed with applying to me a considerable degree. In terms of, I felt that I was using a lot of nervous ener- gy, more than half (53.6%) of the respondents agreed that did not apply to me at all whereas only 5.2% of respondents were agreed with applying to me very much. In terms of, I was worried about situations in which I might panic and make a fool of me, 52.3% of the respondents agreed that did not apply to me at all whereas only 4.4% were agreed with applying to me very much. In terms of, I felt that I had nothing to look forward to 54.7% of the respondents agreed that did not apply to me at all whereas only 4.9% were agreed with applying to me very much. In terms of, I found myself getting agitated, more than half (54.7%) of the respondents agreed that did not apply to me at all whereas only 4.9% were agreed with applying to me very much. In terms of, I found it difficult to relax, 56.8% of the respondents agreed that did not apply to me at all whereas only 6.5% were agreed with applying to me a consid-erable degree. In terms of, I felt down-hearted and blue, 54.2% of the respondents agreed that did not apply to me at all whereas only 7.3% were agreed with applying to me a considerable degree. In terms of, I was intolerant of anything that kept me from getting on with what I was doing, 54.7% of the respondents agreed that did not apply to me at all whereas only 8.3% were agreed with apply- ing to me a considerable degree. In terms of, I felt I was close to panic, 55.5% of the respondents agreed that did not apply to me at all whereas only 8.6% were agreed with applying to me a con-siderable degree. In terms of, I was unable to become enthusiastic about anything, 55.5% of the respondents agreed that did not apply to me at all whereas only 7.8% were agreed with applying to me a considerable degree. In terms of, I felt I wasn’t worth much as a person, 57.3% of the respondents agreed that did not apply to me at all whereas only 6.8% were agreed with applying to me a consid¬erable degree. In terms of, I felt that I was rather touchy, 54.7% of the respondents agreed that did not apply to me at all whereas only 8.1% were agreed with applying to me the considerable degree. In terms of, I was aware of the action of my heart in the absence of physical exertion, 57.0% of the respondents agreed that did not apply to me at all whereas only 6.8% were agreed with applying to me a considerable degree. In terms of, I felt scared without any good reason, 56.5% of the respondents agreed that did not apply to me at all whereas only 6.0% were agreed with applying to me a considerable degree. In terms of, I felt that life was meaningless, 56.8% of the respondents agreed that did not apply to me at all whereas only 6.3% were agreed with applying to me for a consid¬erable degree.
Table 4: Prevalence of level of Depression Anxiety Stress of respondents n=384
|
Variable |
frequency (f) |
Percentage (%) |
|
Level of Anxiety |
||
|
Normal |
194 |
50.5 |
|
Mild |
8 |
2.1 |
|
Moderate anxiety |
23 |
6.0 |
|
Severe anxiety |
23 |
6.6 |
|
Extremely Severe |
136 |
6.6 |
|
Level of Stress |
||
|
Normal |
226 |
58.9 |
|
Mild |
18 |
4.7 |
|
Moderate Stress |
90 |
23.4 |
|
Severe stress |
6 |
1.6 |
|
Extremely Severe |
44 |
11.4 |
|
Level of Depression |
||
|
Normal |
204 |
53.1 |
|
Mild |
20 |
5.2 |
|
Moderate depression |
29 |
7.6 |
|
Severe depression |
83 |
21.6 |
|
Extremely Severe |
48 |
12.5 |
Table 4 showed that half (50.5 %) of respondents had no anxiety and the prevalence of extremely severe levels of anxiety was 35.5 % of the respondent (FCHVs) whereas only 6.0% of respondents were moderate anxiety. Likewise, the prevalence of stress was 23.4% of moderate level of stress and 1.6 were the severe level of stress of respondents. Similarly, the prevalence of depression was 21.6% of respondents were a severe level of depression whereas only 7.6% of respondents had a moderate level of depression.
Table 5: Association between anxiety and selected demographic variables (Bivariate analysis) n=384
|
Variable |
Level of Anxiety |
Unadjusted OR |
CI |
p-Value |
|
|
Normal |
Anxiety |
||||
|
Age |
|||||
|
20 to 40 years |
40 |
44 |
0.862 |
0.531-1.399 |
0.547 |
|
41 to 60 year |
154 |
146 |
|
|
|
|
Ethnicity |
|||||
|
Bramin/ Chhetri |
85 |
67 |
0.699 |
0.463-1.054 |
0.087 |
|
Other castes |
109 |
123 |
|
|
|
|
Religion |
|||||
|
Hindu |
|
|
1.022 |
0.397-2.633 |
0.964 |
|
Others |
|
|
|
|
|
|
Occupation |
|||||
|
Service & FCHVs |
14 |
5 |
2.878 |
1.016-8.154 |
0.047 * |
|
Business & FCH-Vs |
180 |
185 |
|
|
|
|
Types of Family |
|||||
|
Nuclear |
128 |
127 |
0.962 |
0.630-1.470 |
0.858 |
|
Joint |
66 |
63 |
|
|
|
|
Marital Status |
|||||
|
Married |
193 |
188 |
0. .962 |
0. .630-1.470 |
0. 858 |
|
Unmarried |
1 |
2 |
|
|
|
|
Social network |
|||||
|
Good |
187 |
184 |
2.595 |
0.497-13.540 |
0.258 |
|
Bad |
7 |
6 |
|
|
|
|
Place of Residence |
|||||
|
Urban |
117 |
83 |
1.959 |
1.305-2.940 |
0.001 * |
|
Rural |
77 |
107 |
|
|
|
|
Co-morbidities |
|||||
|
Yes |
145 |
137 |
1.020 |
0.956-1.088 |
0.559 |
|
No |
49 |
53 |
|
|
|
Table 5 revealed that association between anxiety and selected de-mographic variable. There is significant association between anxi-ety and occupation of (p=0.047; OR=2.878; CI=1.016-8.154) and place of residence (p=0.001; OR=1.959; CI=1.305-2.940). The anxiety level is increased 2.878 times more in service with FCHVs then business with FCHVs and others. Likewise the FCHVs who lived in urban area are 1.959 times more chance to develop stress then FCHVs who lived in rural area. Similarly there is no asso-ciation between age (p=0.547; OR=0.862; CI=0.531-1.399); eth¬nicity (p=0.087; OR=0.699; CI=0.463--1.054); religion (p=0.964; OR=0.1.022; CI=0.397-2.633) ; types of family (p=0.858; OR=0.962; CI=0.630-1.470); marital status (p=0.258; OR=2.595; CI=0.497-13.540); social network (p=0.559; OR=1.020; CI=0.956- 1.088) and co-morbidities.
Table 6: Association between Stress and selected demographic variables (Bivariate analysis) n=384
|
Variable |
Level of Stress |
Unadjusted OR |
CI |
p-Value |
|
|
no stress |
stress |
||||
|
Age |
|||||
|
20 to 40 years |
47 |
37 |
0.859 |
0.527-1.400 |
0.541 |
|
41 to 60 year |
179 |
121 |
|
|
|
|
Ethnicity |
|||||
|
Brahmin/Chhetri |
97 |
55 |
1.408 |
0.925-2.143 |
0.110 |
|
Other castes |
129 |
103 |
|
|
|
|
Religion |
|||||
|
Hindu |
217 |
149 |
1.456 |
0.565-3.755 |
0.437 |
|
Others |
9 |
9 |
|
|
|
|
Education |
|||||
|
below SLC |
95 |
118 |
1.104 |
0.940-1.297 |
0.229 |
|
Above SLC |
59 |
94 |
|
|
|
|
Occupation |
|||||
|
Service & FCHVs |
15 |
4 |
2.737 |
0.891-8.408 |
0.079 |
|
Business & FCHVs |
211 |
154 |
|
|
|
|
Types of Family |
|||||
|
Nuclear |
149 |
106 |
0.949 |
0.617-1.461 |
0.813 |
|
Joint |
77 |
52 |
|
|
|
|
Marital Status |
|||||
|
Married |
224 |
157 |
0.713 |
0.064-7.936 |
0.783 |
|
Unmarried |
2 |
1 |
|
|
|
|
Social network |
|||||
|
Good |
220 |
157 |
0.891 |
.286-2.774 |
0.841 |
|
Bad |
6 |
1 |
|
|
|
|
Place of Residents |
|||||
|
Urban |
117 |
83 |
1.630 |
1.082-2.454 |
0.019 * |
|
Rural |
77 |
107 |
|
|
|
|
Co-morbidities |
|||||
|
Yes |
164 |
123 |
0.960 |
0.897-1.028 |
0.242 |
|
No |
62 |
35 |
|
|
|
Table 6 revealed that association between stress and selected de-mographic variable. There is association between stress and place of residence (p=0.541; OR=0.859; CI=1.082-2.454). Likewise, the FCHVs who lived in urban area are 1.630 times more chance to develop stress then FCHVs who lived in rural area. There is no sig¬nificant association between stress and age (p=0.541; OR=0.859; CI=0.527-1.400); ethnicity (p=0.019; OR=1.408; CI=0.9252.143); religion (p=0.437; OR=0.1.456; CI=0.565-3.755); education (p=0.229; OR=1.630 ; CI= 0.940-1.297); occupation (p= 0.079; OR=2.737; CI= 0.891-8.408); types of family (p=0.813; OR=0.949; CI=0.617-1.461); marital status (p=0.783; OR=0.713; CI=0.0647- 7.936); social network (p=0.841; OR=0.891; CI=0.286-2.774) and co-morbidities (p=0.242; OR=0.960; CI=0.897-1.028).
Table 7: Association between Depression and selected demographic variables (Bivariate analysis) n=384
|
Variable |
Level of Depression |
Unadjusted OR |
CI |
p-Value |
|
|
Non Depressive |
Depressive |
||||
|
Age |
|||||
|
20 to 40 years |
44 |
40 |
963 |
0.593-1.563 |
0.877 |
|
41 to 60 year |
160 |
140 |
|
|
|
|
Ethnicity |
|||||
|
Brahmin/ Chhetra |
62 |
90 |
1.503 |
1.503-2.272 |
0.054 |
|
Janajati & others |
114 |
118 |
|
|
|
|
Religion |
|||||
|
Hindu |
195 |
171 |
1.140 |
0.443-2.938 |
0.786 |
|
Buddhist |
9 |
9 |
|
|
|
|
Level of Education |
|||||
|
Below SLC |
194 |
172 |
.975 |
.768-1.237 |
.832 |
|
SLC and Above |
10 |
8 |
|
|
|
|
Occupation |
|||||
|
FCHVs with service |
14 |
5 |
2.579 |
0.910-7.308 |
0.075 |
|
FCHVs with Business& other |
190 |
175 |
|
|
|
|
Types of Family |
|||||
|
Nuclear |
136 |
119 |
1.025 |
.671-1.567 |
0.908 |
|
Joint |
68 |
61 |
|
|
|
|
Place of Residents |
|||||
|
Urban |
121 |
79 |
1.864 |
1.242-2.797 |
0.003 * |
|
Rural |
83 |
101 |
|
|
|
|
Status of Co-morbidities |
|||||
|
Yes |
152 |
135 |
0.996 |
0.933-1.064 |
0.912 |
|
No |
52 |
45 |
|
|
|
Table 7 revealed that association between depression and select¬ed demographic variable. There is association between depression and place of residence (p=0.003; OR=1.864; CI=1.242-2.797). Likewise the FCHVs who lived in urban area are 1.864 times more chance to develop depression then FCHVs who lived in rural area. There is no significant association between depression and age (p=0.877; OR=1.140; CI=0.593-1.563); ethnicity (p=0.832; OR=1.503; CI=1.503-2.272); religion (p=0.786; OR=0.1.456; CI=0.443-2.938); education (p=0.229; OR= 0.975; CI=0.768-1.237); occupation (p=0.075; OR=2.579; CI=0.910-7.308); types of family (p=0.908; OR=1.025; CI=0.671-1.567); and co-morbid-ities (p=0.912; OR=0.996; CI=0.933-1.064).
Part IV: Multivariate analysis between depression, anxiety stress, and socio-demographic variable of FCHVs
Table 8 :Association between levels of Anxiety and Socio-demographic variables (Multivariate Analysis) n=384
|
Variables |
Unadjusted OR |
adjusted OR |
CI |
p-value |
|
Ethnicity |
||||
|
Brahmin/ Chhetri |
0.699 |
1.562 |
1.021-2.390 |
0.040 * |
|
Janajati & others * * |
(Ref) |
|
|
|
|
Occupation |
||||
|
FCHVs with service |
2.878 |
3.861 |
1.325-11.249 |
0.013 * |
|
FCHVs with businesses/others |
(Ref) |
|
|
|
|
Place of resident |
||||
|
Urban |
1.959 |
1.959 |
1.470-3.413 |
≤0.001 * |
|
Rural |
(Ref) |
|
|
|
Table 8 depicts a multivariate analysis between the anxiety and de¬mographic variable. There is significant association between level anxiety and ethnicity of FCHVs (p=0.040; OR=1.562; CI=1.021-2.390), occupation (p=0.013; OR=3.861; CI=1.325-11.249) and place of residence (p≤0.001; OR=1.959; CI=1.470-3.413). The FCHVs who are Brahmin/Chhetri is a 1.562 times more chance to develop anxiety than FCHVs who are Janajati and others. Sim¬ilarly, FCHVs who did FCHVs with service is a 3.861 times more chance to develop anxiety than FCHVs did FCHVs with Business and others. Likewise, the FCHVs who lived in urban area is 1.959 times more chance to develop stress than FCHVs who lived in the rural area.
Table 9: Association between levels of Stress and Socio-demographic variables (Multivariate analysis) n=384
|
Variables |
Unadjusted OR |
adjusted OR |
CI |
p-value |
|
Occupation |
||||
|
FCHVs with service |
1.864 |
3.363 |
1.074-10.531 |
0.037* |
|
FCHVs with Business |
(Ref) |
|
|
|
|
Place of resident |
||||
|
Urban |
2.579 |
1.817 |
1.193-2.767 |
0.005* |
|
Rural |
(Ref) |
|
|
|
Table 9 depicts a multivariate analysis between the stress and de-mographic variable. There is significant association between lev¬el stress and occupation (p=0.037; OR=3.363; CI=1.074-10.531) place of residence (p=0. 005; OR=1.817; CI=1.193-2.767). FCHVs whose occupation FCHVs with service is 3.363 times more chance to develop stress than the FCHVs who are FCHVs, business, and another profession. Similarly, the FCHVs who lived in urban area are 1.817 times more chance to develop stress than FCHVs who lived in rural areas.
Table 10: Association between levels of Depression and Socio-demographic variables (Multivariate analysis) n=384
|
Variables |
Unadjusted OR |
adjusted OR |
CI |
p-value |
|
Ethnicity |
||||
|
Bramin/Chhetri |
1.503 |
1.630 |
1.065-2.496 |
0.024 * |
|
Janajati & others |
(Ref) |
|
|
|
|
Occupation |
||||
|
FCHVs with service |
2.579 |
3.371 |
1.158-9.812 |
0.026 * |
|
FCHVs with businesses& other |
(Ref) |
|
|
|
|
Place of resident |
||||
|
Urban |
1.864 |
2.117 |
1.391-3.222 |
0.001 * |
|
Rural |
(Ref) |
|
|
|
|
* Significant association p-value < 0.05; * * Madhesi, Dalit & Muslin |
||||
Table 10 depicts a multivariate analysis between the depression and demographic variables. There is significant association between level depression and ethnicity (p=0.024; OR=1.630; CI=1.065-2.496) occupation (p=0. 026; OR=3.371; CI=1.158-9.812) and place of residence (p≤0.001; OR=2.117; OR=1.391-3.222). FCH-Vs whose ethnicity is Brahmin/Chhetri; have 1.630 times more chance to develop depression than FCHVs who are Janajati & oth¬ers. FCHVs whose occupation is FCHVs with service; have 3.371 times more chance to develop depression than FCHVs who are FCHVs, Business, and others. Similarly, FCHVs who lived in ur¬ban is 2.117 times more chance to develop depression than FCHVs who lived in rural respectively.
Discussion
This study assessed the anxiety, depression, and stress level among female community health volunteers during the COVID-19 pan-demic in Province 1. This study finding revealed that nearly third-fourth (72.1%) of respondents was aged 40 to 60 years of age whereas contradict finding by Ayalew et al argued that more than half (60.2%) were aged 26–35 years [22].
Present study finding revealed that more than one-third (35.5%) of the respondent (FCHVs) had the prevalence of extremely severe level of anxiety contradict finding a study conducted in Bangla-desh among 547 nurses found that more than half of respondents (51.8%) had the prevalence anxiety. [18] Similarly, a cross-sec¬tional study conducted in Nepal among 475 health workers similar finding revealed that less than half of the health workers (41.9%) had found symptoms of anxiety [18]. Present study findings showed that less than half (23.4%) of the respondents had mod¬erate and 11.4% had an extremely severe level of the prevalence of stress among FCHVs whereas 21.6% of FCHVs had severe and 12.5% of FCHVs had extremely severe level of depression. this finding supported by Hassannia et al. argued that the prevalence of depression was nearly one-third (32.0%); anxiety less than one-third (25.8%), and stress 14.7% (95% CI: 12.0–17.4), respectively [21]. Likewise study conducted in Nepal, finding supported that more than half (37.5%) of workers had depression symptoms third (33.9%) of workers had symptoms of insomnia [18].
Similarly, Thomas et al., mentioned that the prevalence of depres¬sion and anxiety is moderate to high-level which indicated stress response triggers a cascade producing a series of changes in hu¬man vital physiological functions such as blood pressure, respi¬ratory rate, heart rate was significantly higher [20]. Another study conducted in Nepal’s contradicting findings revealed that 5.9% had an extremely severe level of anxiety, whereas 14.5% were moderately depressed, 77.5% did not have any stress during the lockdown. [24] Gupta et al., reported that 38 % of the HCWs on COVID-19 duty in Nepal are suffering anxiety and the prevalence of depression was 8% [25].
Present study finding revealed that there is significant associa¬tion between anxiety and occupation of (p=0.047; OR=2.878; CI=1.016-8.154) and place of residence (p=0.001; OR=1.959; CI=1.305-2.940). The anxiety level is increased 2.878 times more in service with FCHVs then business with FCHVs and others. Likewise the FCHVs who lived in urban area are 1.959 times more chance to develop stress then FCHVs who lived in rural area. Similarly there is no association between age (p=0.547; OR=0.862; CI=0.531-1.399); ethnicity (p=0.087; OR=0.699; CI=0.463--1.054); religion (p=0.964; OR=0.1.022; CI=0.397-2.633) ; types of family (p=0.858; OR=0.962; CI=0.630-1.470); marital status (p=0.258; OR=2.595; CI=0.497-13.540); social net¬work (p=0.559; OR=1.020; CI=0.956-1.088) and co-morbidities whereas contradict finding suggested that there was statistically significant difference between depression and age (p=0.016), de-pression and sex (p=0.023). Also, there was a significant difference between stress and age (p=0.023), sex (p=0.0263) and education level (p=0.049) [23].
This study suggested that there is association between depression and place of residence (p=0.003; OR=1.864; CI=1.242-2.797). There is no significant association between depression and age (p=0.877; OR=1.140; CI=0.593-1.563) ;ethnicity (p=0.832; OR=1.503; CI=1.503-2.272); religion (p=0.786; OR=0.1.456; CI=0.443-2.938); education (p=0.229; OR= 0.975; CI=0.768- 1.237);the study conducted in Nepal by Silwal et al., contradict finding mentioned that there was significant association of depres-sion with education level (χ2 =6.597; p=0.01).and working unit (χ2 =8.187; p=0.004) [24].
In present study multivariate analysis suggested that there is sig-nificant association between level anxiety and ethnicity of FCH-Vs (p=0.040; OR=1.562; CI=1.021-2.390), occupation (p=0.013; OR=3.861; CI=1.325-11.249) and place of residence (p=0.000; OR=1.959; CI=1.470-3.413). The FCHVs who are Brahmin/Ch-hetri is a 1.562 times more chance to develop anxiety than FCHVs who are Janajati and others. Similarly, FCHVs who did FCHVs with service is a 3.861 times more chance to develop anxiety than FCHVs did FCHVs with Business and others. Likewise, the FCH-Vs who lived in urban areas is 1.959 times more chance to devel¬op stress than FCHVs who lived in rural areas whereas contradict finding the religion, education level, working hours, marital status, ethnicity, province of residence, and extra allowance were not sig¬nificantly associated with distress level [26].
Conclusion
The study showed the level of depression, anxiety, and stress with varying severity among participants. Nearly third-fourth of respon¬dents was aged 40 to 60 years of age. Almost all of the respondents were female. More than one-third of FCHVs were of an extremely severe level of anxiety. Likewise, less than one-third of respon¬dents had a moderate level of stress whereas only a few FCHVs were a severe level of stress. The bivariate analysis showed that there is a significant association between anxiety, occupation, and place of residence. Similarly, there is no association between age; ethnicity; religion; types of family; marital status; social network, and co-morbidities. There is an association between stress and place of residence. There is no significant association between stress and age; ethnicity; religion; education; occupation; types of family; marital status; social network and co-morbidities. There is an association between depression and place of residence. Multi variant analysis revealed that there is a significant association be¬tween level anxiety and ethnicity of FCHVs, occupation, and place of residence. There is a significant association between level stress and occupation place of residence. There is a significant associa-tion between level depression and ethnicity, occupation, and place of residence. The study concluded that the depression, anxiety, and stress levels were occurred on FCHVs range from moderate to ex- tremely severe so prompt counseling family support motivational activities could enhance the mental wellbeing of the FCHVs
Acknowledgement
We are indebted to different administrative personnels of all select¬ed areas for providing us the opportunity to carry out this research study. Similarly, we would like to thank FCHVS of Province 1 for their selfless participation and providing information about the issues without any hesitation.Ethical Approval
Ethical clearance for the study was obtained from the Ethical Re¬view Board of Nepal Health Research Council (Ref. No-1135/22 November, 202I), and written informed consent was obtained from each of the participants. The consent was documented from each respondent before the initiation of the response. Before data collec¬tion, all the participants were informed about the aims, objectives, and background of the study. Likewise, they were also informed regarding the risks and benefits of the study. Only those willing to participate and those providing informed consent were included in the study. Participants had the right to withdraw from the study at any point, if they so wish, without any negative repercussions. Confidentiality of the participant was maintained throughout the study and after data collection.Competing Interests
The authors had no competing interest of any financial and per¬sonal natureAuthors Contributions
The principal author had involved in development of background, methodology data collection, analysis, writing result and devel¬opment of manuscript. Co- author involved in data collection and help in report writing and formatting manuscript too.References
- Baloch S, Baloch MA, Zheng T, Pei X. The coronavirus disease 2019 (COVID-19) pandemic. Tohoku J Exp Med. 2020;250(4):271–8.
- Parajuli SB, Shrestha S, Sah A, Heera KC, Amgain K, Pyak-urel P. Role of female community health volunteers for prevention and control of COVID-19 in Nepal. Journal of Karnali Academy of Health Sciences. 2020 May 7;3(1).
- Besada D, Daviaud E, If we invested in this today, South Africa could save billions— and fight COVID19. BHEK-ISISA Center for Health Journals [Internet]. 2021; Avail-able from https://bhekisisa.org/article/2020-05-20-com-munity-health-care-workers-in-south-africa-investment-case-covid19-coronavirus-tracing-programme/.
- McKenzie D, Swails B. South Africa’s HIV failures cost more than 300,000 lives. Now this painful past is helping in the Covid-19 fight. 2020; Available from https://edition.cnn. com/2020/04/29/africa/south-africa-hiv-coronavirus/index. html.
- Bhutta ZA, Lassi ZS, Pariyo G, Huicho L. Global experience of community health workers for delivery of health-related millennium development goals: a systematic review, country case studies, and recommendations for integration into national health systems. Glob Health Workforce Alliance. 2010;1(249):61.
- Tulenko K, Mogedal S, Afzal MM, et al. Community health workers for universal health-care coverage: from fragmentation to synergy. Geneva: World Health Organization; 2013.p. 847–52. Report No.: 91(11). https://doi.org/10.2471/ blt.13.118745.
- Cometto G, Witter S. Tackling health workforce challenges to universal health coverage: setting targets and measuring progress. Geneva: World Health Organization; 2013. p. 881–5. Report No.: 91(11). https://doi.org/10.2471/blt.13.118810.
- Alshekaili M, Hassan W, Al-Said N, Al Sulaimani F, Jay-apal SK, Al-Mawali A, Chan MF, Mahadevan S, Al-AdawiS. Factors associated with mental health outcomes across healthcare settings in Oman during COVID-19: frontline versus non-frontline healthcare workers. BMJ Open. 2020 Oct 1;10(10):e042030.
- Najafizada M, Allison J. This is the hidden problem women healthcare volunteers are facing. World Economic Forum. Retrieved from https://www.weforum.org/ agenda.
- FHD DOHS. Female Community Health Programme [Internet]. Teku, Kathmandu: Ministry of Health and population. Government of Nepal; 2021. Available from: Page 26/27 https://www.mohp.gov.np/eng/program/reproductive-mater-nal-health/female-community-healthprogramme#.
- Kandel N, Lamichhane J. Female health volunteers of Nepal: the backbone of health care. The Lancet. 2019 Feb 9; 393(10171):e19-20.
- Panday S, Bissell P, Van Teijlingen E, Simkhada P. The contribution of female community health volunteers (FCHVs) to maternity care in Nepal: A qualitative study. BMC Health Serv Res [Internet]. 2017;17(1):1–11. Available from: https:// doi.org/10.1186/s12913-017-2567-7.
- Ministry of Health and Population. Annual Report. Kathmandu, Nepal. (2013).
- Alfadhli K, Güler M, Cakal H, Drury J. The role of emergent shared identity in psychosocial support among refugees of conflict in developing countries. Int Rev Soc Psychol. 2019;32(1):1–16.
- GoN. The Constitution of Nepal 2015. Nepal Gaz [Internet]. 2015; 2015 (February):1–202. Available from: http://www.
- Nepal UN: Administrative Unit- Province State 1 Map [Internet]. Kathmandu N. 2021. Available from: https://un.info.np/ Net/NeoDocs/View/8303.
- Kathmandu N. Central Bureau of Statistics. Population (in million). 2014 Aug;33:34 – 0.
- Khanal P, Devkota N, Dahal M, Paudel K, Joshi D. Mental health impacts among health workers during COVID-19 in a low resource setting: a cross-sectional survey from Nepal. Globalization and health. 2020 Dec;16(1):1–2.
- Lovibond PF, Lovibond SH. The structure of negative emotional states: Comparison of the Depression Anxiety Stress Scales (DASS) with the Beck Depression and Anxiety Inventories. Behavior research and therapy. 1995 Mar 1;33(3):335 – 43.
- Thomas AB, Dubey SK, Samanta MK, Alex A, Jose SP. Assessment of psychological stressors of depression and anxiety using depression anxiety stress scale- 21 in South Indian healthy volunteers. Int J Pharm Pharm Sci. 2016;8(5):288–95.
- Hassannia L, Taghizadeh F, Moosazadeh M, Zarghami M, Taghizadeh H, Dooki AF, Fathi M, Navaei RA, Hedayatiza-deh-Omran A. Anxiety and depression in health workers and general population during COVID-19 epidemic in Iran: a web-based cross-sectional study. MedRxiv. 2020 Jan 1.
- Ayalew M, Deribe B, Abraham Y, Reta Y, Tadesse F, Defar S, Hoyiso D, Ashegu T. Prevalence and determinant factors of mental health problems among healthcare professionals during COVID-19 pandemic in southern Ethiopia: a multicentre cross-sectional study. BMJ Open. 2021 Dec 1;11(12):e057708.
- Basnet S, Bhandari B, Gaire B, Sharma P, Shrestha RM. Depression, Stress, and Anxiety among Residents of Nepal during COVID-19 Lockdown. J Adv Acad Res. 2021 Jun;22(1):53–62. 8(.
- Silwal M, Koirala D, Koirala S, Lamichhane A. Depression, anxiety and stress among nurses during corona lockdown in a selected teaching hospital, Kaski, Nepal. Journal of Health and Allied Sciences. 2020 Oct 19;10(2):82 – 7. Page 27/27
- Gupta AK, Mehra A, Niraula A, Kafle K, Deo SP, Singh B, Sahoo S, Grover S. Prevalence of anxiety and depression among the healthcare workers in Nepal during the COVID-19 pandemic. Asian J psychiatry. 2020 Dec;54:102260.
- Kafle K, Shrestha DB, Baniya A, Lamichhane S, Shahi M, Gurung B, Tandan P, Ghimire A, Budhathoki P. Psychological distress among health service providers during COVID-19 pandemic in Nepal. PLOS ONE. 2021 Feb 10; 16(2):e0246784.
- lawcommission.gov.np