
International Journal of Media and Networks(IJMN)
ISSN: 2995-3286 | DOI: 10.33140/IJMN
Impact Factor: 1.02


Research Article - (2024) Volume 2, Issue 9
An Examination of the Latencies Found in a Wi-SUN FAN Network
Received Date: Sep 06, 2024 / Accepted Date: Sep 26, 2024 / Published Date: Oct 02, 2024
Copyright: ©Ã?©2024 Leslie J. Mulder, et al. This is an open-access article distributed under the terms of the Creative Commons Attribution License, which permits unrestricted use, distribution, and reproduction in any medium, provided the original author and source are credited.
Citation: Mulder, L. J., Tedeschi, D. (2024). An Examination of the Latencies Found in a Wi-SUN FAN Network. Int J Med Net, 2(9), 01-06.
Abstract
This paper reports on the results of multicast latency and round trip time measurements for a particular deployment of nodes forming a Wi-SUN FAN 1.0 network [1].
The authors have explored in detail the behaviour of the WiSUN FAN network used by Hee-Jun Lee and Sang-Hwa Chung, the authors of a prior paper, in order to provide more detail regarding the latencies and delays cited in that paper [2]. We provide details regarding:
• the timing of the component requests and responses that comprise the Lee and Chung round-trip and latency measurements, and
• additional timing and packet delivery ratio results for variations of the MPL retransmission parameters for the Wi-SUN FAN protocol used on the Lee and Chung test network [3].
Index Terms
Wi-SUN FAN, Latency, Multicast Timing, Mesh Network
Introduction
TThe results in this paper were promoted by the latencies in message propagation in a Wi-SUN FAN network as reported by Lee and Chung.
Lee and Chung used a WI-SUN FAN network comprised of twenty one (21) nodes, with one IPv6 6LoWPAN Border Router (6LBR) and twenty (20) IPv6 6LoWPAN Routers (6LR). As part of their work they timed the transit of particular message flows through the network and reported on packet delivery rates for the messages [4,5].
The current authors have replicated Lee and Chung’s network and have conducted timing tests using the same message flows. The times and packet delivery rates recorded are respectively short and higher than those reported by Lee and Chung.
Review
The topology of the network used to run the tests on, is that of a set of four radial spokes, each with five 6LRs placed along the spokes, with the 6LBR at the hub of the spokes. The implication of the topology is that nodes from other spokes are beyond radio range and only those nodes on a spoke that are next to the 6LBR can communicate with the 6LBR. Lee and Chung depict the topology as shown in Figure 1.
In contrast to this layout for the nodes, Lee and Chung indicate in a photograph of their setup (Fig. 7 in their paper) that twenty (20) nodes are arranged, physically, in three (3) collocated USB hubs. It is assumed that these are the 6LR nodes. The location of the 6LBR is unknown.
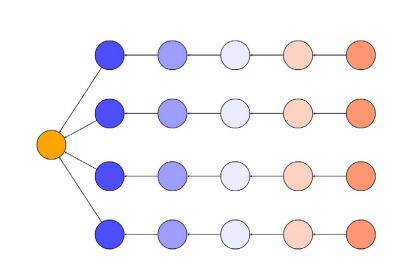
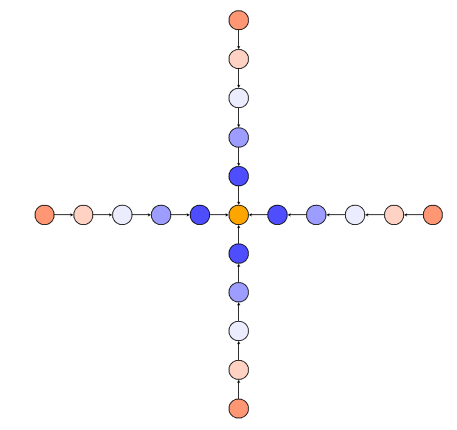
It is clear that the setup depicted will not form the network topology shown in Figure 1; given the proximity of the nodes shown in the USB hubs the expected topology would be a star, with all of the 6LR nodes being one hop away from the 6LBR and not a network comprising four (4) independent spokes as shown in Figure 2.
We assume that Lee and Chung used some form of address filtering in their Wi-SUN FAN implementation in order to force the topology reported by them and shown in Figure 1. However, by doing so and arranging the nodes as they have, from a PHY layer perspective all twenty one (21) nodes in the network will be in radio range of all of the other nodes.
Comparatively if the nodes had been deployed as per Figure 2, such that address filtering was not used to enforce the topology but that the topology had formed naturally due to path loss, nodes would only be receiving signals from their adjacent neighbors in the same spoke and none other. This would result in a substantial reduction in the level of contention, that nodes would experience, for bandwidth and potentially a reduction in the number of retires required to successfully transmit a packet and hence a systemic reduction in the delays and latencies reported.
Lee and Chung report timings based on the round trip time taken for a multicast request, sent from the 6LBR, to be received by all of the 6LRs and the last unicast response to be received by the 6LBR from the set of 6LRs that received the multicast request.
Lee and Chung also report a packet deliver ratio which is
not defined in their paper but one that we assume is the ratio of the number of received unicast responses by the 6LBR over the number of 6LRs per application layer request message.
We think that the use of round trip time measurement by Lee and Chung does not provide a clear overview of the latencies that one might expect from a Wi-SUN FAN network. Additionally it relies on a contrived message flow, i.e. one that is likely not to be used in practice. Regardless for comparison we used their network topology and message flow pattern to explore the latencies and delays in more detail.
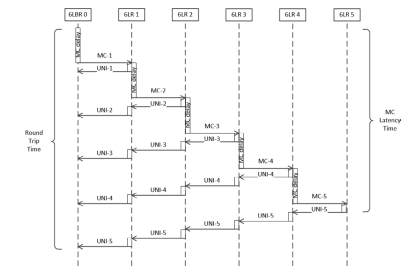
In Figure 3 the individual message transmissions and the intervening delays form a process in time. The timing of the sequence of events is jittered by the MPL trickle timer, for which we used Imin = 256 ms and Imax = two (2) doublings . Further jitter is introduced as a consequence of the microprocessor processing time required to retransmit the multicast and unicast messages and message transit times as they are relayed through the network [6].
Additional timing delays are introduced by each node retransmitting each multicast packet N times; the MPL RFC recommends three (3) transmissions, which the Wi-SUN FAN specification follows, Lee and Chung used only one (1) multicast transmission per request, as well as delays due to retries of the unicast responses due to clear channel assessment failures.
The overall process used by Lee and Chung has an application initiating a multicast request message to all of the nodes in the network, all assumed to be in the same multicast group. The initiation of this application message forms the basis of their timing. Leaving aside the multicast retransmissions and clear channel assessment failures and the potential back-offs associated with channel contention, the following, simplified, set of events occur, as shown in Figure 3:
• the request is queued and delayed some random time between 128 and 256 milliseconds, as per the MPL proactive forwarding algorithm;
• at the end of the delay the 6LBR multicasts (broadcast, to the multicast address) the message. This message is labelled ’MC-1’ in the Figure 3;
• with the imposed topology, the tier-1 6LRs receive the message;
• although not explicitly stated, we assume that the tier1 6LRs responded to the multicast request at this stage with a unicast response back to the 6LBR. This unicast response is labeled ’UNI-1’ in the Figure 3, and;
• the received multicast message is queued for retransmission after a random delay of between 128 and 256 milliseconds;
• at the end of the delay the tier-1 6LRs multicast (broadcast, to the multicast address) the message. This message is labelled ’MC-2’ in the Figure 3;
• with the imposed topology the tier-2 6LRs receive the multicast message. The 6LBR will receive this message but will ignore it since the message it is a duplicate;
• again, we assume that the tier-2 6LRs responded to the multicast request at this stage with a unicast response back to the 6LBR. This unicast response is labelled ’UNI2’ in the Figure 3;
• the tier-1 6LR receives the ’UNI-2’ message from the tier 2 6LR and retransmits it to the 6LBR, and;
• the process is replicated at each tier, at the fifth (5th) tier, the 6LRs, on receipt of the MPL 5 request message, send the unicast response message labelled ’UNI-5’ back to the 6LBR; a process that entails 5 hops.
Clearly if each node transmits each multicast request more than once, as is the case in Wi-SUN FAN networks, with three (3) transmissions, the number of overall transmissions in the system increases. The receivers will receive those additional multicast requests but shall ignore any duplicates and refrain from retransmiting additional multicast request based on those already received. However, it is also the case that with the multicast messages being transmitted multiple times the overall probability that the broadcasted multicast requests will be received will increase, something that Lee and Chung did not explore.
It is assumed that the round trip times reported by Lee and Chung comprise the total amount of time from the application initiating the multicast request to the receipt of the last unicast response message in response to that multicast request. This time is comprised of:
• five (5) multicast delay times;
• the latency time needed to transmit a unicast message from the tier-5 6LRs to the 6LBR;
• the processing overhead;
• the transmission times, and;
• any retry times that might be required due to detected interference.
In addition to the round trip times reported, Lee and Chung also report on packet delivery rates. Here, too, we are not certain how Lee and Chung calculated this rate but assume that it is the average of the ratio of the number of unicast responses received at the 6LBR over the number of 6LRs in the system, in this case twenty (20), per application level multicast request. Lee and Chung report round trip times of 4.5 seconds and packet delivery ratios of 70% for the system as described and for the Wi-SUN FAN implementation that they used.
Results
To provide detail with respect to the Lee and Chung results we attempted to replicate their approach.
To do this we arranged a set of nodes in the same configuration as Lee and Chung but did so in two distinct variations; one where in all of the nodes are within radio range of each other and the spoke-like topology of the network is imposed by using address filtering, termed a ”high density” network, as shown in Figure 1, and, the other, where in the nodes are arranged such that only nearest neighbours in the same spoke are within radio range of each other, which we are calling a ”low density” network, as shown in Figure 2.
To implement the 6LBR and 6LRs the authors used their own modules based on an STM32L4 (Cortex M4 processor, 80 MHz) and the AT86RF215 IEEE 802.15.4 transceiver and their own, certified, Wi-SUN FAN 1.0 protocol stack and channel hopping media access layer.
The tests were done using channel hopping on a common channel plan with one application level multicast request being sent from the 6LBR every 10 seconds for a period of one hour, providing sample sets of three hundred and sixty (360) independent request messages and their theoretical eighteen hundred (1800) unicast response messages, excluding retries.
Table I details the operational parameters of the test network. We chose to explore scenarios that varied the number of multicast messages in order to show the changes in the Round Trip Time, MPL TX to RX latencies and packet delivery ratios. We note that the MPL RFC recommends the use of 3 MPL messages per multicast request, not one, as was used by Lee
|
Parameter |
Value |
Note |
|
Number of nodes |
21 |
(1 6LBR, 20 6LR) |
|
Modulation |
FSK |
|
|
Symbol Rate |
300 ksps |
|
|
MPL trickle Imin |
256 ms |
|
|
MPL trickle Imax |
2 |
k=10 |
|
MPL trickle k |
10 |
|
|
Number of timer expiration for MPL |
3 |
|
|
CCA energy detection duration |
8 symbols |
(27µs) |
|
Maximum backoff exponent |
5 |
|
|
Minimum backoff exponent |
3 |
|
|
Maximum number of backoff |
4 |
|
|
Maximum number of retransmissions |
1, 2, 3 |
|
|
Number of frequency channels |
16 |
|
|
Unicast Dwell Interval |
100 ms |
|
|
Broadcast Dwell Interval |
40 ms |
|
|
Broadcast Interval |
200 ms |
|
|
γ = BI/BDI |
5 |
|
|
Maximum DAO interval |
2 hrs |
|
|
Trickle Imin for DIO |
8.192 s |
|
|
Trickle Imax for DIO |
9 doublings |
|
|
Packet queue length |
8 |
|
|
Application data packet size |
136 |
(UDP hdr. + data) |
Table I: Wi-Sun Fan Operational Parameters
and Chung. We define the Round Trip time as being the period of
time from when the application on the 6LBR initiates a multicast request to when the 6LBR receives the last unicast response associated with the initial multicast request on a tier by tier basis, the MPL TX to RX latency as being the period of time from when the application on the 6LBR initiates a multicast request to when the 6LRs in a tier receives the multicast request, also on a tier by tier basis.
For direct comparison we present the round trip timing results that we obtained for both the low and high density networks and detail the variation in times for each of the cases where MPL messages are sent once, twice and three times. The results are shown in Figure 4.
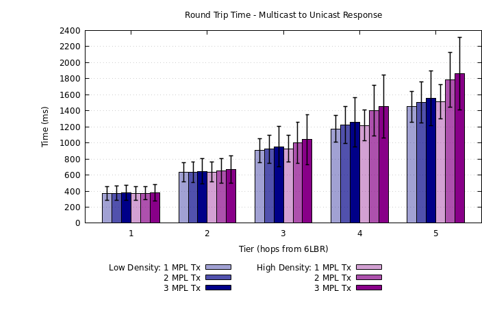
Figure 4: Round Trip Timing for Low and High Density Networks, by Tier
Noting that the results for tier-5 (MPL-1, high density) correspond with the Lee and Chung results, excepting that we report round trip times of 1.8 seconds.
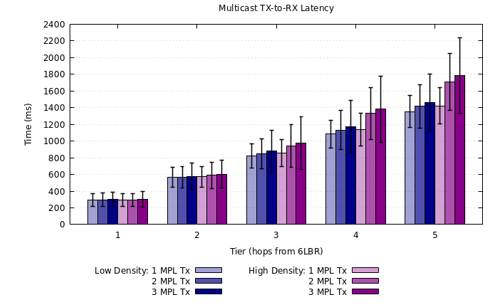
Figure 5: MPL Tx to RX Latencies for Low and High Density Networks, by Tier
Additionally we provide the packet delivery ratios by tier for the cases where in MPL was configured to send 1, 2 and 3 multicast message per request or hop; as shown in Figure 6.
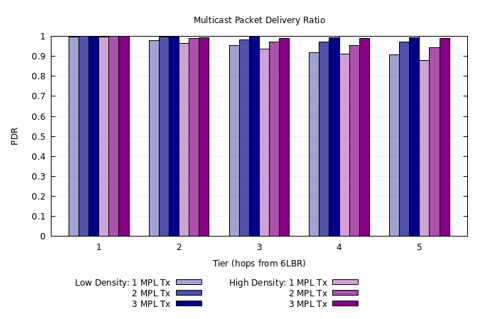
Figure 6: Packet Delivery Ratios for MPL Requests for Low and High Density Networks, by Tier
Given that the packet delivery ratios are 90% or higher, the packet loss ratios are also presented in Figure 7:
Discussion
In contrast to Lee and Chung we measure maximum round trip times of ≈1510 ± 210 ms for high density networks; networks that we assume are deployed as Lee and Chung have done, and 1450 ± 190 ms for low density networks; networks that are topologically consistent with the network depicted in Figure 1 and Figure 2, respectively, with packet delivery ratios of 91 and 88%, while using one multicast transmission. These results stand in stark contrast with those reported by Lee and Chung.
Figure 7: Packet Loss Ratios for MPL Requests for Low and High Density Networks, by Tier
As the number of multicast transmissions per multicast request increases, the overall round trip times for the deployment increase from 1450 ms to 1505 ms with 2 multicast retransmissions per request and to 1550 ms with 3 multicast transmissions per request for low density networks at tier-5 and similarly with times of 1510, 1790 and 1860 ms for high density networks also at tier-5. The multicast packet delivery ratios for tier-5 also increase from 91% to 97% and 99%, for low density network as the number of multicast transmission increases from 1 to 3. The packet delivery rates show 88%, 94% and 99% for high density networks.
In all cases the round trip times and the packet deliver ratios are, respectively, much shorter and much higher than those reported by Lee and Chung.
The MPL TX to RX times shown in Figure 5 constitute some 75-85% of the round trip times shown in Figure 4. In short, the outbound request is taking most of the total time. For example for the multicast process using only one attempt for tier-5 6LRs the average MPL TX to RX time in the high density network is 1420 ms ± 215 ms whereas the Round Trip Time is 1510 ms ± 210 ms. Indicating that the back propagation of the unicast messages in the worst case from a tier-5 devices took, only, 90 ms ± 30 ms.
That the outbound request and the inbound responses times are asymmetric lies in the built-in delay imposed on the transmitting and retransmiting of multicast messages. The MPL RFC requires that a base delay of Imin/2 plus a random delay of between 0 ms and Imin/2 be applied before transmitting a multicast message. This implies that before the first multicast message is transmitted by the 6LBR there is an intrinsic delay of 192 ms, on average. In addition, at each tier where the multicast message is retransmitted there is an additional average delay of 192 ms. Cumulatively, for the multicast message to reach the 5th tier device, there is an average delay of 960 ms ± 320 ms.
If this delay were to be removed, then the outbound request timing would be significantly reduced. The asymmetry between timing of the outbound message propagation and the inbound is similarly reduced, with the remaining asymmetry being attributable to the difference in timing propagation between unicast and broadcast/multicast messages. It should be noted that this is a theoretical exercise since other factors would prevent this reduction from being realized in full in a practical deployment. The effects on the timing of the outbound multicast message, if the transmission and retransmission delays were removed, are shown in the Figure 8.
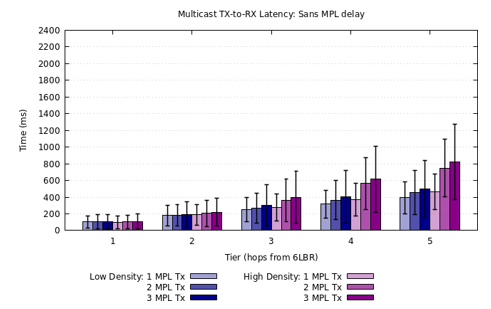
Figure 8: (Zero delay) MPL Tx to RX Latencies for Low and High Density Networks, by Tier
Conclusion
Our replicating of the tests that were run by Lee and Chung shows that the latency and round trip times being reported, for WI-SUN FAN networks, in the literature need to be carefully qualified.
Not having access to the equipment used by Lee and Chung along with gaps in their report regarding the operation of their test network made it impossible for us to understand why their results vary so significantly from those reported here. However it is clear from our testing of a broadly deployed certified WiSUN FAN 1.0 implementation, using a standard set of three multicast transmission per request, that round trip times in a twenty (20) node five (5) hop network will be on the order of 1860 ms and the multicast transmit to receive times for the tier-5 devices is on the order of 1780 ms, with packet delivery rates of greater than 99%. Metrics that are considerably better than those published by Lee and Chung.
We note that changes to the operation of the nodes could be applied to lower the MPL TX to RX times. One such change is to explore reducing the multicast delay time since the bulk of the round trip times and the multicast latencies discussed here are bound up in the specified average multicast delay time of 192 ms per hop or 960 ms for tier-5 devices. Other changes could be implemented as per those suggested by Lee and Chung.
Appendix
|
tier |
mpl-1 |
mpl-2 |
mpl-3 |
|
1 |
370.2 ± 81.7 |
372.9 ± 88.3 |
379 ± 91.2 |
|
2 |
633.6 ± 121.7 |
637 ± 127 |
647.1 ± 155.5 |
|
3 |
904.2 ± 147.8 |
922 ± 175.9 |
953.4 ± 249.1 |
|
4 |
1175.5 ± 168.8 |
1221.1 ± 231.5 |
1255.5 ± 309 |
|
5 |
1448.7 ± 190.2 |
1506 ± 258.2 |
1554.1 ± 338.3 |
Table II: Round Trip Time By Tier in Milliseconds, Low Density
|
tier |
mpl-1 |
mpl-2 |
mpl-3 |
|
1 |
367.9 ± 86.6 |
373.9 ± 84.6 |
380.8 ± 101.6 |
|
2 |
636.9 ± 124.3 |
652.9 ± 154.4 |
668.2 ± 166.8 |
|
3 |
927.2 ± 164.3 |
1002.3 ± 254.2 |
1039.4 ± 309.8 |
|
4 |
1218.6 ± 195 |
1401.7 ± 313.2 |
1454.5 ± 393.3 |
|
5 |
1512.5 ± 212.9 |
1787.8 ± 342.7 |
1862.6 ± 448.8 |
Table III: Round Trip Time By Tier in Milliseconds, High Density
|
tier |
mpl-1 |
mpl-2 |
mpl-3 |
|
1 |
294.8 ± 75.1 |
297.9 ± 81.2 |
300.7 ± 83.5 |
|
2 |
563.9 ± 120.5 |
568.6 ± 127.1 |
578.8 ± 154.4 |
|
3 |
825.1 ± 144.6 |
846.3 ± 177 |
878.9 ± 250.9 |
|
4 |
1086.3 ± 166.4 |
1133 ± 233.9 |
1174.1 ± 313 |
|
5 |
1353.9 ± 190.8 |
1414.6 ± 262.3 |
1459.5 ± 340.6 |
Table IV: MPL TX To RX Latency by Tier in Milliseconds, Low Density
|
tier |
mpl-1 |
mpl-2 |
mpl-3 |
|
1 |
290 ± 76.4 |
295.2 ± 78.1 |
302.1 ± 92.8 |
|
2 |
571.5 ± 124.7 |
589.6 ± 158.2 |
604.5 ± 168.6 |
|
3 |
854.8 ± 162.3 |
938 ± 255.6 |
974.4 ± 312.6 |
|
4 |
1136.6 ± 194 |
1330.2 ± 312.6 |
1382.1 ± 394.6 |
|
5 |
1422.7 ± 213.9 |
1708.2 ± 343.2 |
1785.4 ± 451.3 |
Table V: MPL TX TO RX Latency By Tier in Milliseconds, High Density
|
tier |
mpl-1 |
mpl-2 |
mpl-3 |
|
1 |
102.8 ± 75.1 |
105.9 ± 81.2 |
108.7 ± 83.5 |
|
2 |
179.9 ± 120.5 |
184.6 ± 127.1 |
194.8 ± 154.4 |
|
3 |
249.1 ± 144.6 |
270.3 ± 177 |
302.9 ± 250.9 |
|
4 |
318.3 ± 166.4 |
365 ± 233.9 |
406.1 ± 313 |
|
5 |
393.9 ± 190.8 |
454.6 ± 262.3 |
499.5 ± 340.6 |
Table VI: Zero Delay MPL TX to RX Latency By Tier in Milliseconds, Low Density
|
tier |
mpl-1 |
mpl-2 |
mpl-3 |
|
1 |
98 ± 76.4 |
103.2 ± 78.1 |
110.1 ± 92.8 |
|
2 |
187.5 ± 124.7 |
205.6 ± 158.2 |
220.5 ± 168.6 |
|
3 |
278.8 ± 162.3 |
362 ± 255.6 |
398.4 ± 312.6 |
|
4 |
368.6 ± 194 |
562.2 ± 312.6 |
614.1 ± 394.6 |
|
5 |
462.7 ± 213.9 |
748.2 ± 343.2 |
825.4 ± 451.3 |
Table VII: Zero Delay MPL TX to RX Latency by Tier in Milliseconds, High Density
|
tier |
mpl-1 |
mpl-2 |
mpl-3 |
|
1 |
1 |
1 |
1 |
|
2 |
0.98 |
0.99 |
1 |
|
3 |
0.95 |
0.98 |
1 |
|
4 |
0.92 |
0.97 |
0.99 |
|
5 |
0.91 |
0.97 |
0.99 |
Table VIII: MPL TX to RX Packet Delivery Ratio, Low Density
|
tier |
mpl-1 |
mpl-2 |
mpl-3 |
|
1 |
1 |
1 |
1 |
|
2 |
0.96 |
0.99 |
0.99 |
|
3 |
0.94 |
0.97 |
0.99 |
|
4 |
0.91 |
0.95 |
0.99 |
|
5 |
0.88 |
0.94 |
0.99 |
Table IX: MPL TX to RX Packet Delivery Ratio, High Density
References
- IEEE Standard for Wireless Smart Utility Network Field Area Network (FAN), in: IEEE Std 2857-2021, 2021, pp. 1–182.
- Lee, H. J., & Chung, S. H. (2023, July). A scheduling method for reducing latency in wi-SUN FAN networks. In 2023 Fourteenth International Conference on Ubiquitous and Future Networks (ICUFN) (pp. 439-444). IEEE.
- Hui, J., & Kelsey, R. (2016). Multicast protocol for low- power and lossy networks (MPL) (No. rfc7731).
- Deering, S., & Hinden, R. (2017). Internet protocol, version6 (IPv6) specification (No. rfc8200).
- Montenegro, G. (2007). Transmission of IPv6 Packets Over IEEE 802.15. 4 Networks. No. RFC 4944.
- Levis, P., Clausen, T., Hui, J., Gnawali, O., & Ko, J. (2011). The trickle algorithm (No. rfc6206).
Foot notes
1this provides an average delay of 192 ms