
International Journal of Digital Journalism(IJDJ)
ISSN: 3070-4014 | DOI: 10.33140/IJDJ


Research Article - (2025) Volume 1, Issue 1
An Empirical Study on Factors Shaping Effective Police Leadership for Crime Prevention in Bishoftu City
Received Date: Oct 28, 2025 / Accepted Date: Nov 18, 2025 / Published Date: Nov 26, 2025
Copyright: ©©2025 Fikadu Getachew Mideksa, et al. This is an open-access article distributed under the terms of the Creative Commons Attribution License, which permits unrestricted use, distribution, and reproduction in any medium, provided the original author and source are credited.
Citation: Mideksa, F. G. (2025). An Empirical Study on Factors Shaping Effective Police Leadership for Crime Prevention in Bishoftu City. Int j Digital journalism, 1(1), 01-10.
Abstract
This study examined the factors influencing police leadership effectiveness in crime prevention within the Bishoftu City Police Administration, Ethiopia. An explanatory sequential mixed-method design was employed, integrating quantitative survey data with qualitative interviews. Quantitative data from 100 officers were analyzed using multiple linear regression, probit regression, and Spearman correlation to identify determinants of leadership effectiveness. The results revealed that poor communication and budget shortages negatively affected leadership effectiveness, whereas educational status, experience, leadership style, and follower commitment had positive and significant influences on leadership performance, explaining over 70% of the variance in effectiveness. Qualitative findings supported these results, highlighting the need for improved communication systems, adequate resource allocation, and leadership development programs. The study contributes empirical evidence to the limited literature on police leadership in Ethiopia and offers practical recommendations for enhancing crime prevention outcomes.
Keywords
Police Leadership, Crime Prevention, Organizational Effectiveness, Public Safety
Introduction
Leadership is a central element in shaping organizational performance, influencing how institutions respond to challenges and achieve their goals. Within policing, leadership plays a particularly critical role because it directly affects both internal effectiveness and public safety. Police leaders are expected to guide, motivate, and support their officers while addressing complex challenges such as crime, limited resources, and community trust. When leadership is effective, police organizations are better positioned to prevent crime, ensure justice, and build confidence among the communities they serve [1].
Globally, scholars agree that leadership effectiveness is influenced by a range of factors, including communication, organizational resources, leadership style, job commitment, and emotional intelligence [2-5]. Other studies emphasize the importance of professional skills, incentives, awareness, commitment, and even the negative influence of corruption [6]. In the Ethiopian context, research highlights factors such as top management commitment, reward systems, teamwork, training, culture, supervision, planning, and infrastructure as central to leadership effectiveness [7]. Despite being one of the most widely studied subjects worldwide, leadership remains complex and is often misunderstood, particularly within policing institutions where organizational outcomes directly affect community safety and social order [8].
Although there has been progress in leadership research in Ethiopia, most studies have focused on schools, companies, and other public institutions. For example, identified empowerment, transparency, and vision sharing as important factors influencing leadership in private organizations, while found that school leaders lacked adequate preparation in mobilizing financial and material resources [9,10]. Similarly, reported that leadership effectiveness in Ethiopian technical and vocational colleges was influenced by empowerment, motivation, communication, and vision sharing. However, research specifically examining leadership effectiveness in the police sector remains scarce [11].
The case of Bishoftu City Police Department illustrates this gap clearly. According to its human resources data, employee turnover has been rising, particularly in the criminal investigation department. Leadership is likely among the factors contributing to this problem. Yet, no study has systematically examined how leadership influences effectiveness in crime prevention within this police administration.
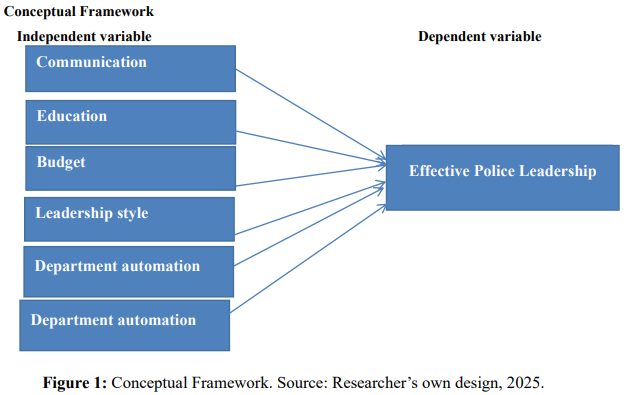
Despite existing research on leadership in other sectors, there is a lack of empirical evidence on how leadership effectiveness shapes crime prevention outcomes in Ethiopian police institutions. Previous studies in Addis Ababa emphasized community participation and crime pattern analysis, yet little attention has been given to how police leadership practices themselves influence crime prevention outcomes. This study addresses that gap by examining internal leadership factors affecting police effectiveness in Bishoftu City. This study fills that gap by systematically examining the key factors influencing police leadership effectiveness in Bishoftu City. It explores how communication, education, resource allocation, leadership style, and follower commitment affect leadership performance and, in turn, the success of crime prevention efforts.
Research Methods
Research design
This study employed an explanatory sequential mixed-method design to investigate the factors influencing leadership effectiveness in crime prevention within the Bishoftu City Police Administration. The quantitative phase focused on identifying relationships among key variables such as communication, resource allocation, education, experience, leadership style, and follower commitment. The qualitative phase was then conducted to explain and enrich the quantitative findings by exploring officers’ perceptions, experiences, and interpretations in more depth.
This design was selected because it allows for both statistical precision and contextual understanding quantitative data reveal general trends, while qualitative insights provide deeper explanations for observed patterns. The design aligns with Creswell (2012), who emphasizes that sequential explanatory approaches strengthen the validity and interpretive depth of mixed-method studies.
Research approach
A sequential explanatory mixed approach was used, involving two phases. First, quantitative data were gathered through structured surveys and analyzed using descriptive and inferential statistics to identify patterns and relationships. Second, qualitative data were collected through in-depth interviews and open-ended questions to explain and enrich the quantitative results. This design provided deeper insights into the “why” and “how” behind the statistical findings. Consistent with Creswell’s (2012) recommendation, the integration of both methods strengthened the validity of the study and offered a comprehensive understanding of leadership effectiveness in the police department [12]. The combination of quantitative and qualitative approaches enhanced the study’s reliability and depth. Quantitative analysis provided objective measures of relationships, while qualitative insights offered interpretive understanding of the underlying causes. This integration is particularly valuable in policing studies, where leadership effectiveness is shaped not only by measurable organizational variables but also by human factors such as perception, motivation, and interpersonal communication.
Population of The Study, Sample Size and Sampling Technique
The study population included all members of the Bishoftu City Police Administration, covering staff from crime prevention, crime investigation, leadership, management, and other units. This diverse group represents the entire workforce engaged in law enforcement and crime prevention activities, making it appropriate for examining leadership effectiveness.
This study combined probability and non-probability sampling techniques [13]. A stratified census approach was applied to the entire population of 134 police officers. The workforce was divided into meaningful categories such as crime prevention, investigation, leadership, and management to ensure balanced representation. Since the population size was manageable, including all members reduced sampling error and captured the full range of perspectives.
In addition, a purposive sampling method was used to select key informants for in-depth interviews. These included senior officers, crime prevention experts, and community policing leaders. They were deliberately chosen because of their experience and specialized knowledge, which provided richer insights beyond what the survey data could reveal.
Instrument of Data Collection
For this study, the researcher employed both questionnaires and interviews to investigate factors affecting leadership effectiveness in crime prevention at the Bishoftu City Police Department. The questionnaire developed by the researcher in English and translated into Afan Oromo, included two sections: personal information and closed-ended items on key themes, using a 5-point Likert scale. This design ensured clarity for respondents and alignment with the study’s objectives [14].
To obtain deeper insights and validate the survey data, the researcher conducted face-to-face interviews with senior police officials in Afan Oromo. This qualitative approach was justified as it captures opinions, attitudes, experiences, and emotions that cannot be measured quantitatively. Responses were coded and translated into English for reliable analysis, with each interview lasting less than an hour [15].
Methods of Quantitative Data Analysis
Quantitative data were analyzed using descriptive and inferential statistics. Percentages, frequencies, mean scores, and standard deviations summarized survey responses [16]. Two parametric regression methods multiple linear regression and profit regression were conducted using SPSS (version 27) to model the relationship between leadership effectiveness and explanatory variables (poor communication, budget shortage, educational status, experience, department automation, leadership style, and follower commitment). Additionally, Spearman’s rank correlation, a non-parametric method, was used to assess associations between these variables and leadership effectiveness, providing a robust check for monotonic relationships without assuming normality. Diagnostic tests including multicollinearity, (Variance Inflation Factor, Tolerance Test), normality, and heteroscedasticity (Breusch-Pagan Test), ensured model validity.
Econometric Model Specification
The researcher used a probit model to examine factors affecting leadership effectiveness in the Bishoftu City Police Department. Leadership effectiveness is the dependent variable, while poor communication, lack of teamwork, budget shortage, educational status, experience, leadership style, followers’ commitment, and department automation are explanatory variables. The model assumes normally distributed errors, independent observations, and no perfect multicollinearity. It estimates the impact of each factor on the probability of achieving effective leadership [17].
SLR = β0 + β1 * PCM + β2 * BST + β3 * EDS + β4 * EX + β5 * DA + β6 * LST + β7 * FLC + Ui
Data Reliability and Validity (Quality Assurance)
The researcher ensured data quality through a pilot test and statistical checks. A pilot test was conducted with 28 respondents to assess the clarity and relevance of the questionnaire items. Reliability was measured using Cronbach’s Alpha, with all constructs exceeding the acceptable threshold (α ≥ 0.7) and an overall reliability of 0.823, indicating good internal consistency (Mugenda, 2003). Validity was confirmed through factor analysis using KMO and Bartlett’s tests, ensuring that the instrument accurately measured the intended constructs.
|
KMO and Bartlett’s Test |
||
|
Kaiser-Meyer-Olkin Measure of Sampling Adequacy |
.919 |
|
|
Bartlett’s Test of Sphericity |
Approx. Chi-Square |
256.309 |
|
Df |
21 |
|
|
Sig. |
0.000 |
|
Table 1: Validity Test
The KMO value (0.919) indicates excellent sampling adequacy, and Bartlett’s Test (χ² = 256.309, p = 0.000) confirms significant correlations among variables, showing that the data is suitable for factor analysis.
Results and Finding
The study found that leadership effectiveness at the Bishoftu City Police Department is moderately influenced by several factors, with a cumulative mean of 3.53 [18]. Poor communication, with a mean of 3.57 and a standard deviation of 1.18, and budget shortages, with a mean of 3.75 and a standard deviation of 1.23, were identified as the most significant constraints, limiting managerial oversight, law enforcement, and emergency response. A senior officer noted that limited budgets hinder effective staff monitoring and resource allocation (Interview #1, May 21, 2025).
Educational status, with a mean of 3.61 and a standard deviation of 2.35, and experience, with a mean of 3.60 and a standard deviation of 1.07, showed variable effects across officers. Department automation, with a mean of 3.55 and a standard deviation of 1.00, and leadership style, with a mean of 3.50 and a standard deviation of 1.08, moderately impacted effectiveness, while followers’ commitment, with a mean of 3.12 and a standard deviation of 1.11, had the least influence.
Overall, these findings suggest that effective police leadership depends on clear communication, adequate resources, education, experience, leadership style, automation, and follower engagement, consistent with Sogunro (2016), who emphasizes that leadership effectiveness, is shaped by both leader abilities and team characteristics [19]. These results show that communication and budget limitations reduce leadership effectiveness, while better education, experience, and supportive leadership styles enhance it.
Inferential Data Analysis Results and Findings
The study employed multiple linear regressions and probit regression, both parametric methods, to model the impact of explanatory variables on leadership effectiveness. Additionally, Spearman’s rank correlation, a non-parametric method, was used to test monotonic associations between leadership effectiveness and explanatory variables (poor communication, budget shortage, educational status, experience, department automation, leadership style, and follower commitment), complementing the regression analyses by not assuming normality or linearity. The model is expressed as:
|
Model Summary |
||||
|
Model |
R |
R Square |
Adjusted R Square |
Std. Error of the Estimate |
|
1 |
.862a |
.743 |
.725 |
.347 |
|
a. Predictors: (Constant), Poor Communication, Budget Shortage, Educational Status, Experience, Department Automation, Leadership Style, Followers Commitment b. Dependent Variable: Leadership effectiveness. |
||||
Table 2: Model Summary
Source: Compiled from survey questionnaires, (2025)
The model summary shows a strong linear relationship between the seven predictors and leadership effectiveness, with a correlation coefficient (R) of 0.862. The R-squared value of 0.743 indicates that 74.3% of the variation in leadership effectiveness is explained by the predictors, while the remaining 25.7% is due to factors not included in the model. The adjusted R-squared of 0.725 confirms that approximately 72.5% of the variation is reliably captured by the model, demonstrating a good fit.
Test of Model Adequacy (ANOVA)
Analysis of variance (ANOVA) is a method of splitting the total variation into meaningful components that measure different sources of variation.
|
ANOVAa |
||||||
|
Model |
Sum of Squares |
Df |
Mean Square |
F |
Sig. |
|
|
1 |
Regression |
32.263 |
7 |
4.609 |
38.09 |
.000b |
|
|
Residual |
11.158 |
92 |
.121 |
|
|
|
|
Total |
43.421 |
99 |
|
|
|
|
||||||
Table 3: ANOVA Test Result
Source: Compiled from survey questionnaires using SPSS V 27, (2025)
The ANOVA results indicate that the regression model is statistically significant (F = 38.09, p < 0.001). The sum of squares for the regression is 32.263, and the residual sum of squares is 11.158. The degrees of freedom for the regression and residuals are 7 and 92, respectively, with mean squares of 4.609 and 0.121. The significant F-statistic confirms that the model provides a good fit and that the predictors collectively have a meaningful impact on leadership effectiveness [20].
Evaluating Significance of Individual Regression Coefficients
Regression coefficients estimate the relationship between each predictor and the dependent variable, leadership effectiveness.
|
Beta |
Un standardized Coefficients |
Standardized Coefficients |
T |
Sig. |
||
|
Beta |
Std. Error |
Beta |
||||
|
1 |
(Constant) |
.733 |
.250 |
|
4.898 |
0.000 |
|
Poor Communication |
.168 |
.064 |
.587 |
6.956 |
0.000 |
|
|
Budget Shortage |
.153 |
.056 |
.441 |
6.437 |
0.000 |
|
|
Leadership Style |
.160 |
.045 |
.537 |
6.724 |
0.000 |
|
|
Experience |
.155 |
.045 |
.504 |
5.149 |
0.000 |
|
|
Department Automation |
.354 |
.021 |
.395 |
5.463 |
0.201 |
|
|
Educational Status |
.234 |
.021 |
.552 |
4.674 |
0.400 |
|
|
Followers Commitment |
.101 |
.110 |
.488 |
6.854 |
0.000 |
|
Table 4: Test of Coefficients
Source: Compiled from survey questionnaires using SPSS V 27, (2025)
As indicated in table 4 above on the SPSS out put on regression coefficients, the regression equation
Poor Communication
Hypothesis 1 (H1): Poor communication has a significant positive effect on leadership effectiveness.
The p-value for poor communication is 0.000, less than 0.05, leading to rejection of the null hypothesis (H0). The unstandardized coefficient (B) is 0.168, indicating that a one-unit increase in poor communication increases leadership effectiveness by 16.8%, holding other variables constant [21].
Budget Shortage
Hypothesis 2 (H2): Budget shortage negatively affects leadership effectiveness.
The p-value is 0.000 (<0.05), and B = −0.153, implying that a one-unit increase in budget shortage corresponds to a 15.3% decrease in leadership effectiveness, holding other variables constant.
Leadership Style
Hypothesis 3 (H3): Leadership style significantly influences leadership effectiveness.
With a p-value of 0.000 and B = 0.160, a unit increase in leadership style leads to a 16% increase in leadership effectiveness.
Experience
Hypothesis 4 (H4): Experience positively affects leadership effectiveness.
The coefficient (B = 0.155) suggests that greater experience increases leadership effectiveness by 15.5%, holding other variables constant.
Followers’ Commitment
Hypothesis 5 (H5): Followers’ commitment positively influences leadership effectiveness. The p-value is 0.000, and B = 0.101, indicating a 10% increase in leadership effectiveness with higher follower commitment.
Multi collinearity
Multicollinearity tests are used to identify strong correlations among explanatory variables and to prevent duplication in a regression model (Gujarati, 2003). The Variance Inflation Factor (VIF) and tolerance values are commonly applied measures [22].
|
Variables |
Tolerance |
VIF |
|
Poor Communication |
.258 |
3.87 |
|
Budget Shortage |
.219 |
4.55 |
|
Leadership Style |
.694 |
1.44 |
|
Experience |
.383 |
2.61 |
|
Department Automation |
.752 |
1.33 |
|
Educational Status |
.568 |
1.76 |
|
Followers Commitment |
.429 |
2.33 |
Table 5: Multicollinearity Result
Source: Compiled from survey questionnaires using SPSS V 27, (2025)
VIF indicates how much the variance of a regression coefficient is inflated due to multicollinearity, with values below 10 suggesting no serious multicollinearity. Tolerance measures the proportion of variability in an independent variable not explained by the other predictors.
The above table 5 presents the multicollinearity results. All VIF values are below 10, and tolerance values are greater than 0.1, indicating that multicollinearity is not a concern among the independent variables [23]. Therefore, the regression coefficients can be considered reliable, and the null hypothesis of multicollinearity is rejected.
Auto-Correlation Test: The Durbin-Watson statistic was 1.6251, indicating a low likelihood of autocorrelation in the regression residuals. This confirms that the regression results are reliable.
Heteroscedasticity: The Breusch-Pagan test was used to check for heteroscedasticity in the regression model. The F-statistic p-value of 0.4096 exceeds 0.05, indicating no evidence of heteroscedasticity. Thus, the residuals have constant variance, confirming the reliability of the model.
|
Diagnostic Test Description |
Statistic |
p-value |
|
F-test for model specification and heteroscedasticity |
1.068897 |
0.4096 |
|
Breusch-Pagan LM test for heteroscedasticity |
10.75869 |
0.3766 |
|
Scaled explained sum of squares for model fit |
5.390081 |
0.8636 |
Table 6: Breusch-Pagan-Godfrey Result
Source: Compiled from survey questionnaires using SPSS V 27, (2025)
Normality Test
Normality of the regression residuals was assessed using the Shapiro-Wilk test, along with skewness and kurtosis values [24]. The Shapiro-Wilk p-value was 0.15, greater than 0.05, leading to acceptance of the null hypothesis that the residuals are normally distributed [25]. Skewness (-0.626) and kurtosis (3.648) further confirm that the data follow a normal distribution, supporting the validity of the regression analysis.
Correlation Between Leadership Effectiveness and its Determinant Factors
Hypotheses were tested using both regression and correlation results. The multiple linear regression shows significant effects for poor communication (p = 0.000), budget shortage (p = 0.000), educational status (p = 0.04), experience (p = 0.000), leadership style (p = 0.000), and follower commitment (p = 0.000), rejecting the null hypotheses of no relationship. The probit regression (Table 7) confirms significant effects for educational status, budget shortage, poor communication, and follower commitment. Spearman’s correlation (below) further supports these findings with significant associations (p < 0.01) for most variables, except department automation [26].
|
Leadership Effectiveness |
Variables |
N |
Spearman Correlation |
Sig.(2-tailed) |
|
Poor communication |
100 |
.702** |
.000 |
|
|
Budget shortage |
100 |
.177 |
.008 |
|
|
Educational status |
100 |
.192 |
.045 |
|
|
Dep. automation |
100 |
-.572 |
.310 |
|
|
Experience |
100 |
.903** |
.000 |
|
|
Leadership style |
100 |
.862** |
.000 |
|
|
Followersâ?? commitment |
100 |
.903** |
.000 |
|
|
*. Correlation is significant at the 0.05 level (2-tailed). |
||||
|
**. Correlation is significant at the 0.01 level (2-tailed). |
||||
Table 7: Spearman Correlations
Source: Compiled from survey questionnaires using SPSS V 27, (2025)
Table 7 shows significant correlations (p < 0.01) for poor communication, budget shortage, educational status, experience, leadership style, and follower commitment, but not for department automation (p = 0.31) [27].
Logistics Regression Result
For probit models with a qualitative dependent variable, conventional R-squared is not appropriate, so likelihood ratio-based measures are used to assess goodness of fit [28]. This measure compares the log-likelihood of the model with predictors to the log-likelihood of a model with only a constant, and ranges from 0, indicating no explanatory power, to 1, indicating perfect prediction. In this study, the likelihood ratio for the probit model is 0.6856, indicating that the model explains approximately 68.56% of the variation in the dependent variable [29].
Probit Regression Analysis
By running logistic regression analysis above the relationship between leadership effectiveness and the rest explanatory variables was analyzed in the following table 8 shows the probit regression analysis model summary.
|
Variables |
Coefficient |
Std. Err. |
Z. value |
P. value |
|
EDS |
2.5222 |
0.08031380 |
2.37 |
.005 |
|
EX |
6.2770 |
0.01106400 |
3.88 |
.175 |
|
BST |
-0.0032 |
1.59881700 |
-0.49 |
.005 |
|
DA |
4.2279 |
0.80295180 |
1.54 |
.999 |
|
LST |
0.8960 |
1.29921100 |
0.28 |
.510 |
|
PCM |
2.8890 |
0.79107030 |
2.13 |
.010 |
|
FLC |
1.99900 |
0.8345122 |
2.31 |
.001 |
|
cons |
-2.4180 |
2.81610400 |
-2.68 |
-0.20 |
|
Observation = 100 |
|
|
|
|
|
LR chi2(12) = 0.7856 |
|
|
|
|
|
Prob > chi2 = 0.0000 |
||||
|
Pseudo R2 = 0.72 |
Table 8: Regression Result
Source: Compiled from survey questionnaires using SPSS V 27, (2025)
The probit regression (Table 8) identified educational status (p = 0.005), budget shortage (p = 0.005), poor communication (p = 0.010), and follower commitment (p = 0.001) as significant predictors, with a pseudo R² of 0.7263, explaining 72% of the variation.
According to Sogunro (2016), studied on leadership effectiveness in group situations, conclude that leadership effectiveness is affected by personality characteristics of members of the group being led. This was conducted with the variables of personality and training of the leader, the characteristics of the group being led, the situation in which the group operates, and the goals being sought.
Post Estimation
The table below shows marginal effect of significant variables of factors influencing leadership effectiveness in criminal justice sectors of police institutions: the case of Bishoftu city police administration [30].
|
Variables |
dy/dx |
Delta-method Std. Err. |
Z |
P>z |
|
EDS |
0.112863 |
0.0056583 |
2.3400 |
0.015 |
|
EX |
0.100004 |
0.0007287 |
2.8330 |
0.550 |
|
BST |
-0.59367 |
0.1043849 |
-0.480 |
0.030 |
|
DA |
0.840211 |
0.0436023 |
0.1300 |
0.622 |
|
LST |
0.483639 |
0.0638016 |
0.8100 |
0.533 |
|
PCM |
0.353675 |
0.0000415 |
1.870 |
0.012 |
|
FLC |
.02117854 |
0.0243111 |
0.941 |
0.022 |
|
*, ** & *** are at 10, 5% and 1% level of significance respectively. |
||||
Table 9: Marginal Effect of Significant Variables
Source: Compiled from survey questionnaires using SPSS V 27, (2025)
Table 9 reports the marginal effects from the probit regression, showing that a one-unit increase in educational status (11%, p = 0.015), poor communication (35%, p = 0.012), and follower commitment (21%, p = 0.022) increases the probability of effective leadership, while budget shortage (-59%, p = 0.030) reduces it. Consistent with theoretical expectations, budget shortage has a negative marginal effect, meaning that as financial constraints increase, the probability of achieving effective leadership decreases [31].
Conclusion and Recommendations
Conclusion
This study concludes that effective police leadership plays a decisive role in promoting successful crime prevention within the Bishoftu City Police Administration [32]. The findings show that communication barriers and limited budgets negatively influence leadership effectiveness, while educational level, experience, leadership style, and follower commitment positively enhance it. In addition, experience and leadership style were also found to contribute meaningfully to leadership effectiveness, particularly in fostering coordination and motivation among officers[33].
The statistical results from multiple linear regression (R² = 0.743), probit regression (pseudo R² = 0.7263; likelihood ratio = 0.6856), and Spearman’s correlation consistently confirm these relationships. Complementary qualitative evidence from interviews further highlighted the importance of improving internal communication, ensuring adequate funding, and expanding leadership training programs to strengthen institutional capacity. This study concludes that leadership effectiveness in the Bishoftu City Police Administration is strongly shaped by both institutional and individual factors. Communication barriers and budget shortages weaken leadership performance, whereas education, experience, supportive leadership styles, and committed followers strengthen it [34].
Therefore, the Oromia Police Commission and training institutions should prioritize continuous leadership education, enhance budget efficiency, and develop communication systems that promote transparency and collaboration.
Recommendations
• Addressing financial and communication constraints is essential because resource shortages and weak communication channels significantly reduce leadership effectiveness.
• Encourage continuous education for police leaders through scholarships or academic partnerships, given its consistent significance across analyses.
• Introduce recognition programs and team-building activities to boost officer engagement, enhancing leadership effectiveness.
• Prioritize experienced officers in leadership roles and establish mentoring programs to transfer expertise, as experience was significant in linear regression and correlation.
• Develop leadership training programs focusing on transformational and situational leadership, given its significance in linear regression and correlation.
• Investigate additional factors, such as community engagement or technological integration, to further enhance leadership effectiveness in crime prevention.
Suggestion for Future Researchers
Since this research is only limited to Bishoftu city and researchers can use it as a benchmark for the study of another similar research. The scope of this study was cross-sectional, whereas the researchers were advised to follow longitudinal to ensure that the findings were more comprehensive and the research result contribution was maximized. Further research should also be conducted using another variable that have an effect on leadership effectiveness, such as empowerment, transparency, relationship building, vision sharing, and working on leadership traits.
References
- Yigzaw, Y., Mekuriaw, A., & Amsalu, T. (2023). Analyzing physical and socio-economic factors for property crime incidents in Addis Ababa, Ethiopia. Heliyon, 9(2), e13282.
- Benmira, S., & Agboola, M. (2021). Evolution of leadership theory. BMJ Leader.
- Martin, J. (2020). Library leadership your way. The Serials Librarian, 78(1–4), 9–16.
- Avolio, B. J., & Hannah, S. T. (2022). How leader and follower prototypical and antitypical attributes influence ratings of transformational leadership in an extreme context. Human Relations, 75(3), 441–474.
- Mansaray, H. E. (2019). The role of leadership style in organisational change management: A literature review. Journal of Human Resource Management, 7(1), 18–31.
- Bashir, M., & Bada, H. (2020). The need for ethical leadership in combating corruption. International Review of Administrative Sciences, 86(4), 673–690.
- Tariku, M. T. (2020). An integrative review on factors affecting kaizen implementation in private and government-owned organizations in Ethiopia: Gaps in existing literature and insights for future researchers. ICTACT Journal on Management Studies, 6(4), 1158–1167.
- Alehegn, D., Karunakara, R., & Engeda, B. (2024). Community advancement in community policing within the Addis Ababa City Organization: International Journal of Management and Humanities, 10(10), 15.
- Hailu, A. (2017). Factors affecting leadership effectiveness at Gift Group of Companies. Ethiopian Journal of Management Studies, 3(1), 21–38.
- Hunde, A., & Desalegn, G. (2019). Practices and challenges of the school improvement program (SIP) in secondary schools of Ilu Aba Bor Zone. Ethiopian Journal of Social Sciences and Language Studies, 6(2), 65–85.
- Alehegn, D., Ramasay, K., & Engeda, B. (2024). Crime analysis in Addis Ababa sub-cities: Reflecting the impact of policing efforts and community involvement in crime prevention. Research Square.
- Mideksa, F. G. (2024a). Factors that affect prevention of gender-based violence against women: The case of Bishoftu City. International Journal for Research Trend in Social Science and Humanities, 2(1), 18–47.
- Allal-Chérif, O., Guemri, M., Gharbi, M., & Cherif, C. (2021). Being an ethical leader during the apocalypse: Lessons from the Walking Dead to face the COVID-19 crisis. Journal of Business Research, 133, 354–364.
- Araoz, M., Mubarak, N., Khan, J., & Pesämaa, O. (2017). Lord of the Flies in project-based organizations: The role of passive leadership on creativity and project success. Project Management Journal, 54(5), 508–522.
- Badri-Harun, A. Z., Ahmad, N. H., & Rahman, M. S. (2016). Emotional intelligence as mediator between leadership styles and leadership effectiveness: A theoretical framework. International Review of Management and Marketing, 6(1), 116–121.
- Carswell, M. A. (2021). Developing the leadership capacity of teachers: Theory to practice. Journal of School Administration Research and Development, 6(1), 52–59.
- Dike, V. E., & Amadi, C. (2019). Leadership and management in the 21st century organizations: A practical approach. World Journal of Social Science Research, 2(2), 45–60.
- Gentry, W. A. (2014). The needs of participants in leadership development programs: A qualitative and quantitative cross-country investigation. Journal of Leadership & Organizational Studies, 21(1), 83–101.
- Ghappour, A. (2019). Searching places unknown: Law enforcement jurisdiction on the dark web. Stanford Law Review, 69(5), 1075–1120.
- Gqada, D. (2017). The South African Police Service organisational culture: The impact on service delivery (Doctoral dissertation, Stellenbosch University).
- Gupta, S. (2018). Mechanism for leadership development and effectiveness: The relationship between followership, leadership, and psychological capital. Journal of Management and Leadership Studies, 10(2), 87–102.
- Hannola, L., Rantala, T., & Saarikko, T. (2018). Empowering production workers with digitally facilitated knowledge processes: A conceptual framework. International Journal of Production Research, 56(14), 4729–4743.
- Järlström, M., Saru, E., & Vanhala, S. (2018). Sustainable human resource management with salience of stakeholders: A top management perspective. Journal of Business Ethics, 152(3), 703–724.
- Kabetu, D. G., & Iravo, M. A. (2018). Influence of strategic leadership on performance of international humanitarian organizations in Kenya. International Academic Journal of Innovation, Leadership and Entrepreneurship, 2(2), 113–135.
- Lim, A. T. (2024). Ethical leadership in the eyes of Gen Z: A literature review. FIRM Journal of Management Studies, 9(1), 83–96.
- Mideksa, F. G. (2024b). The determinants of saving behavior among households in Bishoftu Town. Journal of Research in Business and Management, 11(1), 42–53.
- Nalla, M. K., Meško, G., & Modic, M. (2018). Assessing police–community relationships: Is there a gap in perceptions between police officers and residents? Policing and Society, 28(3), 271–290.
- Nelson, T., & Szymanski, L. (2017). Addressing complex challenges through adaptive leadership: A promising approach to collaborative problem solving. Journal of Leadership Education, 16(4), 111–123.
- Obeng-Asare, K., & Korang, V. (2024). Democratic leadership style and performance of administrative staff in selected universities in the Bono Region of Ghana. International Journal of Multidisciplinary Studies and Innovative Research, 12(1), 1776–1786.
- Pandey, J. (2020). What is good police performance? Social Science Research Network (SSRN).
- Shiferaw, W. (2017). Effective decision making and its impact on social justice: The Federal and Oromia regional states of Ethiopia; law and practice (Doctoral dissertation, University of Warwick).
- Temesgen, A. (2017). Exploration of the role of Ethiopian cooperative unions in rural development and their challenges. Journal of Agriculture, Food and Natural Resources, 1(1), 80–88.
- Tesfaw, T. A. (2024). The relationship between transformational leadership and job satisfaction: The case of government secondary school teachers in Ethiopia. Educational Management Administration & Leadership, 42(6), 903–918.
- Wang, E. L., & Marks, D. (2017). Launching a redesign of university principal preparation programs. RAND Corporation.