
Journal of Investment, Banking and Finance(JIBF)
ISSN: 2997-2256 | DOI: 10.33140/JIBF
Impact Factor: 0.92


Research Article - (2026) Volume 4, Issue 1
Algorithms for Estimating Linear Function in Data Mining
Received Date: Feb 18, 2026 / Accepted Date: Mar 11, 2026 / Published Date: Mar 20, 2026
Copyright: ©2026 Thomas Hoang. This is an open-access article distributed under the terms of the Creative Commons Attribution License, which permits unrestricted use, distribution, and reproduction in any medium, provided the original author and source are credited.
Citation: Hoang, T. (2026). Algorithms for Estimating Linear Function in Data Mining. J Invest Bank Finance, 4(1), 01-08.
Abstract
The main goal of this topic is to showcase several studied algorithms for estimating the linear utility function to predict the users’ preferences. For example, if a user comes to buy a car that has several attributes including speed, color, age, etc in a linear function, the algorithms that we present in this paper help with estimating this linear function to filter out a small subset that would be of best interest to the user among a million tuples in a very large database. In addition, the estimating linear function could also be applicable in getting to know what the data can do or predicting the future based on the data that is used in data science, which is demonstrated by the GNN, PLOD algorithms [1,2]. In the ever-evolving field of data science, deriving valuable insights from large datasets is critical for informed decision-making, particularly in predictive applications. Data analysts often identify high-quality datasets without missing values, duplicates, or inconsistencies before merging diverse attributes for analysis. Taking housing price prediction as a case study, various attributes must be considered, including location factors (proximity to urban centers, crime rates), property features (size, style, modernity), and regional policies (tax implications). Experts in the field typically rank these attributes to establish a predictive utility function, which machine learning models use to forecast outcomes like housing prices. Several data discovery algorithms, including address the challenges of predefined utility functions and human input for attribute ranking, which often result in a time-consuming iterative process, which the work of cannot overcome[1-4]. The notable enhancement uses a Graph Neural Network (GNN) algorithm that builds on previous approaches. The GNN algorithm leverages the power of graph neural networks and large language models to interpret text-based values that earlier models like PLOD could not handle, significantly improving the reliability of outcome predictions. GNN extends PLOD’s capabilities by incorporating numerical and textual data, offering a comprehensive approach to understanding user preferences for data science and analytics applications.
Keywords
Data Systems, Machine Learning, Graph Neural Networks, Large Language Model, Decision Making
Introduction
The method of indistinguishability query for identifying tuples that are close to optimal from a user’s perspective [5]. This query retrieves all tuples that are only a small margin below the optimal value according to the user’s unknown utility function. This approach is based on the insight that users often struggle to differentiate between very similar options, and even slightly suboptimal tuples may possess attributes that make them appealing. In addition, this framework asks the user to make a limited number of comparisons, helping to refine an understanding of their preferences. This is a big advancement compared to traditional that ask users for utility functions to proceed with filtering out user’s preference of tuples, like Top-K algorithms, in which the Top-K algorithm requires the user’s utility function, which can be difficult to obtain and is not always applicable where user preferences are not well-defined [6-9].
In addition to estimating the user’s preference for unknown utility functions. The estimating linear function could also be applicable in getting to know what the data can do or predicting the future based on the data that is used in data science. For instance, a scientist may prioritize specific attributes over others based on their domain expertise. For example, an apartment in a central area like New York City with low crime rates and modern amenities may be favored over a remote historic house. Even within similar urban environments, decision-making can be complex—such as weighing the pros and cons of a centrally located apartment against a slightly cheaper option in the suburbs. Other considerations, such as neighborhood friendliness or environmental tranquility, might influence rankings. A utility function captures these variations by assigning importance to each attribute in the prediction process.
Many machine learning algorithms and applied machine learning approaches often require predefined utility functions, meaning the user already understands the weights for each coefficient in linear function (supposedly ranging from 0 to 1), which can be impractical or difficult for many users to specify [4,10,11]. However, these methods have limitations, as they may still produce data subsets that don’t fully align with the user’s actual utility function due to mismatches between the predicted and true utility functions.
Inspired by the approach of Indistinguishability Query, the approach, GNN (Graph Neural Networks and Large Language Models for Data Discovery), overcomes these challenges to predict the future. GNN leverages user-defined attribute rankings and incorporates advanced machine-learning techniques. By combining PLOD’s numerical prediction capabilities with the power of Graph Neural Networks (GNNs) and Large Language Models (LLMs) for text-based data, GNN provides more accurate utility function estimations. This allows for selecting data subsets that more closely reflect user preferences and improves prediction outcomes. By integrating complex models capable of handling large, mixed-type datasets, GNN represents a significant advancement in multimodal predictive applications.
Problem Definition
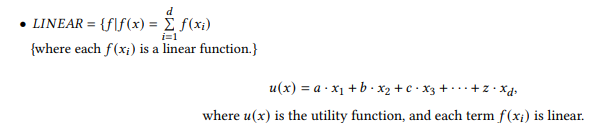
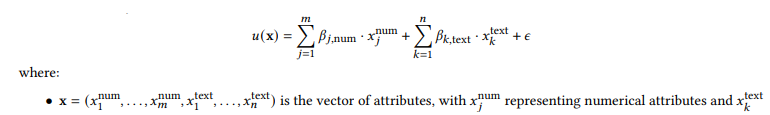
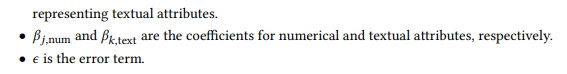
Linear Function
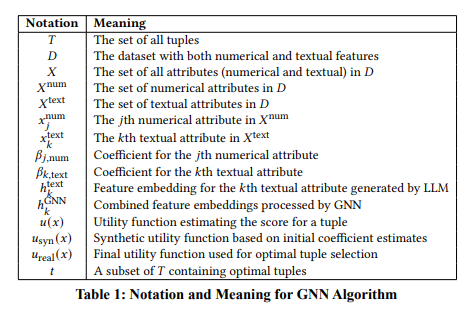
Model Representation for GNN Algorithm, Adapted from GNN [8]
Goal, Adapted from GNN [8]

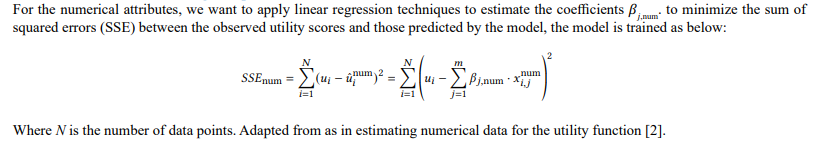
Numerical Data Processing, Adapted from GNN [1]
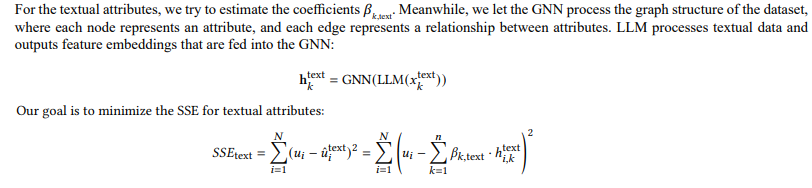
Textual Data Processing, Adapted from GNN [1]
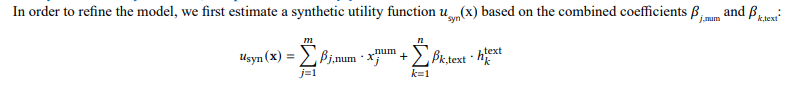
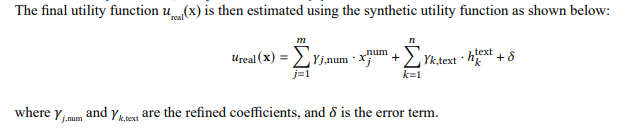
Synthetic Utility Function, Adapted from GNN [1]
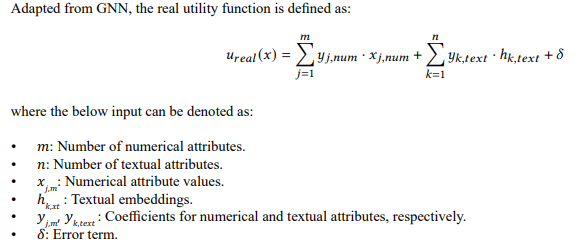
Real Utility Function, Adapted from GNN [1]
Final goal

About the Indistinguishability Query Algorithm
|
car |
MPG |
SR |
MPG + 20SR |
|
cc1 |
59 |
5 |
159 |
|
cc2 |
36 |
4 |
116 |
|
cc3 |
46 |
5 |
164 |
|
cc4 |
34 |
5 |
134 |
|
cc5 |
35 |
5 |
158 |
Table 2: Example of the Indistinguishability Query. All the Highlighted Tuples are 0.05-Indistinguishable from the Optimal (cc3) for a User with the Given Utility Function
Example: Consider Table I, as in Indistinguibility Query, which lists cars cc1 through cc5 [5]. Suppose Alice values fuel efficiency (MPG) and safety rating (SR) and has a utility function (unknown to her) given by cc (MPG, SR) = MPG + 20SR. With this function, her top choice is cc∗ = cc3 since it achieves the highest utility score of 164. With an indistinguishability parameter of cc = 0.05, Alice would be interested in any car that achieves at least 1/(1 + cc) ≈ 95.24% of this maximum utility, which is approximately 156.2 (0.9524 × 164).Therefore, the indistinguishability query should return cars {cc1 ,3,cc }, as highlighted in the table. Note that, while cc differs significantly from Alice’s ideal car cc3, it provides a similar utility value for her preferences.
About the Plod and GNN Algorithm
The workflow of the algorithm GNN: First, users rank the dataset’s attributes, which are then scaled to the range {0, 1} based on the rankings. GNN estimates the coefficients for each attribute using machine learning for numerical data and GNN and LLM techniques for textual data. These coefficients are then converted into scores within the same range. The process continues by synthesizing an initial utility function based on these coefficients. GNN then refines this estimate to generate a final utility function, offering a robust approach to aligning predicted data subsets with user preferences.
Graph Neural Networks and Large Language Models (GNN). The GNN algorithm shows the strengths of both GNNs and LLMs, and PLOD handles datasets, including numerical and text features, by asking users to rank attributes and then leveraging GNNs and LLMs, and PLOD to estimate utility function coefficients. Therefore, GNN offers a novel approach to data discovery that does not require explicit utility function definitions from the user. This method improves upon PLOD by incorporating advanced feature extraction and relational modeling capabilities, making it more robust to the complexities of multimodal data. Thus, GNN offers promising and reliance predicting data science and analytics applications.
Mathematical Proof for GNN Algorithm
By taking advantage of PLOD and Graph Neural Networks and Large Language Models, the GNN algorithm combines numerical and textual data processing using the advantage of PLOD as in , Graph Neural Networks (GNNs) as in several studies], and Large Language Models (LLMs) as in thus, to estimate the coefficients of a utility function that ranks the importance of different attributes to identify optimal subsets of data [2,12-16].
Utility Function and Error Term
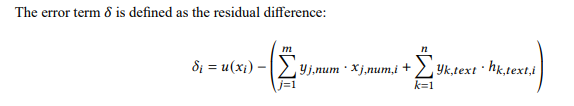
Error Bound Derivation
To Derive the bound for ð?¿, we consider contributions from numerical attributes, textual embeddings, and
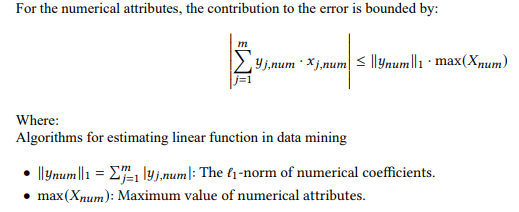
Numerical Contribution
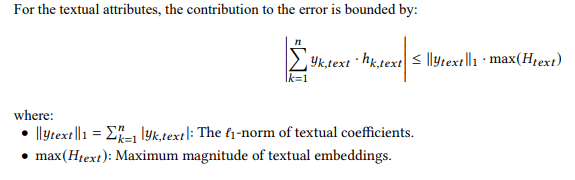
Textual Contribution
Inherent Noise
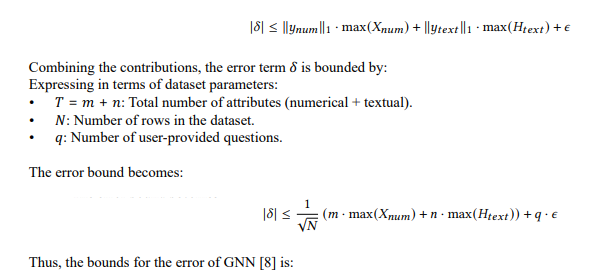
The inherent noise € accounts for the variability or randomness in the data that the model cannot explain. Thus, the error term includes a base line noise component €.
Final Error Bound
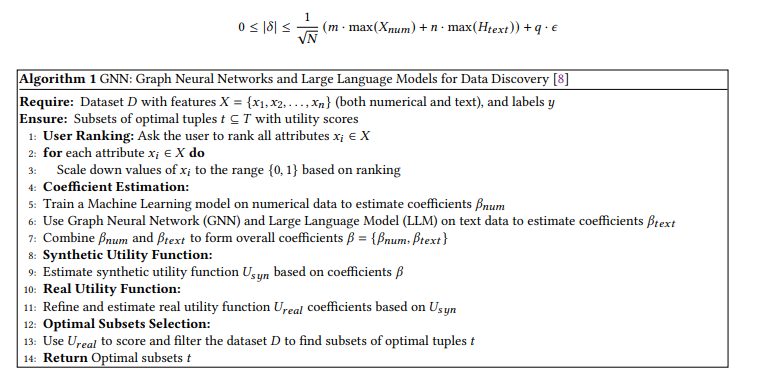
GNN: Graph Neural Networks and Large Language Models for Data Discovery [1]
In lines 1-3:, we are gonna let the GNN algorithm ask the user to rank all attributes in the dataset b, which contains numerical and textual data. Based on the user’s ranking, the attributes are scaled down to a normalized range {0, 1}. In the lines 4-8:, We then try to estimate the coefficients for each attribute bnum for numerical data. After this process, we then try to estimate the coefficients bnum for textual data. Following, the algorithm then combines these estimated coefficients into a comprehensive set b = {bnum } that shows the overall num text importance of each attribute. In the following lines 9-10: After that of using the combined coefficients, the algorithm tries to estimate a synthetic utility function Ureal, which is a step designed to approximate the actual utility function. Next in the lines 11-12:, GNN tries syn to refine this synthetic utility function to produce the actual utility function Urealk . Next in lines 13-14: Finally, we then try with the real utility function, applied to score and filter the dataset U· to identify subsets of optimal tuples U . After all, in line 15: The algorithm finally returns the optimal subsets U as the final output.
Experiments
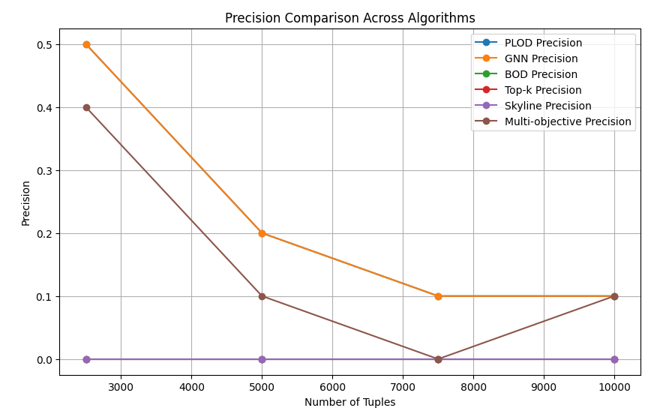
The comparison of precision demonstrates the accuracy when all algorithms run on the same inputs that return how many retrieved results are relevant to the query.
Why GNN Excels Over Other Algorithms
|
Algorithm |
Limitations |
Why GNN Excels |
|
PLOD |
Fails to capture relationships between tuples and lacks semantic understanding of textual data. |
GNN integrates:
|
|
Top-K |
Assumes independence of attributes and ignores relationships between tuples. |
GNN dynamically adjusts rankings by:
|
|
Skyline Computationally expensive for high-dimensional GNN efficiently handles high-dimensional data by: datasets and lacks semantic understanding for textual • Scaling computations using graph structures. data. • Jointly optimizing numerical and textual at- tributes via the real utility function. |
|
Multi-objective Requires manual weight tuning, leading to biases and GNN optimizes holistically by: inconsistencies in results. • Learning weights dynamically for both numerical and textual features.
|
Table 3: Why GNN Excels Compared to Other Algorithms
Conclusion
The GNN performs with the highest precision compared to the previous approaches, as in Figure 1, but takes a comparable amount of time to accomplish. This happens because machine learning is used to estimate the coefficients compared to other approaches for numerical values, and graph neural networks and large language models are used to understand and weigh the textual values from a huge dataset, in which other approaches only understand the numerical values input from the user.
References
- Hoang, T. (2024). Gnn: Graph neural network and large language model for data discovery. arXiv preprint arXiv:2408.13609.
- Hoang, T. (2024). PLOD: Predictive Learning Optimal Data Discovery. Available at SSRN 4882133.
- Hoang, T. (2024). BOD: Blindly Optimal Data Discovery. arXiv preprint arXiv:2401.05712.
- Galhotra, S., Gong, Y., & Fernandez, R. C. (2023, April). Metam: Goal-oriented data discovery. In 2023 IEEE 39th International Conference on Data Engineering (ICDE) (pp. 2780-2793). IEEE.
- Lall, A. (2024, May). The Indistinguishability Query. In 2024 IEEE 40th International Conference on Data Engineering (ICDE) (pp.475-487). IEEE.
- Qin, L., Yu, J. X., & Chang, L. (2012). Diversifying top-k results. arXiv preprint arXiv:1208.0076.
- Soliman, M. A., Ilyas, I. F., & Chang, K. C. C. (2006, April). Top-k query processing in uncertain databases. In 2007 IEEE 23rd international conference on data engineering (pp. 896-905). IEEE.
- Khosla, C., & Kakkar, P. (2015). Top-k Query Processing Techniques in Uncertain Databases: A Review. International Journal of Computer Applications, 120(20).
- Xiao, G., Wu, F., Zhou, X., & Li, K. (2016). Probabilistic top-k range query processing for uncertain databases. Journal of Intelligent & Fuzzy Systems, 31(2), 1109-1120.
- Fernandez, R. C., Abedjan, Z., Koko, F., Yuan, G., Madden, S., & Stonebraker, M. (2018, April). Aurum: A data discovery system.In 2018 IEEE 34th International conference on data engineering (ICDE) (pp. 1001-1012). IEEE.
- Gong, Y., Zhu, Z., Galhotra, S., & Fernandez, R. C. (2023, April). Ver: View discovery in the wild. In 2023 IEEE 39th International Conference on Data Engineering (ICDE) (pp. 503-516). IEEE.
- Kipf,T. N., &Welling, M. (2016). Semi-supervised classification with graph convolutional networks. arXiv preprint arXiv:1609.02907.
- Hamilton, W., Ying, Z., & Leskovec, J. (2017). Inductive representation learning on large graphs. Advances in neural information processing systems, 30.
- VelickoviÄ?, P., Cucurull, G., Casanova, A., Romero, A., Lio, P., & Bengio, Y. (2018, February). Graph attention networks.In International conference on learning representations (Vol. 6, p. 2).
- Brown, T., Mann, B., Ryder, N., Subbiah, M., Kaplan, J. D., Dhariwal, P., ... & Amodei, D. (2020). Language models are few-shotlearners. Advances in neural information processing systems, 33, 1877-1901.
- Devlin, J., Chang, M. W., Lee, K., & Toutanova, K. (2019, June). Bert: Pre-training of deep bidirectional transformers for language understanding. In Proceedings of the 2019 conference of the North American chapter of the association for computational linguistics: human language technologies, volume 1 (long and short papers) (pp. 4171-4186).