

Advances in Theoretical & Computational Physics(ATCP)
ISSN: 2639-0108 | DOI: 10.33140/ATCP

Research Article - (2026) Volume 9, Issue 3
AI-Machine Learning Method for Design and Predictive Analysis of Wind Turbine
2Software Engineering Consultant, USA
3DSinnovtech, Illinois, USA
Received Date: May 29, 2026 / Accepted Date: Jul 08, 2026 / Published Date: Aug 04, 2026
Copyright: ©2026 Pradip Majumdar, et al. This is an open-access article distributed under the terms of the Creative Commons Attribution License, which permits unrestricted use, distribution, and reproduction in any medium, provided the original author and source are credited.
Citation: Guha, P., Chakraborty, S., Majumdar, P. (2026). AI-Machine Learning Method for Design and Predictive Analysis of Wind Turbine. Adv Theo Comp Phy, 9(3), 01-16.
Abstract
Wind turbines are electro-mechanical systems designed to harness kinetic energy from wind and convert it into electrical energy using rotor blades and a generator. They are considered one of the leading sources of sustainable power, offering a cleaner alternative to fossil fuels. However, the energy conversion efficiency of most commercial wind turbines remains limited, often between 25% to 40%, far below the theoretical maximum known as Betz’s limit (59.3%). This study aims to investigate design-based performance improvements to achieve a higher efficiency, employing both traditional approaches, such as Blade Element Momentum (BEM) Theory and Computational Fluid Dynamics, as well as advanced Artificial Intelligence techniques, including supervised regression-based Machine Learning (ML) algorithms. The research utilized meteorological data from 19 cities across Illinois, obtained from the Prairie Research Institute’s Illinois State Weather Survey (ISWS). The proposed ML models, trained on historical meteorological data, capture complex nonlinear relationships in turbine performance without requiring explicit physical modeling. By integrating site-specific wind data with aerodynamic modeling, this approach provides a scalable pathway to improving efficiency toward the Betz limit. Furthermore, the methodology incorporates computational strategies to optimize the selection and quantity of representative functions, alongside the weighting factors for critical features, by minimizing both training and validation losses. The proposed methodology offers valuable insight for future turbine designs aiming for high- performance renewable energy systems.
Keywords
Wind Turbine Efficiency, Blade Element Momentum (BEM) Theory, Tip-Speed Ratio (TSR), Power Coefficient (CP), Betz Limit, Aerodynamic Modeling, Computational Fluid Dynamics (CFD), Machine Learning, Wind Data Analysis, Illinois State Weather Survey (ISWS), Rotor Dynamics, Renewable Energy
Nomenclature
Latin Symbols:
• A = Rotor swept area
• a = Axial induction factor (fractional decrease in wind speed at rotor)
• a′ = Tangential induction factor (swirl factor in wake rotation)
• CL = Coefficient of lift force
• CP = Power coefficient (ratio of rotor power to available wind power)
• FD = Drag force
• FL = Lift force
• N = Rotational speed (in rpm)
• Pout = Output power
• R = Radius of the turbine blade
• TSR = Tip-Speed Ratio, ratio of blade tip speed to free stream velocity
• U = Free stream wind velocity (upstream)
• Ub = Perpendicular component of velocity at rotor plane
• Urel = Relative velocity (axial and tangential components combined)
• Utip = Tangential tip speed
Greek Symbols:
• α = Angle of attack (between chord line and incoming relative wind)
• β = Blade pitch angle
• ηo = Overall efficiency
• θp = Section pitch angle (local airfoil orientation)
• θT = Blade twist angle (variation in pitch from root to tip)
• Ω = Angular velocity of the rotor (rad/s)
Introduction
The primary function of a wind turbine is to convert the kinetic energy of moving air masses into electrical energy with maximum possible efficiency (1). The energy conversion efficiency of most commercial wind turbines remains limited, often between 25% to 40% (2), far below the theoretical maximum known as Betz’s limit (59.3%) (2). Modern wind turbines are the result of decades of interdisciplinary innovation, combining reliability with sophisticated design. These systems integrate principles from aerodynamics, structural mechanics, meteorology, and power electronics to function effectively across a wide range of wind conditions and terrains.
Wind turbines generate renewable energy, a clean and sustainable resource that does not deplete natural reserves or emit greenhouse gases during operation. As the global demand for energy continues to rise, wind power has become a vital component in the transition away from fossil fuels. In early 2025, wind energy accounted for a significant portion of the renewable energy mix, contributing 42.5% of the electricity generated from renewable sources (3). Other major renewable sources include hydropower (29.2%) and solar (18.1%) (3). In the US, wind and solar combined make up nearly a quarter (22.5%) of total utility-scale generating capacity (4). In March 2025, wind alone accounted for 14.8% of the US electricity supply (5). The growth of wind energy is driven by falling costs, increased efficiency, and a strong push toward decarbonization goals set by international agreements.
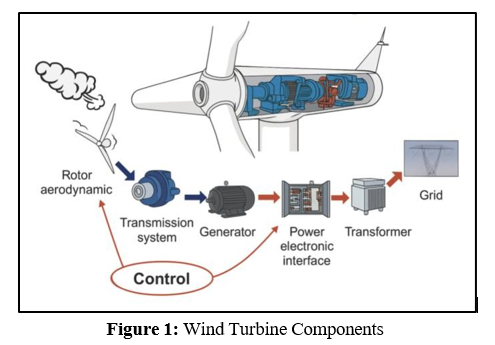
A wind turbine is composed of several key components that work together to convert wind into usable electrical power. The tower is the supporting structure, often ranging in height from 80 to 150 meters (6), designed to elevate the main system into stronger, more consistent wind flows. Mounted at the top of the tower is the nacelle, a large housing that contains many of the turbine's essential systems, including the rotor shaft, transmission system, generator, and control unit. Extending from the nacelle is the rotor, which typically consists of three long, aerodynamic blades attached to a central hub. As wind flows over the blades, it causes the rotor to spin, converting wind energy into mechanical rotational energy.
This rotational motion is transferred through the transmission system, which comprises a low-speed main shaft, mechanical brakes, and, often, a gearbox. The gearbox increases the rotational speed of the slow-turning rotor to match the generator's input requirements. Inside the generator, electromagnetic induction occurs as the rotating magnetic component (the rotor) spins within the stationary coils (the stator), producing electricity. The control system monitors wind speed, direction, and turbine performance, adjusting blade pitch and yaw to optimize efficiency while minimizing mechanical stress and fatigue. Finally, a transformer increases the voltage of the generated power, allowing it to be efficiently transmitted to the electrical grid.
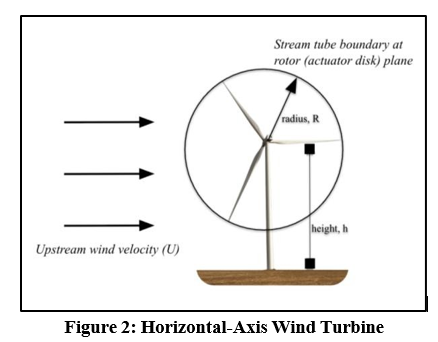
Wind turbines are generally classified based on the orientation of their rotor shaft. Horizontal Axis Wind Turbines (HAWTs) have a rotor shaft aligned parallel to the ground. These turbines must face into the wind, typically using a yaw control system, but they are highly efficient and are by far the most commonly used type in utility-scale wind farms. In contrast, Vertical Axis Wind Turbines (VAWTs) feature a rotor shaft that is perpendicular to the ground and can capture wind from any direction without requiring active alignment. This omnidirectional capability makes them better suited for urban or turbulent wind environments, but they tend to be less efficient and are rarely used in large-scale applications.
Location is a critical factor in wind turbine performance. Turbines are most effective in open areas with steady wind flow and minimal obstructions. Common sites include flat agricultural lands, coastal regions, and offshore zones. Offshore wind farms (7) benefit from higher and more consistent wind speeds, which enable the use of larger turbines with higher capacity factors. As of 2025, the U.S. has surpassed 153 GW of installed wind capacity (8), with offshore developments becoming a rapidly expanding frontier for wind energy production.
To increase energy output and reduce costs, researchers and engineers have long focused on optimizing turbine design.Traditional methods include refining blade geometry using computational fluid dynamics (CFD), testing aerodynamic performance in wind tunnels, and modeling power output using empirical equations based on tip-speed ratio (TSR) and blade pitch angle (β). While these approaches have improved turbine efficiency over time, they often rely on static assumptions or require expensive physical testing.
In recent years, machine learning and regression-based modeling have emerged as powerful tools for optimizing wind turbines. These data-driven methods enable systems to learn from vast datasets—such as long-term weather patterns—and dynamically predict optimal performance parameters for specific environments. By combining real-world meteorological data with intelligent algorithms, this approach offers a more effective pathway to improving power coefficient (CP) and moving closer to the theoretical maximum efficiency known as the Betz limit of 59.3%. The present study applies this methodology using weather data from 19 cities across Illinois, obtained from the Prairie Research Institute’s Illinois State Weather Survey (ISWS) (9), to explore how predictive modeling can theoretically enhance wind turbine efficiency, laying the foundation for more innovative and more sustainable wind energy systems. This paper derives an expression for blade pitch angle based on aerodynamic principles and induction factors and integrates that model with site-specific wind data and regression-based CP optimization to improve wind turbine efficiency toward the theoretical limit.
Literature Review
Enhancing wind turbine performance involves aerodynamic design, advanced control systems, and adaptation to environmental variability. Hasan et al. (2023) (10) modified the rotor blades of a small-scale commercial horizontal-axis wind turbine to improve efficiency at low wind speeds. The study utilized experimental procedures and CFD simulations, resulting in a power coefficient increase of more than 60%. The peak coefficient of power (CP) for the modified rotor, based on NAS SG-series airfoils, reached 0.375–0.385 at a tip-speed ratio (TSR) of about 7, compared to 0.258 for the baseline S-rotor at TSR 5–6. The findings indicate that adjusting turbine geometry to local wind conditions can optimize energy generation.
Fardin and Majumdar (2014, 2016) (11, 12) studied how aerodynamic conditions affect wind turbine performance and noise using 3D CFD and aeroacoustic models. The blades, designed with NREL S825 airfoils for optimal lift and low drag, were evaluated for aerodynamics and noise—especially at the trailing edge, tip, inflow turbulence, and boundary layer separation across various operating scenarios.
Control strategies are vital for efficiency, especially in dynamic conditions. Bonfiglio et al. (2017) (13) introduced a power loss-aware control model for turbines with permanent magnet synchronous generators (PMSGs), which improved voltage regulation and maximum power point tracking by considering internal losses. Similarly, Qais et al. (2020) (14) introduced a transient search optimization (TSO) algorithm to tune proportional-integral controllers in PMSG-based wind systems. Their method improved the system’s low-voltage ride-through (LVRT) performance, which is essential for maintaining grid connection during faults. These studies demonstrate how control system design can directly impact both efficiency and reliability.
Wind turbines are required to respond to real-time changes in wind conditions. Yan et al. (2016) (15) concentrated on enhancing energy capture during partial-load operation, which occurs when wind speeds are below the rated threshold. The proposed approach dynamically adjusted operational parameters to preserve efficiency under variable wind speeds. Extending the concept of adaptive control, Tidjani and Guessoum (2021) (16) implemented a Takagi-Sugeno fuzzy logic controller within a PMSG wind turbine model. Their simulation results indicated that fuzzy control not only increased energy capture in fluctuating wind environments but also ensured operational stability when faced with disturbances.
Gao et al. (2020) (17) analyzed wind turbine performance at low wind speeds and various pitch angles using aerodynamic simulation. Their study identified optimal installation and pitch angles that maximize aerodynamic efficiency under fluctuating wind conditions. To further enhance output, they implemented a control system that combined a PI controller with wind-speed-difference feed-forward signals, enabling more precise turbine response to real-time wind variations.
Sun (2004) (18) analyzed the power generation quality of a grid-connected wind turbine using doubly fed induction generators (DFIG). The grid-connected wind turbine model includes a wind speed model, an aerodynamic model, the mechanical model of the transmission system, and a model for electrical components. The control scheme includes both speed control and pitch control.
Artificial intelligence is being applied to make turbines more adaptive and predictive. Chen et al. (2020) (19) developed an adaptive control system that incorporates neural networks and dynamic programming for real-time maximum power point tracking. The method demonstrated improved response speed and efficiency compared to conventional approaches, especially in rapidly changing wind conditions. Predictive maintenance continues to be a subject of research. Zhou et al. (2024) (20) developed a digital twin model that incorporated vibration data and fatigue analysis to monitor gearbox health in real time. When applied to a 2 MW turbine, the system provided predictions of wear and assisted in planning proactive maintenance schedules, which contributed to extending component life.
Kaminsky et al. (2012) (21) used Computational Fluid Dynamics (CFD) simulations to analyze a horizontal-axis wind turbine equipped with a NACA 0012-34 airfoil under various wind conditions. Their study explored how changes in wind speed (15–30 mph), yaw angle, and blade pitch (0–20°) affected power output. While their CFD setup featured detailed rotor geometry and complex Fluent meshing, our study was inspired solely by their high-level methodology for simulating blade behavior across varied operational conditions.
These studies show that merging AI with design and control methods can greatly boost wind turbine performance, resilience, and efficiency. Optimizing rotor designs along with adaptive controls and predictive diagnostics allows modern turbines to handle environmental and operational shifts more effectively.
Objective
The objective of this study is to demonstrate the use of different design methodologies combining aerodynamic principles with modern computational tools to improve wind turbine design and performance prediction, and how blade geometry and operating conditions affect wind turbine performance. Blade Element Momentum (BEM) Theory and Computational Fluid Dynamics (CFD) model-based analysis methodologies that are commonly used are briefly discussed. Specifically, this study focuses on developing an AI/machine learning based model that utilizes wind turbine historical performance data obtained experimentally and by a high-fidelity simulation model.
Materials
Aerodynamic and Operating Principles of Wind Turbines
In this section, we present a brief description of the principles and critical parameters that define the operation of the wind turbine.
Wind turbine power generation depends on the interaction between the bla
de rotor and the wind. Wind turbine performance in terms of net power output is determined by the aerodynamic forces generated by the wind, and power generation depends directly on the geometry and operating parameters of the blades, along with their interactions with the wind. Understanding the turbine performance is centered around the principles of air flow dynamics and the generated aerodynamic forces around the airfoil-shaped wind turbine blade designs.
Wind turbine blades are essentially rotating airfoils that generate lift as wind flows around them, enabling the conversion of linear wind motion into rotational motion. Wind turbine design uses airfoil-shaped blades to transform the kinetic energy in the wind into usable mechanical energy.
Wind turbine design starts with the analysis and selection of airfoil-shaped blades and computation of the aerodynamic characteristics of the blade, leading to the optimum selection of the airfoil-blade shape.
As air flows over the wind turbine blades, the variation of the velocity and pressure fields around the wind turbine results in aerodynamic forces such as the drag force, as well as the lift force that is generated due to the difference in high-pressure variation over the bottom of the surface airfoil-shaped wind turbine blades compared to that over the top surface. Conversion of kinetic energy of the wind to mechanical energy involves the generation of a positive torque on the rotor shaft, generated by lift forces on the blade surfaces. Studying air flow dynamics and aerodynamic forces on the blades caused by wind is the first step to analyzing wind turbine performance.
Blade Element Momentum (BEM) Theory
Some initial wind turbine performance characterizations are made using an idealized model known as Blade Element Momentum (BEM) Theory, which assumes an idealized wind turbine with an infinite number of blades without aerodynamic loss, fictional drag, and wake effect. This model is based on one very important theory: the BEM Theory, which calculates the performance characteristics of an annular section and then integrates the value over the entire blade. This is followed by considering the shape and characteristics of the airfoil.
The BEM theory evaluates wind turbine performance considering the rotor blade to be divided into small sections and its local aerodynamic behavior, such as the local lift and drag forces as a function of the local wind conditions, airfoil geometry, and blade rotational speed. The local values are then integrated over the entire blade surface. The variations of the axial and tangential components of wind velocity at the rotor blade section are considered. The axial component is reduced by the turbine’s energy extraction, while the tangential component arises due to blade rotation and induces a swirl in the airflow behind the rotor. These effects are captured by the axial induction factor, a, and the tangential induction factor, a', which describe how much the wind slows down and spins, respectively, as it passes through the rotor.
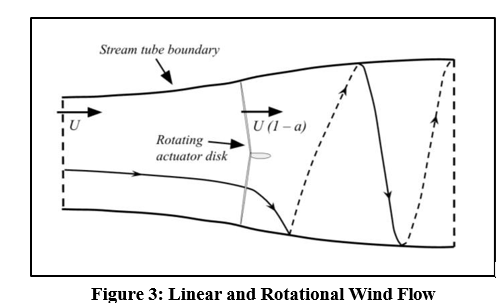

where Ub is the component of the wind velocity perpendicular to the rotor plane and a is the axial induction factor defined as a fractional decrease in the wind speed compared to the incoming upstream wind speed. This factor takes into account the fraction decrease in wind velocity from the free upstream location to the rotor plane wind velocity. An increase in the value of the axial induction factor results in a reduction of the wind speed behind the wind turbine. The value of the axial induction factor for an ideal wind turbine falls in the range of 0.25-0.5, where a = 0.33 is the optimal value to generate the highest power possible. Any higher and that means the turbine isn’t slowing the wind enough to use it; any lower and there is less wind to absorb and turn into power. For a real wind turbine, as the value approaches 0.5 and higher, the flow becomes increasingly unstable, with separation and complex wake formation behind the rotor.
For a rotating wind turbine rotor, the flow behind the rotor rotates in the opposite direction to the rotor as a reaction. This results in a reduction in the amount extracted by the rotor compared to the case without the wake rotation. Tangential Induction Factor, a', considers the generation of angular momentum or spins in the flow behind the rotating wind turbine.
The power output (Pout) of the wind turbine is computed as:

This expression shows that turbine performance depends strongly on both geometric design and operating parameters.
Airfoil Blade Geometry and Parameters
Figure 4 below illustrates the fundamental geometry of wind turbine airfoil blades. The leading edge is the foremost point of contact between the blade and incoming airflow, whereas the trailing edge is where the airflow departs. The chord line, defined as the straight line joining the leading and trailing edges, exhibits a variable length, referred to as chord length along the blade’s span. The blade's shape is defined by its mean camber line, marking the midpoint between upper and lower surfaces. The camber (degree of curvature) and blade thickness affect lift and drag.
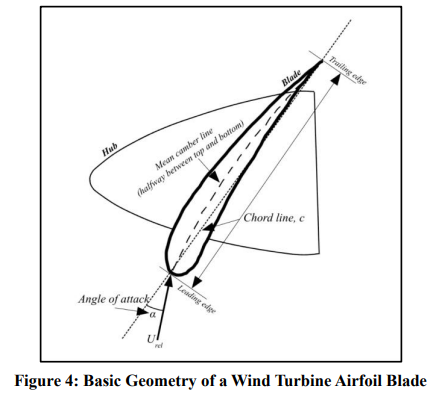
One of the most critical parameters is the angle of attack, denoted α, which is defined as the angle between the chord line and the incoming relative wind. This angle directly affects the lift generated by the blade: too low and lift is insufficient; too high and the blade risks stalling due to flow separation. Below are the geometrical and operational parameters of the wind turbine.
Tangential tip speed:
The blade tip moves tangentially as the rotor spins. Its velocity is proportional to the rotor’s angular velocity and radius:

Where:
Ω = the rotor angular velocity (rad/s),
Utip = the tangential tip speed,
R = the rotor radius,
a' = the tangential induction factor.
This value determines how fast the blade moves relative to the incoming wind.
Axial velocity at the blade:
As the rotor extracts energy, the wind slows down at the rotor plane. The reduced velocity, as mentioned before, is expressed as:

This reduction in speed represents how much energy the turbine extracts from the flow.
Relative wind speed at the blade section:
The actual airflow experienced by the blade is a combination of the axial component and the tangential component induced by blade rotation. The resulting relative velocity Urel is:
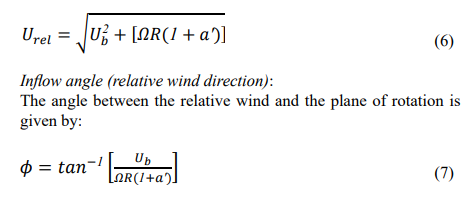
This inflow angle determines the effective angle of attack of the blade and is critical for aerodynamic performance.
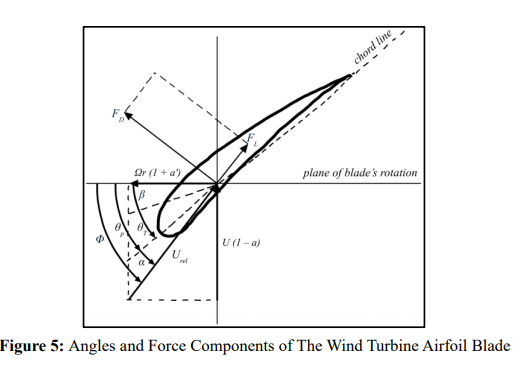
Blade pitch angle refers to how the blade is rotated along its length, which manages the angle of attack and power output as wind changes. At any point on the blade, the section pitch angle θp defines the local airfoil orientation.
Blade Twist and Pitch Angles:
The blade twist angle (θT) describes how the blade’s pitch varies from root to tip, ensuring that each section maintains an optimal aerodynamic loading. The blade pitch angle (β) is a geometric parameter that refers to how the blade is rotated along its length, which manages the angle of attack and power output as wind changes. At any point on the blade, the section pitch angle θp defines the local airfoil orientation. It is defined as the angle between the chord line of the blade section and the plane of rotation.
By adjusting β, turbines regulate lift, drag, and power output under different wind conditions. The pitch angle is typically adjusted to achieve a desirable lift-to-drag ratio and power output. According to the BET, the blade pitch angle β is calculated using aerodynamic and geometric relationships from a representative blade section, as illustrated in Figure 5, and can be expressed as follows:
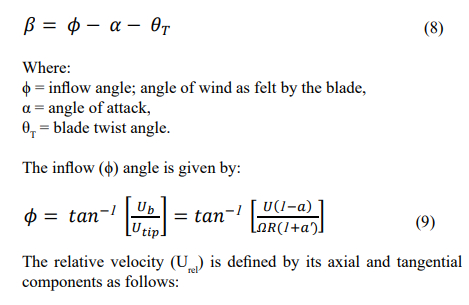

Relative velocity, angle of attack, and airfoil shape together determine the lift and drag forces acting on the airfoil section, and therefore the torque and power generated by the rotor.
Dimensionless Performance Parameters
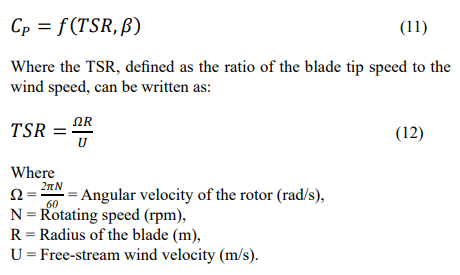
As we can see from equation 10, numerous input variables define the performance of the wind turbines. For analysis purposes, wind turbine performance is defined in terms of dimensionless parameters such as the coefficient of power (CP), tip-speed ratio (TSR), and blade pitch angle (β).
The relationship can be written as:
Power Coefficient and Extracted Power
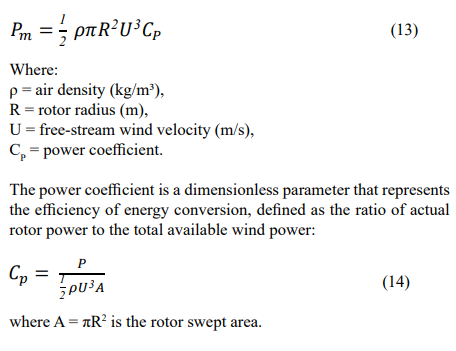
The mechanical power extracted from the wind turbine, with wind passing through the turbine rotor, is given as:
Lessons learned from BEM Theory
This section summarizes how aerodynamic and geometric parameters influence wind turbine performance, with a focus on the blade pitch angle (β), as derived from Blade Element Momentum (BEM) Theory.
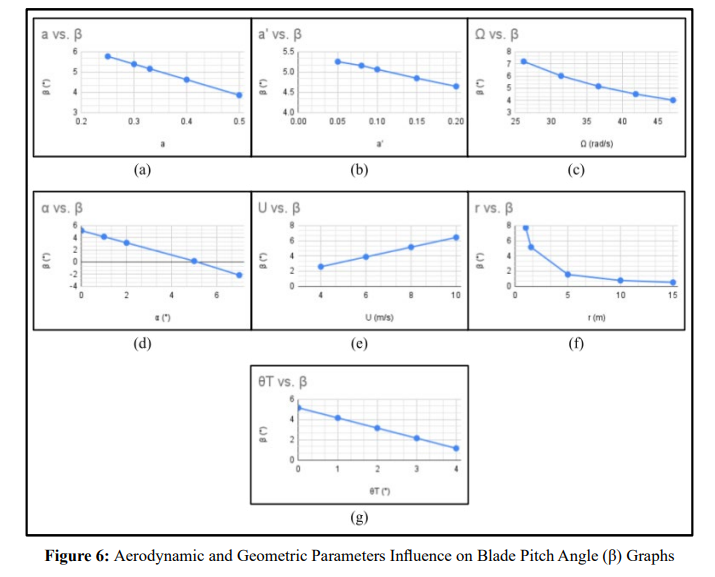
The above graphs illustrate how variations in aerodynamic and geometric parameters influence the optimal blade pitch angle (β), as derived from Blade Element Momentum (BEM) Theory, and how these adjustments connect to turbine efficiency. As axial induction (a) increases, the velocity through the rotor slows, and the blade must pitch down to keep each section close to its efficient angle of attack (Figure 6a). This behavior aligns with the classical actuator-disk result, where the power coefficient follows CP(a) = 4a(1−a)2 and reaches its maximum at a = 1/3. In practice, operating near this point requires careful control of β, since too large a value pushes the blade toward stall while too small a value reduces lift.
Wind speed (U) tells the opposite story (Figure 6e). At higher inflow velocities, the pitch angle increases as the blades are feathered to limit aerodynamic loads. Here, efficiency is deliberately traded for safety: the turbine sacrifices some CP in strong winds to avoid overstressing the structure and to maintain reliable operation over time.
Geometry adds another layer to the picture. The steady decrease in pitch from root to tip reflects the built-in blade twist (Figure 6g), which equalizes the aerodynamic loading across the span despite large differences in local tangential speed. A well-designed twist reduces the amount of active pitch adjustment needed, keeping the turbine closer to its optimal operating state under varying conditions. Other factors also influence pitch behavior: tangential induction (a′) introduces swirl losses that require slight adjustments (Figure 6b), rotor speed (Ω) alters the effective inflow angle (Figure 6c), angle of attack (α) directly sets the stall margin (Figure 6d), and radial position along the blade (r) reflects the spanwise variation in aerodynamic loading (Figure 6f).
Taken together, these relationships illustrate that pitch is not just a control variable but the key link between aerodynamics, geometry, and turbine performance. By responding dynamically to induction factors, inflow, and spanwise effects, β enables turbines to operate near their theoretical efficiency limits while respecting the structural constraints imposed by real-world wind conditions.
Design Analysis based on CFD
A comprehensive method for assessing the performance of wind turbines, considering the complex airfoil blade design and associated aerodynamic losses, involves conducting Computational Fluid Dynamics (CFD) analysis, subsequently followed by physical testing of a scaled-down prototype. The annotated figure below from Kaminsky et al. (2012) illustrates a representative CFD-generated pressure distribution around an airfoil-shaped wind turbine blade at a 15-degree angle of attack and a wind speed of 15 mph (21).
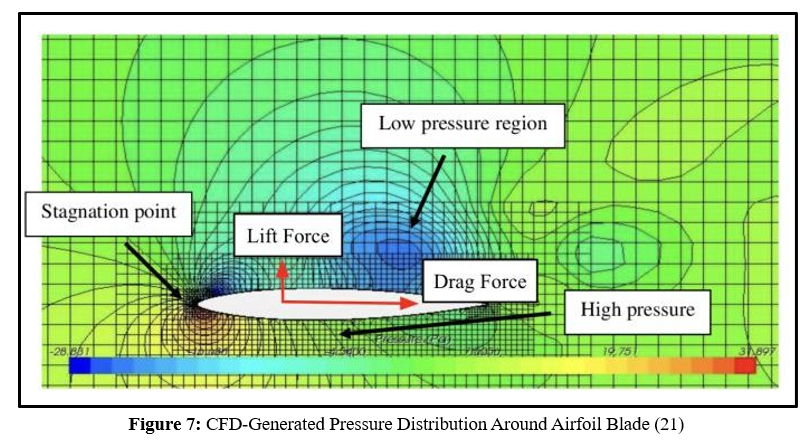
Lift force, related torque, and mechanical power are calculated based on the pressure distribution over the blade surfaces.
Wind turbine design begins with choosing an airfoil-shaped blade and calculating flow dynamics around both the blade and the entire turbine. Knowledge of aerodynamic principles is important for improving the efficiency of energy extraction by the rotor. Evaluating the aerodynamic properties of the blades helps determine the most suitable blade shape. Advanced physics-based simulation models are capable of producing digital representations that reflect wind turbine performance.
Computational fluid dynamics (CFD) and aeroacoustics analysis are used in the design of wind turbines to improve efficiency and reduce low-frequency noise. The aerodynamic performance of a wind turbine can be evaluated by analyzing velocity and pressure distribution data across its surfaces as well as in the wake region, as shown in the figure below.
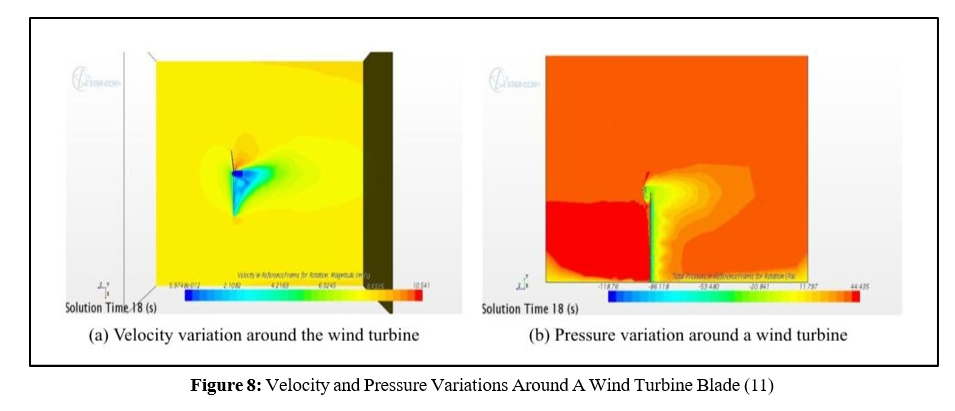
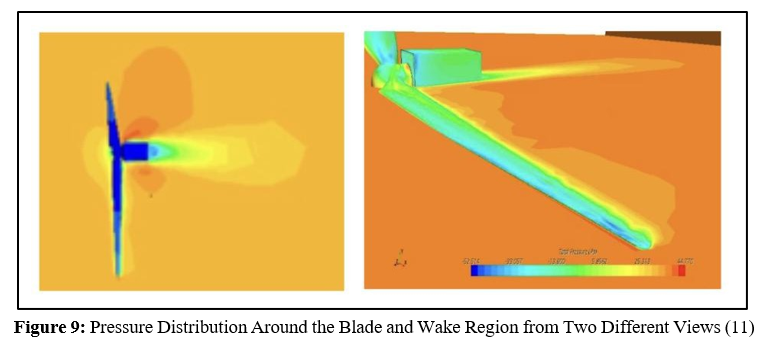
The pressure distributions on the blades are utilized to calculate lift and drag forces, as well as the resulting torque and power output.
Some of the limitations of high-fidelity CFD simulation models are:
i. Only a limited number of design iterations can be run.
ii. Workflow setup requires extensive manual effort.
iii. Simulations demand very large computational grids and small time steps.
iv. A large number of geometric and operating parameters must be considered.
v. CFD is computationally expensive and time-consuming.
Wind and Wind Surface Terrain
An important factor in wind turbine design is wind shear, which describes how wind speed changes from ground level to the hub height. Due to the no-slip condition, wind speed increases from zero at the surface to higher values aloft. When using meteorological data, typically collected at 10 meters, adjustments are needed to estimate wind speeds at turbine hub height. This variation is often modeled using empirical profiles such as the logarithmic law profile or power law profile, as shown below.
Logarithmic wind profile:

Where:
Uhub = Wind speed at hub height (m),
Usensor = Wind speed at sensor height (m),
Zhub = Wind turbine hub height (m),
Zsensor = Sensor height (~10 m),
Z0 = Ground surface roughness.
The ground surface rough value varies significantly from 0.00001m for a smooth surface like the sea surface to as high as 3.0 m in the city center area.
Power law profile:

where n is the power law exponent index (commonly n = 7).
Methods
Weather Data
Weather data for this study is sourced from the Illinois Climate Network, part of the Illinois State Water Survey (ISWS). Records from 19 stations statewide date back to 1989 and include daily year, month, and day, as well as average wind speed (mph), direction (degrees), and air temperature (°F). This comprehensive dataset reveals regional and temporal variations in Illinois' wind and temperature. In this study, some data for the city of Springfield is reveals regional and temporal variations in Illinois' wind and temperature. In this study, some data for the city of Springfield is
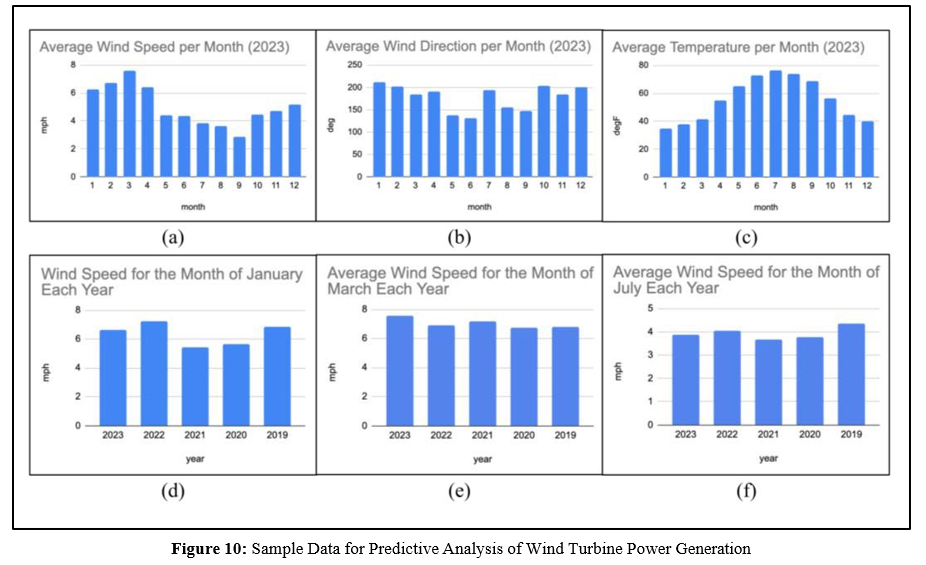
Figure 10a indicates that wind speeds are much higher in winter months than summer months across the Midwest USA. On average, annual wind speed is about 6.4 mph.
Regression-based Machine Learning Model
Wind turbine design involves balancing many parameters and constraints, often requiring multiple iterations to resolve trade-offs before prototyping. While advanced physics-based simulations and high-fidelity computational fluid dynamics (CFD) models can generate detailed digital models that accurately replicate wind turbine performance and accurately predict performance, they are time-consuming and resource-intensive. These methods limit the number of design variants that can be evaluated due to significant computation and manual input requirements.
Recent advances in Artificial Intelligence (AI) techniques, including progress in data sciences, AI algorithms, and AI-accelerated edge devices, are enabling new possibilities for modeling and design analysis of complex engineering problems, such as the wind turbine for power generation. Artificial Intelligence methods such as Machine Learning (ML) are increasingly being used for design and predictive analysis of a wide variety of complex engineering and science problems.
An AI machine Learning model is designed to use historical data as well as real-time streaming data and data analysis techniques to watch for patterns.
ML models are being developed for such problems involving a large number of non-linear parameters by watching and understanding the patterns and dependence of major features on the behaviour or outcomes using historical data without physically modelling the associated complex phenomena. Predicting analysis model is built by implementing ML algorithms using historical weather data.
This study includes a review of the design analysis of wind turbines using a supervised regression-based machine learning algorithm. Additionally, it incorporates computational components to optimize both the quantity and selection of representative functions, as well as the weighting factors for key features, by minimizing training and validation losses. Further, this study explores predictive analysis of the wind turbine performance using weather data for different regions of the USA, as well as suggesting adjustments to the key wind turbine operating parameters such as pitch angle and rotation speed. Such a model can not only be used for predictive analysis of the wind turbine design for selection purposes, but also for optimum operation control of the wind turbine using an edge device with an embedded AI-ML model. Figure 11 below shows the basic operation of an AI-ML-based predictive analysis and control of the wind turbine.
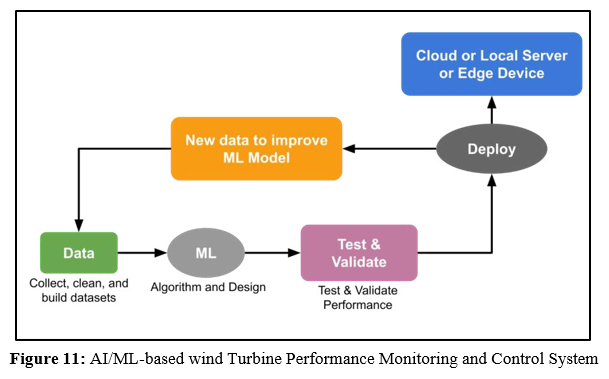
In an AI-Machine learning model, a detection algorithm, referred to as the Trained ML Algorithm, is embedded in the edge device to watch for the pattern in the incoming wind data that is continuously streamed from the sensors and make an inference on the wind turbine performance, and instantaneously modifies the wind turbine operating parameters, such as pitch angle and rotor speed. Through the use of the microcontroller in the edge device. The data includes historical. The model can detect and understand patterns between input wind turbine features and the targeted output, such as the power output, and make predictions and recommendations. The model is also capable of self-correction and improving predictions through iterations or epochs using a new set of data and experiences, over periods. This process is referred to as the learning process. Figure 11 shows a typical machine learning model.
Development of AI-ML Training Model
The AI predictive analysis model used in this study is based on our own multivariable polynomial regression algorithm, which is one of the common supervised machine learning models. The algorithm analyzes how wind turbine design and operational variables affect performance outcomes such as power output, efficiency, or near-field noise generation. During training, the model defines the relationship between key features and outcomes by refining polynomial functions, their order, and adjusting weights to minimize error. The process includes choosing functional forms and optimizing weighting factors. For example:

Where: xi = Independent feature or variables,
Fk = Functional forms,
Ck = Coefficients of each functional form,
k, i = Indices representing the independent features and functions.
Results
Statistical Approach
The training model’s optimal form is reached by iteratively monitoring errors and weighting factors until the desired tolerance is met. Table 1 shows a sample of the dataset used for training the ML model. This data set was formed based on multiple sources representing both experimental and CFD analysis studies for a horizontally mounted wind turbine.
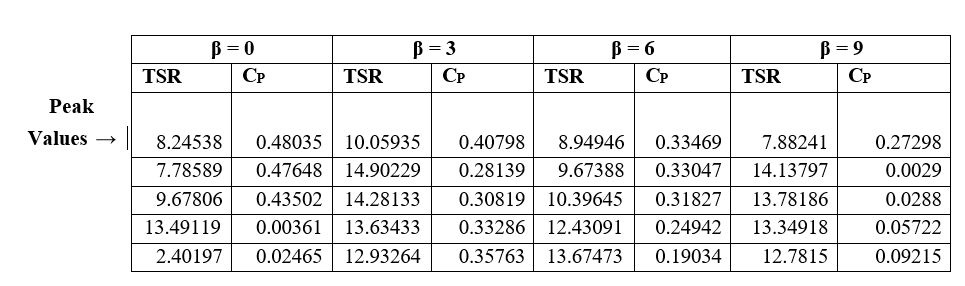
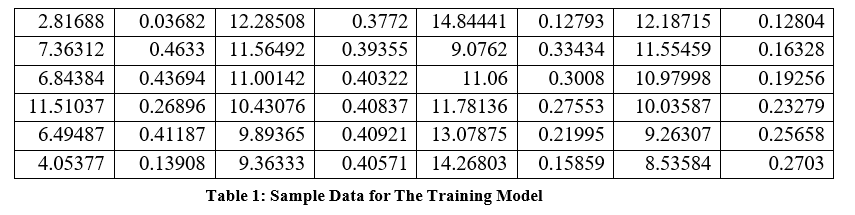
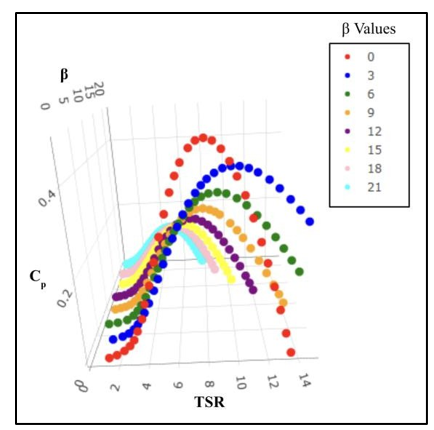
Figure 12: Three-dimensional representation of the performance in terms of the coefficient of power (CP) as a function of tip-speed ratio (TSR) for different blade pitch angles (β)
The proprietary training model relies on published historical performance data from high-fidelity simulations and experimental validation (10, 18). Figure 12 above shows power coefficient changes for a 1-kW horizontal-axis wind turbine. The study uses this data, covering β from 0°–20° and TSRs varying by β, for training. The figure shows how the power coefficient (CP) of a wind turbine varies with β and TSR for a commercial model. CP reaches its maximum at specific values of TSR and pitch angle, indicating higher performance when the pitch angle is close to zero. For instance, when the pitch angle is zero, the maximum CP values are approximately 0.48, and these peak values decrease as the pitch angle increases. Additionally, the operating range of TSR expands with increasing blade pitch angle. This dataset provides experimental validation for aerodynamic models, serving as a benchmark for comparing computational predictions and machine learning outcomes. Accuracy of the training model is established by monitoring Root Mean Square Error (RMS) and R-Squared (R²). The final training model function is represented by RMSE of 0.000205 and R² of 0.9999.
The model can be updated and enhanced to accommodate larger wind turbine sizes and a broader range of parameters, including different power ratings, rotor sizes, and operating speeds, as new data becomes available.
The model is further validated using an additional dataset shown below:
|
Wind Speed 4 m/s |
Wind Speed 5 m/s |
Wind Speed 6 m/s |
|||
|
CP |
TSR |
CP |
TSR |
CP |
TSR |
|
1.004833574 |
0.009829666712 |
0.9916003588 |
0.01213936574 |
1.005835779 |
0.009999605818 |
|
1.997571759 |
0.03074567423 |
1.991355709 |
0.04091815587 |
1.997010132 |
0.03269502148 |
|
2.995624585 |
0.08449705269 |
2.992975057 |
0.08836350839 |
2.993765572 |
0.09005794474 |
|
3.99789247 |
0.2841225892 |
3.99016741 |
0.2903687483 |
3.994551797 |
0.2938294769 |
|
4.995441321 |
0.3478131173 |
4.989782961 |
0.3489633598 |
4.995869553 |
0.3548866727 |
|
5.978741438 |
0.3751648195 |
5.988699512 |
0.3817964259 |
5.989612978 |
0.3840955497 |
|
6.977160791 |
0.3803105191 |
6.995258455 |
0.3836124037 |
6.988450252 |
0.3862477827 |
|
7.985980345 |
0.3648067784 |
8.000745599 |
0.3664661948 |
7.986534522 |
0.3684102645 |
Table 2: Sample Data for the validation model
This data, adapted from Hasan et al. (2022), shows the relationship between the power coefficient (CP) and tip-speed ratio (TSR) for a commercial 1 kW small-scale horizontal-axis wind turbine tested under wind speeds of 4, 5, and 6 m/s (10). The curves illustrate how turbine efficiency varies with operating conditions: CP rises with TSR until reaching a peak (around 6–8), after which aerodynamic losses reduce performance. The maximum CP values reported range between ~0.27 and ~0.48, depending on wind speed, aligning well with theoretical expectations for small turbines.
Parametric Study
The developed machine learning model assesses key design parameters for a small commercial wind turbine using parametric analysis. The study examines parameter ranges shown in the table below. An automated algorithm optimizes the peak CP by adjusting the TSR and β. For example, changes to the rotor radius are balanced by modifying rotational speed (RPM) to maintain optimal performance.
Figure 13 illustrates the results of performance for different angles of attack and rotor radius at a wind speed of 8 m/s. Figure 13b presents all feasible outcomes in a 3D plot for CP as a function of TSR and β.
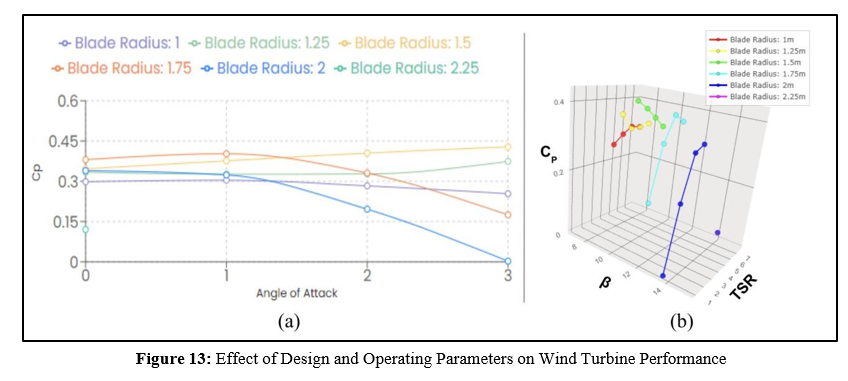
Figure 13a illustrates the influence of angle of attack on performance, measured by the coefficient of power, for a wind speed of 8 m/s, rotor radius of 1.5 m, and rotational speed of 300 rpm. The resulting power performance curves, represented as CP = f(TSR, β), are also depicted. It is observed that the three-dimensional power characteristics vary according to the angle of attack, due to corresponding changes in pitch angles. Consistent with expectations, optimal performance is achieved at a zero angle of attack.
The experimental dataset for this study comes from Hasan et al. (2022), who tested a commercial 1 kW small-scale horizontal axis wind turbine (SSHAWT) at Benha University, Egypt. Their work measured the power coefficient (CP) against the tip-speed ratio (TSR) at wind speeds of 4, 5, and 6 m/s, as reported in Figures 18–20 of their paper (10). Using a full-scale turbine equipped with a permanent magnet synchronous generator, they captured performance data under controlled laboratory conditions that closely reflect really low-wind environments. These CP–TSR curves serve as a reliable reference point in this paper, providing experimental validation against which aerodynamic modeling and predictive methods can be compared.
Predictive Model and Analysis of Results
Power generation quality can be evaluated using historical wind speed data from comparable turbines at various sites. The data reveals notable wind speed variations daily, monthly, and yearly. Control schemes regulate operating speed and angle of attack in response to wind speed changes. The power generation model considered changes in wind speed at the rotor hub, terrain roughness, boundary effects, and calculated the relative speed at the rotor blade. During analysis, it was found that predictions were highly sensitive to selected operating parameters, such as pitch angle and TSA, which sometimes fell outside the model's training range. For periods of very low wind speed, turbine rotation was adjusted to ensure machine learning inputs remained within acceptable limits.
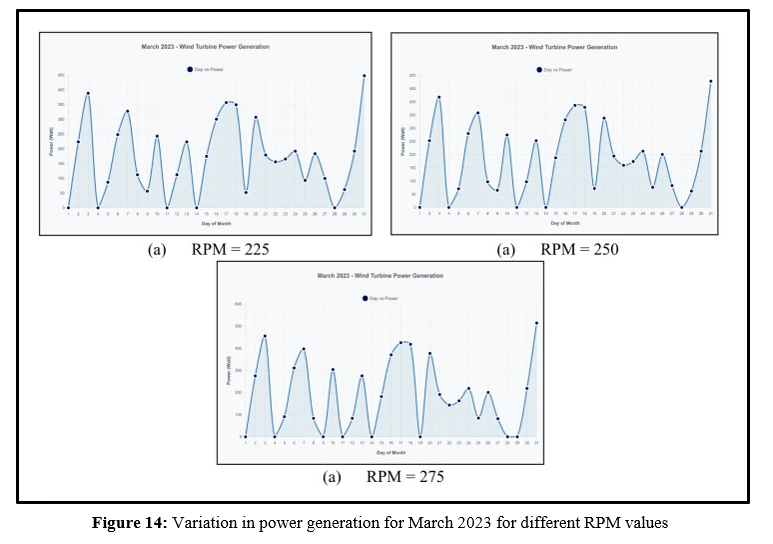
The predictive model estimates monthly power generation in 2023. The figure displays daily output at Springfield for March. To retain machine learning accuracy and maximize power output, the rotor speed is set between 225 and 275 rpm based on wind conditions observed in March. A day with 0 power output means that the wind speed was so low that it isn’t worth turning the turbines on. Figure 14a, with the rotor set at 225 rpm, shows only five days without power generation, with output between 55 W and 450 W, and an average monthly power generation of 206.76 Watts/7443.45 kWh. Figure 14b, with the rotor set at 250 rpm, also shows five days without power generation, with output between 65 W and 485 W, and an average monthly power generation of 223.10 Watts/8031.69 kWh. Figure 14c, with the rotor set at 275 rpm, shows eight days without power generation, with output between 80 W and 520 W, and an average monthly power generation of 256.91 Watts/9248.80 kWh. Average power increases at higher rpm; for example, at 225 and 275 rpm (Figure 14a and Figure 14c), average monthly generation rose by approximately 25%.
Conclusion
A supervised regression-based machine learning model is developed to capture nonlinear patterns and forecast power output under varying wind conditions. By linking physics-based methods and using historical performance data set, some detailed insight into the behavior of a wind turbine with varying weather data is obtained based on this AI-driven analysis. This study presents an approach for improving turbine efficiency through the selection of wind turbine design parameters and operating conditions, utilizing an integrated method that combines physics-based historical data with advanced AI and machine learning techniques. This framework also provides valuable guidance for future high-performance renewable energy systems, including adaptive control and predictive maintenance strategies.
References
- U.S. Department of Energy. (n.d.). How do wind turbines work?
- Vernier Science Education. (n.d.). Turbine eficiency.
- Eurostat. (2025). Share of electricity from renewables falls in early 2025.
- Lewis, M. (2025). FERC: Solar + wind made up 98% of new US power generating capacity in Q1 2025. Electrek.
- Lewis, M. (2025). US wind + solar outproduced coal and nuclear in Q1 2025 – EIA. Electrek.
- Hartman, L. (2024). Wind turbines: The bigger, the better.U.S. Department of Energy.
- WINDExchange. (n.d.). Offshore wind energy. U.S. Department of Energy.
- Lewis, M. (2025). Renewables provided 90% of new US capacity in 2024 – FERC. Electrek.
- Illinois State Water Survey. (2024). Illinois Climate Network: Weather data.
- Hasan, M., Eltayesh, A., Awaad, M., & El-Batsh, M. (2023). Experimental examination for the electric power generation of a commercial small-scale wind turbine with modified aerodynamic design. Alexandria Engineering Journal, 64, 25–39.
- Khalili, F., & Majumdar, P. (2014). Three-dimensional CFD simulation and aeroacoustics analysis of wind turbines. ResearchGate.
- Khalili, F., Majumdar, P., & Zeyghami, M. (2015). Far-field noise prediction of wind turbines at different receivers and wind speeds: A computational study. In Proceedings of the ASME International Mechanical Engineering Congress and Exposition (Vol. 7B, Paper V07BT09A051). ASME.
- Bonfiglio, A., Delfino, F., Invernizzi, M., & Procopio, R. (2017). Modeling and maximum power point tracking control of wind generating units equipped with permanent magnet synchronous generators in presence of losses. Energies, 10(1), Article 102.
- Qais, H., Hasanien, H. M., & Alghuwainem, S. (2020). Optimal transient search algorithm-based PI controllers for enhancing low voltage ride-through ability of grid-linked PMSG-based wind turbine. Electronics, 9(11), Article 1807.
- Yan, Z., Yu, V., Shaltout, L., Cheong, C., & Chen, D. (2016). Maximizing wind energy capture for speed-constrained wind turbines during partial load operation. Journal of Dynamic Systems, Measurement, and Control, 138(9), Article 091014.
- Tidjani, A., & Guessoum, A. (2021). Augmented robust T-S fuzzy control based PMSG wind turbine improved with H∞ performance. International Journal of Power Electronics and Drive Systems, 12(1), 585–596.
- Gao, X., Wang, X., & He, J. (2020). Optimal control of pitch angle of large wind turbine based on speed differential. E3S Web of Conferences, 194, Article 03008.
- Sun, T. (2004). Power quality of grid-connected wind turbines with DFIG and their interaction with the grid (Doctoral dissertation, Aalborg University). Aalborg University.
- Chen, P., Han, D., & Li, K. (2020). Robust adaptive control of maximum power point tracking for wind power system. IEEE Access, 8, 214538–214550.
- Zhou, Y., Zhou, J., Cui, Q., Wen, J., & Fei, X. (2024). Digital twin-driven online intelligent assessment of wind turbine gearbox. Wind Energy, 27(8), 797–815.
- Kaminsky, C., Filush, A., Kasprzak, P., & Mokhtar, W. A. (2012). A CFD study of wind turbine aerodynamics. American Society for Engineering Education.