
International Journal of Forensic Research(IJFR)
ISSN: 2767-2972 | DOI: 10.33140/IJFR
Impact Factor: 1.9

Research Article - (2020) Volume 1, Issue 1
Age Estimation - 18 Years old I3M Cutoff Value: Specificity Approach Resulting Confidence Increase
2Ph.D Professor, Department of Radiology, School of Dentistry, University of Sa?o Paulo, Brazil
3Ph.D Student, Department of Community Dentistry, School of Dentistry, University of Sa?o Paulo, Brazil
4Graduate Students, Department of Community Dentistry, School of Dentistry, University of Sa?o Paulo, Brazil
Received Date: Sep 09, 2020 / Accepted Date: Sep 15, 2020 / Published Date: Sep 21, 2020
Copyright: ©Copyright: ©2020 Mazzilli Luiz Eugenio Nigro. This is an open-access article distributed under the terms of the Creative Commons Attribution License, which permits unrestricted use, distribution, and reproduction in any medium, provided the original author and source are credited.
Abstract
Objectives: From an administrative or forensic point of view, the need to estimate the age of living people who do not have hold valid documents is crucial. In this sense 18 years, old cutoff values are of great importance due to civil and criminal imputability in the majority of countries. Different medicine and forensic dentistry methods are used to estimate age. Among them, the development of dental elements is one of the most reliable. This study aimed to apply and discuss sex-specific cutoff 18 years old discriminant ratios advantages over sex-pooled reference value to improve accuracy and specificity over Cameriere et al.’s (2008) method in a Southern Brazilian Sample.
Methods: After prior ethical authorization (CAAE: 82403918.0.0000.0075), three experienced examiners measured using Fiji-Image J software, 354 digital panoramic radiographs of individuals aged 14 to 23 years old, to obtain the dental maturity indices (I3m). Based on the sensitivity and specificity criteria (ROC curve), different cutoff values were tested for males and for females.
Results: The inter-examiner agreement verified by Intraclass Correlation Coefficient (ICC) was 0.89. Based on post-test results, the 18-year I3m accuracy ranged from 98% to 94% throughout the tested cutoff values, and was 98% for females (I3m =0.09), 96% for males (I3m = 0.07), and 94% for sex-pooled individuals (I3m = 0.08). Sex-pooled sensitivity values where higher when I3m = 0.09, whereas specificity values were higher when I3m = 0.08. Sex-specific cutoff values expressed an increase in female Specificity (+2%) at 0.09 considered the sex-pooled value of 0.08, while best male specificity was observed at 0.08 I3m values.
Conclusions: Considering the discriminating objective for estimating the age of 18 years old and its forensic impact, it must be observed the greater importance of the specificity of the test in order to minimize false positives than the overall accuracy. In this sense, we can conclude that even being a forensic reliable option the use of 0.08 sex-pooled I3m ratio, sex specific I3m ratios m
Keywords
Age Estimation, I3m Dental Maturity Index, Civil and Criminal Imputability, Accuracy, Specificity
Introduction
Age estimation plays an important role in forensic practices, mainly by supporting civil and criminal decisions, and dental age (DA) estimation is one of the most widely used and reliable scientific approaches in the field of forensic medicine. Nevertheless, one of the pending concerns is how closely and accurately can true chronological age be predicted, considering that slight differences may deeply change court decisions. One of the most cited problems related with this issue involves the question of determining the age at which civil and criminal liability apply, i.e., the legal age. Legal age is the age limit at which the law considers an individual to have reached adulthood [1, 2]. At the borderline age of civil and criminal liability, the prediction confidence interval is a critical factor in determining whether a person of unknown age is considered a minor or an adult in court. Worldwide, the legal age ranges from 16 to 18, the latter being the most commonly accepted. Depending on the specific legal requirements of the country involved, the probability of an expert’s prediction being accurate must be above 90% for criminal matters, and above 51% for civil matters [3].
Therefore, particularly when dealing with the liability of borderline age cases, it is imperative that the age estimation method be non-invasive and highly accurate in distinguishing minors from adults [4].
Although distinct approaches have been taken to dental age estimation in living people, the effectiveness of the chosen method depends on specific circumstances, such as the examinee’s presumed age class interval, the local resources available, and, particularly, the specific question being addressed [5]. More specifically, one of the few (if not the only) criteria available to distinguish adults from minors based on a dental investigation is the development of the third molar tooth, whose complete maturation occurs approximately at the age of 18 years old.
Contemporary forensic methods employed to address living 16-18 year-olds are based mainly on radiographic examination, and can be summarized in two major approaches: (i) based on an assessment of the development stage of third molars, and (ii) based on dental measurements and ratios, such as Drusini et al coronal index or Cameriere et al third molar maturity index (I3m) [2, 5-8].
Naturally, the method(s) preferred by each forensic expert may vary depending on the specific case, but it is commonly argued in the literature that developmental analyses are likely to involve subjectivity in stage assignation and, consequently, have the potential to a be associated with a higher degree of intra and inter-observer disagreement [9]. The enthusiasts of the dental-mensuration approach, in turn, underline its potential to reduce subjectivity, although requiring more hardware resources and hand-skill training for personnel.
Irrespective of the approach taken—whether developmental staging or dental measurements—the differences among distinct world populations with respect to dental development are an issue referred to in the literature, and several authors have stressed that it is imperative that the validity of any method established for a specific population should have already been quantified for the intended application, particularly when dealing with civil and criminal imputability [1, 4, 3].
Bearing this in mind, the present study was designed to assess chronological age to discriminate adulthood based on orthopantomographs using the method of Cameriere et al [2]. Although accurate results have been obtained worldwide with the I3m method since the original reference study was published in 2008, sensitivity and specificity variations have been observed when applied to different populations. For example, considering a cutoff value of 0.08, the method showed almost perfect results in a Turkish population, whereas its accuracy decreased to values between 72% and 76% in a Saudi Arabian population [10, 11]. These results suggest that studies should explore different cutoff values not only to increase accuracy, but also to increase specificity for the population tested. Another relevant aspect to this issue involves sex-specific cutoff values. The great majority of studies have used the same cutoff values for both sexes, even though there are unequivocal tooth developmental differences between males and females. The use of sex-specific I3m cutoff values may have the potential to increase accuracy and thus minimize false-positive results.
That being said, the aim of the present study was to quantify the accuracy of the Cameriere I3M 0.08 index in a Southeastern Brazilian sample, and to investigate potential advantages of using specific cutoff values for male and female subjects [2].
Materials and Method
A retrospective cross-sectional study was carried out on 354 archived digital orthopantomographs (OPG) from Brazilian adults, residents in the São Paulo metropolitan area, and aged between 14 and 23 years old. The data was obtained from a private institute of radiology. The radiographs, taken as part of routine dental care, were assigned to the present research after approval by the University of São Paulo School of Dentistry Research Ethics Committee (CAAE: 82403918.0.0000.0075). The participants’ confidentiality was fully preserved in that the information provided was limited to sex, date of birth, and date of radiographic examination. All of the OPGs were in digital format (JPEG file extension), and were obtained by a CRANEX D apparatus (Soredex 26). The standard features of the images were 3292 pixels (width) by 1536 pixels (height), and 265 dpi of vertical and horizontal resolution. Regarding mandibular third-molars, exams presenting unclear content, significant dental or osseous pathology were excluded. Of the OPGs obtained, 17 did not meet the inclusion criteria and were excluded, thus leaving a set of 328 images. In order to test intra and inter-rater agreement, 29 exams were randomly chosen to be repeated two times and 33 exams, three times. Three experienced examiners, whose ICC absolute agreement was 0.89, assessed the radiographs.
Fiji-ImageJ software (public-domain) was used to measure both right and left mandibular third molars. In order to determine the third-molar maturity index (I3M), root apex and tooth height were assessed and measured following the main guidelines laid out by Cameriere et al 2. All of the OPGs were analyzed under the same predetermined scale. Although scaling does not affect the measures of interest (as they are ratios), the images scale were set in ‘units of measure’, being 10.42 pixels equivalent to 1 unit in this research. The Zooming was set to 1.5 X. The straight-line software tool was used to perform and register the measurements (Ctrl + M = register). Reference lines (Ctrl + B saves the reference lines in a layer) were used over the images to provide tooth height reference points before taking these measurements (Figure 1). No matter could the roots be ‘subjectively classified’ whether open or root apex closed, all of them were measured. The I3M was calculated as the sum of the distances of the inner sides of the apexes divided by the tooth length

An Excel Visual Basic Macro was created to automatically transfer all the measurements from Fiji’s results output sheet to an Excel spreadsheet, to speed up the database construction process.
Statistical Analysis
A linear regression analysis was performed as a first step. Age was predicted as a function of sex and I3M value. The significance threshold was set at 5%. Residual tests were performed and plots were generated to confirm linearity, homoscedasticity, and also to check if the errors were independent. In a subsequent linear regression analysis, age was predicted specifically for male and female participants. Paired T tests were performed to compare predictions. The intraclass correlation coefficient (ICC) was used to assess both intra- and inter-rater ratios of agreement. Paired T tests and Bland-Altman plots were used to verify and analyze the obtained inter-rater agreement values.
To test intra- and inter-rater reproducibility, a random sample of 30 OPGs was re-assessed after an interval of one week, and the intra¬class correlation coefficient (ICC) was then used to statistically quantify the absolute agreement.
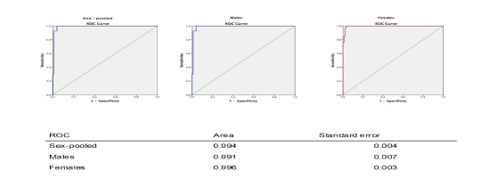
Scatter plot and box plot graphs and tables were used to explore the relationships between chronological age and I3M value for both genders. A receiver operating characteristic (ROC) curve was used to evaluate I3M effectiveness, bearing in mind that the area under the ROC curve indicates how well the test distinguishes adults from minors (a value of 1 indicates a perfect test, whereas a value of 0.5 indicates a meaningless test). The ROC curve evaluation was used to obtain an optimal pre-test cutoff value by managing simultaneously the sensitivity and specificity of the I3M values (Figure 2).
The performance of three I3M test cutoff values (from the ROC analysis) was evaluated using a two-by-two contingency table on the test database OPGs. For each cutoff value proposed, the numbers of true positives (TP), false positives (FP), false negatives (FN), and finally, true negatives (TN) were determined. The percentage of accurate classifications (Ac), the sensitivity (Se) and specificity (Sp) were calculated.
The positive predictive value (PPV) and the negative predictive value (NPV), i.e. the proportions of positive and negative results that were truly positive or truly negative, respectively, were also determined.
The positive likelihood ratio, i.e. the ratio between the probability that an examinee given a positive test result was 18 or older and the probability that an examinee given a positive test result was under 18; and the negative likelihood ratio, i.e. the ratio between the probability that an examinee given a negative test result was 18 or older and the probability that an examinee given a negative test result was under 18, were also calculated. Likelihood ratios values above 10 (LR+) or below 0.1 (LR–) are considered to provide strong evidence for diagnosis [6]. The post-test probability (p) of being 18 or older in the subjects, who live in São Paulo, was calculated according to the Bayes theorem, as follows:
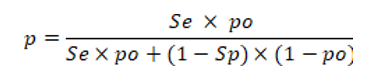
In this theorem, P0 is the probability that the subject in question is 18 years or older, given that he or she is aged between 14 and 23 years old. Actually, P0 considers the proportion of subjects aged 18–22 who live in São Paulo to those aged 14–23 (age class interval of the sample) according to the official demographic data projection from the Brazilian 2010 census (https://www.ibge. gov.br/estatisticas/sociais/populacao/9109projecaodapopulacao. html?=&t=resultados). This proportion was considered to be 51.3% for males and 51.0% for females.
All of the statistical analyses were performed using IBM SPSS 17.0 software (IBM, Armonk, NY, USA). The significance threshold was set at 0.5%
Results
The distribution of age and sex in the study sample was balanced, and is presented in Table 1. As seen in Table 2, the I3M ratio gradually decreased as the chronological age of the participants increased. At 17 years of age, the first signs of apical closure were present in both sexes (albeit more marked among males), and at 21, there were no open apices in any of the individuals examined (an I3M ratio of 0.04-0.05 was considered to reflect a closed apex).
Table 1: Sample characteristics: Age group cohort
|
Age group cohort |
13-14 |
14-15 |
15-16 |
16-17 |
17-18 |
18-19 |
19-20 |
20-21 |
>21 |
Total |
|
Males |
7 |
15 |
12 |
8 |
60 |
33 |
7 |
4 |
10 |
156 |
|
Females |
16 |
19 |
13 |
10 |
39 |
47 |
16 |
7 |
5 |
172 |
|
Total |
23 |
34 |
25 |
18 |
99 |
80 |
23 |
11 |
15 |
328 |
Table 2: I3m Sex-pooled ratios age evolution
|
95% CI |
|||||
|
Age |
mean |
See |
SD |
L_bound |
U_bound |
|
13 |
.653 |
.02 |
.06 |
.62 |
.69 |
|
14 |
.356 |
.03 |
.06 |
.21 |
.50 |
|
15 |
.212 |
.01 |
.04 |
.19 |
.24 |
|
17 |
.149 |
.00 |
.02 |
.14 |
.16 |
|
18 |
.073 |
.00 |
.01 |
.07 |
.08 |
|
19 |
.066 |
.00 |
.01 |
.06 |
.07 |
|
21 |
.048 |
.00 |
.00 |
.04 |
.05 |
|
22 |
.032 |
.00 |
.01 |
.03 |
.04 |
See: Standard error of the estimate
The determination coefficient of the linear regression explained 70% of the sex-pooled distribution, and 63% and 75% of the male and female distributions, respectively (Table 4).
Table 4: Linear regression models
|
Model Summary |
||||||
|
Model |
R |
Df |
Adjusted R Square |
SEE |
RME |
Ic95% |
|
All |
0.835 |
328 |
0.70 |
1.21 |
0.82 |
0.72 - 0.91 |
|
Male |
0.797 |
156 |
0.63 |
1.33 |
0.85 |
0.69 - 1.01 |
|
Female |
0.868 |
172 |
0.75 |
1.09 |
0.78 |
0.66 - 0.89 |
SEE: Standard error of the estimate; RME: Residual mean error Df degrees of freedom
Mean chronological age and standard deviation according to I3M for a sex-pooled group inference and for each of the sexes are presented in Table 2. As shown in Table 2, the younger the subject, the greater the standard deviation of the mean (as in the case of ages 13 to 15).
Sex-pooled sensitivity values where higher when I3M = 0.09, whereas specificity values were higher when I3M = 0.08 as may be seen on Table 3.
Table 3: Pre test I3M cutoff values derived from the ROC curve
|
|
cutoff value |
Sensitivity |
Specificity |
ROC area |
|
Sex-pooled |
0.09 |
0.96 |
0.96 |
0.99 |
|
Male scores |
0.08 |
0.98 |
0.96 |
0.99 |
|
Female scores |
0.10 |
0.98 |
0.97 |
0.99 |
According Post-test contingency tables analysis (Table 5) Sensitivity, Specificity, Positive and Negative Likelihood Ratio, Positive and Negative Predictive Value, Accuracy and Bayes test values were calculated (Table 6).
Table 5: Post-test contingency 2 x 2 tables
|
Sex-pooled I3M_0.09 |
Age 18+ Present |
N |
Age 18+ Absent |
N |
Total |
|
Positive |
True positive |
127 |
False Positive |
14 |
|
|
Negative |
False Negative |
2 |
True Negative |
185 |
|
|
|
|
129 |
|
199 |
328 |
|
Sex-pooled I3M_0.08 |
Age 18+ Present |
N |
Age 18+ Absent |
N |
Total |
|
Positive |
True positive |
118 |
False Positive |
8 |
|
|
Negative |
False Negative |
11 |
True Negative |
191 |
|
|
|
|
129 |
|
199 |
328 |
|
Females I3M_ 0.09 |
Age 18+ Present |
N |
Age 18+ Absent |
N |
Total |
|
Positive |
True positive |
73 |
False Positive |
2 |
|
|
Negative |
False Negative |
2 |
True Negative |
95 |
|
|
|
|
75 |
|
97 |
172 |
|
Females I3M_ 0.08 |
Age 18+ Present |
N |
Age 18+ Absent |
N |
Total |
|
Positive |
True positive |
64 |
False Positive |
2 |
|
|
Negative |
False Negative |
11 |
True Negative |
95 |
|
|
|
|
75 |
|
97 |
172 |
|
Males I3M_0.08 |
Age 18+ Present |
N |
Age 18+ Absent |
N |
Total |
|
Positive |
True positive |
54 |
False Positive |
5 |
|
|
Negative |
False Negative |
0 |
True Negative |
97 |
|
|
|
|
54 |
|
102 |
156 |
|
Males I3M_0.07 |
Age 18+ Present |
N |
Age 18+ Absent |
N |
Total |
|
Positive |
True positive |
52 |
False Positive |
4 |
|
|
Negative |
False Negative |
2 |
True Negative |
98 |
|
|
|
|
54 |
|
102 |
156 |
Table 6: Post-test results
|
Type |
I3M |
Sensitivity |
Specificity |
Positive Likelihood Ratio |
Negative Likelihood Ratio |
18+ prevalence |
Positive Predictive Value |
Negative Predictive Value |
Accuracy |
Bayes |
|
Sex-pooled |
0.09 |
0.98 |
0.93 |
13.99 |
0.02 |
0.39 |
0.90 |
0.99 |
0.95 |
0.94 |
|
95% CI |
(94.51% to 99.81%) |
(88.48% to 96.10%) |
(8.4 to 23.2) |
(0.00 to 0.07) |
(34.0% to 44.9%) |
(84.6% to 93.8%) |
(95.9% to 99.7%) |
(92.2% to 97.2%) |
(89.9% to 96.1%) |
|
|
Sex-pooled* |
0.08 |
0.91 |
0.96 |
22.75 |
0.09 |
0.39 |
0.94 |
0.95 |
0.94 |
0.96 |
|
95% CI |
(85.3% to 95.7%) |
(92.2% to 98.3%) |
(11.52 to 44.96) |
(0.05 to 0.16) |
(34.0% to 44.9%) |
(88.2% to 96.7%) |
(90.8% to 96.8%) |
(91.1% to 96.5%) |
(92.7% to 98.5%) |
|
|
Females* |
0.09 |
0.97 |
0.98 |
47.21 |
0.03 |
0.44 |
0.97 |
0.98 |
0.98 |
0.98 |
|
95% CI |
(90.70% to 99.68%) |
(92.75% to 99.75%) |
(11.97 to 186.16) |
(0.01 to 0.11) |
(36.07% to 51.36%) |
(90.25% to 99.31%) |
(92.37% to 99.47%) |
(94.15% to 99.36%) |
(92.3% to 99.5%) |
|
Females |
0.08 |
0.85 |
0.98 |
41.39 |
0.15 |
0.44 |
0.97 |
0.90 |
0.92 |
0.98 |
|
95% CI |
(75.27% to 92.44%) |
(92.75% to 99.75%) |
(10.47 to 163.65) |
(0.09 to 0.26) |
(36.07% to 51.36%) |
(89.00% to 99.22%) |
(83.33% to 93.72%) |
(87.42% to 95.91%) |
(92.5% to 99.3%) |
|
|
Males |
0.08 |
1.00 |
0.95 |
20.40 |
0.00 |
0.35 |
0.92 |
1.00 |
0.97 |
0.95 |
|
95% CI |
(93.40% to 100.00%) |
(88.93% to 98.39%) |
(8.68 to 47.96) |
() |
(27.19% to 42.64%) |
(82.12% to 96.21%) |
() |
(92.68% to 98.95%) |
(88.8% to 98.4%) |
|
|
Males* |
0.07 |
0.96 |
0.96 |
24.56 |
0.04 |
0.35 |
0.93 |
0.98 |
0.96 |
0.96 |
|
95% CI |
(87.25% to 99.55%) |
(90.26% to 98.92%) |
(9.38 to 64.26) |
(0.01 to 0.15) |
(27.19% to 42.64%) |
(83.24% to 97.14%) |
(92.63% to 99.48%) |
(91.82% to 98.58%) |
(90.1% to 99.0%) |
Sex-specific cutoff values expressed an increase in female sensitivity (+6%) at 0.09 considered the sex-pooled value, while female sex-specific sensitivity 0.08 cutoff represented a decrease of 6% considered the sex-pooled value.
Male sensitivity at 0.08 cutoff decreased 1% considered the sex pooled post-test and remained the same at 0.07 I3m (96%).
Compared to the sex-pooled 0.08 cutoff ratios, female specificity increased 2% for I3M 0.09. Male specificity at 0.07 ratio remained the same compared to the sex-pooled individuals at 0.08 ratio (96%).
The positive likelihood ratio ranged from 22.8 (sex-pooled: I3M = 0.08) to 24.6 (males: I3M = 0.07) and to 47.2 (females: I3M = 0.09).
The negative predictive value ranged from 99% to 95% throughout the tested cutoff values. Accuracy, which is the proportion of accurately classified subjects, ranged from 98% to 94% throughout the tested cutoff values, and was 98% for females (I3M =0.09), 96% for males (I3M = 0.07), and 94% for sex-pooled individuals (I3M = 0.08).
Finally, application of the Bayes’ theorem (probability of the examinee being tested meets the condition of being aged 18 or older based on the prevalence of the condition in the population of origin based on regional data census) gave results ranging from 98% to 94% throughout the tested cutoff values, and was 98% for females (I3M = 0.09), 96% for males (I3M = 0.07), and 96% for sex-pooled individuals (I3M = 0.08).
Discussion
Complete closure of the apices of mandibular third molars is an indication that the examined individual is over the age of 18. Several studies that have applied the I3M method of Cameriere et al. for age estimation in different population have confirmed high levels of sensitivity and specificity for the 0.08 cutoff value in determining adulthood [1-3, 10-18]. In fact, the accuracy of the I3M value of 0.08 has been found to range from a minimum of 72.4% (Saudi Arabia females) 11 to a maximum of 97.6% (Turkish males) [10]. In the present study, accuracy reached 96% among males for an I3M cutoff value of 0.07, and 98% among females for an I3M cutoff value of 0.09.
Whether for individuals to be held accountable for their actions, or to protect the rights of minors’, it is paramount that a population’s given cutoff value expresses not only the best possible sensitivity-specificity relationship (accuracy), but also reduces to a minimum the chance of a minor being wrongfully considered an adult. Bearing this premise in mind, I3M specificity is of utmost importance, since the higher its value, the lower the chance of false positives.
Dardouri et al. (2016) found optimal specificity in their research with a Libyan population (100%) for both males and females considered I3M = 0.08 [3, 16, 19]. In contrast, Franklin et al. (2016) and Deitos et al. (2015) found values ranging respectively from 85% for males to 67.2% for females in Australian and in Brazilian populations, respectively. In the present study (conducted with a Southeastern Brazilian sample), specificity values ranged from 96% to 98% for males and females, respectively, considering an I3M of 0.07 (males) and an I3M of 0.09 (females). Under an I3m value of 0.08, the observed specificity values ranged from 92% to 97% for males and females, respectively. It is worth mentioning that beyond population variations, sampling-confounding elements may explain part of this significant variation among studies performed in the same country (Deitos et. al, 2015 and the present research) [3]. Random data from radiologic clinics are not “real random population-based data”, since it can be significantly influenced by the cumulative presence in the sample of atypical conditions. As an example, many patients are submitted to orthopantomographic examination just because their wisdom teeth seem to be lacking at a time they were expected to have erupted. In truth, many cases of individuals over 18 years old whose wisdom tooth maturity is compatible with that of a 14-year-old will be present. Consequently, radiologic clinics data delayed 3rd molar development prevalence may deeply differ from population-based effective prevalence. Whether a third molar is lacking or merely delayed, it cannot be assumed that the prevalence of these cases in radiologic clinics is the same as their actual prevalence in the overall population. Unless this issue is addressed by researchers by applying exclusion criteria and effectively identifying those exams whose explicit objective was to investigate potential anodontia or delayed eruption (e.g., by accessing the radiologic exam prescription), the study results will likely be biased. A high proportion of delayed tooth formation in a given sample of radiographic exams could entail accuracy problems and compromise specificity scores.
Although the great majority of previous studies conducted with I3M methodology have effectively used the cutoff value of 0.08, or other values for both sexes, the literature has also pointed out that the timing of third molar development varies according to sex, and, therefore, that it is possible that fine-tuning adjustments may increase accuracy in terms of both sensitivity and specificity [20-24].
Both situations— using the 0.08 cutoff value for both sexes and using different cutoff values for either sex—were tested in the present study. For females, specificity values were very high (98%) under both 0.08 and 0.09 ratios, the latter performing better in terms of sensitivity. Since the results of the Bayes post-test were equivalent for both values, but accuracy was significantly higher for the I3M of 0.09, it could be concluded that this ratio performed better. For males, the I3M ratios of 0.08 and 0.07 seemed quite similar in terms of specificity (a mere 1% increase for I3M = 0.07); however, in terms of accuracy, I3M = 0.07 performed significantly better, namely 96% versus 92.6%.
Conclusion
Considered the fact a very specific cut- off value will rarely prove positive in the absence of being 18 years age or older and the required discriminant confidence needed in the forensic age prediction we can conclude from the sex-pooled cut- off values (I3m 0.08) to sex-specific cut- off values comparison, that I3M 0.09 ratio is a better option to be used at the local tested female population and I3M 0.07 ratio is a better option to be used at the local tested male population.
References
- S De Luca, R Biagi, G Begnoni, G Farronato, M Cingolani, et al. (2014) Accuracy of Cameriere’s cutoff value for third molar in assessing 18 years of age. Forensic Sci Int 235: 102. e1-6.
- Cameriere R, L Ferrante, D De Angelis, F Scarpino, F Galli (2008) The comparison between measurement of open apices of third molars and Demirjian stages to test chronological age of over 18 year olds in living subjects. Int J Legal Med 122: 493-497.
- AR Deitos, C Costa, E Michel-Crosato, I Galic, R Cameriere, et al. (2015) Age estimation among Brazilians: Younger or older than 18? J Forensic Leg Med 33: 111-115.
- Andreas Olze, Dominique Bilang, Sven Schmidt, Klaus-Dieter Wernecke, Gunther Geserick, et al. (2005) Validationof common classification systems for assessing the mineralization of third molars. Int J Legal Med 119: 22-26.
- Liversidge HM (1999) Dental maturation of 18th and 19th century British children using Demirjian’s method. Int J Paediatr Dent 9: 111-115.
- Mincer HH, Harris EF, Berryman HE (1993) study of third molar development and its use as an estimator of chronological age. J Forensic Sci 38: 379-390.
- Demirjian A, Goldstein H (1976) New systems for dental maturity based on seven and four teeth. Ann Hum Biol 3: 411-421.
- Moorrees CF, Fanning EA, Hunt EE (1963) Age Variation of Formation Stages for Ten Permanent Teeth. J Dent Res 42: 1490-1502.
- Maber M, Liversidge HM, Hector MP (2006) Accuracy of age estimation of radiographic methods using developing teeth. Forensic Sci Int 159: S68-S73.
- Gulsahi A, StefanoDe Luca, S. BurcakCehreli, R. EbruTirali, Roberto Cameriere (2016) Accuracy of the third molar index for assessing the legal majority of 18 years in Turkish population. Forensic Sci Int 266: 584.e1-584.e6.
- Amal A El-Bakary, Somaia M El-Azab, Heba M Abou El Atta, Luz Andrea Velandia Palacio, Roberto Cameriere (2017) Third molar cutoff value in assessing the legal age of 18 in Saudi population. Forensic Sci Int 272: 64-67.
- Cameriere R, A Pacifici, S Viva, D Carbone, L Pacifici, et al. (2014) Adult or not? Accuracy of Cameriere’s cutoff value for third molar in assessing 18 years of age for legal purposes. Minerva Stomatol 63: 283-294.
- R Cameriere, V Santoro, Roberta Roca, P Lozito, F Introna, et al. (2014) Assessment of legal adult age of 18 by measurement of open apices of the third molars: Study on the Albanian sample. Forensic Sci Int 245: 205.e1-5.
- Léo Ribier, Pauline Saint-Martin, Mélanie Seignier, Arnaud Paré, Laurent Brunereau, et al. (2015) Cameriere’s third molar maturity index in assessing age of majority. Forensic Sci Int 252: 191.e1-5.
- Stefano De Luca, Lina Aguilar, Marcela Rivera, Luz Andrea Velandia Palacio, Giulia Riccomi, et al. (2016) Accuracy of cutoff value by measurement of third molar index: Study of a Colombian sample. Forensic Sci Int 261: 160.e1-5.
- Daniel Franklin, Shalmira Karkhanis, Ambika Flavel, Federica Collini, Stefano DeLuca, et al. (2016) Accuracy of a cutoff value based on the third molar index: Validation in an Australian population. Forensic Sci Int 266: 575.e1-575.e6.
- Ksenija Zelic, Ivan Galic, Nenad Nedeljkovic, Aleksandar Jakovljevic, Olga Milosevic, et al. (2016) Accuracy of Cameriere’s third molar maturity index in assessing legal adulthood on Serbian population. Forensic Sci Int 259: 127-132.
- Jeta Kelmendi, Roberto Cameriere, Ferit Koçani, Ivan Galic, Blerim Mehmeti, et al. (2018) The third molar maturity index in indicating the legal adult age in Kosovar population. Int J Legal Med 132: 1151-1159.
- Ashref Ali Khalifa Dardouri, Roberto Cameriere, Stefano DeLuca, Stefano Vanin (2016) Third molar maturity index by measurements of open apices in a Libyan sample of living subjects. Forensic Sci Int 267: 230.e1-230.e6.
- Levesque GY, Demirijian A, Tanguay R (1981) Sexual dimorphism in the development, emergence, and agenesis of the mandibular third molar. J Dent Res 60: 1735-1741.
- Yildiray Sisman, Tancan Uysal, Fatih Yagmur, Sabri Ilhan Ramoglu (2007) Third-molar development in relation to chronologic age in Turkish children and young adults. Angle Orthod 77: 1040-1045.
- Elisabeth Hofmann, Matthias Robold, Peter Proff, Christian Kirschneck (2017) Age assessment based on third molar mineralisation: An epidemiological-radiological study on aCentral-European population. J Orofac Orthop 78: 97-111.
- Yuming Bai, Jing Mao, Shengrong Zhu, Wei Wei (2008) Third-molar development in relation to chronologic age in young adults of central China. J Huazhong Univ Sci Technolog Med Sci 28: 487-490.
- Bassed RB, Briggs C, Drummer OH (2011) Age estimation and the developing third molar tooth: an analysis of an Australian population using computed tomography. J Forensic Sci 56: 1185-1191.
- Drusini AG, Toso O, Ranzato C (1997) The coronal pulp cavity index: a biomarker for age determination in human adults. Am J Phys Anthropol 103L 353-363.