

Archives of Infectious Diseases & Therapy(AIDT)
ISSN: 2577-8455 | DOI: 10.33140/AIDT
Impact Factor: 1.385


Research Article - (2024) Volume 8, Issue 3
Aerosol Measurement in Inpatients and Outpatients with SARS-CoV-2 Infection
2Respiratory Research Institute, Medaimun GmbH, 60596 Frankfurt am Main, Germany
3Department of Pediatrics, Stanford University School of Medicine, Stanford, California 94305, USA
Received Date: May 09, 2024 / Accepted Date: Jun 28, 2024 / Published Date: Oct 16, 2024
Copyright: ©Â©2024 Stefan Zielen, et al. This is an open-access article distributed under the terms of the Creative Commons Attribution License, which permits unrestricted use, distribution, and reproduction in any medium, provided the original author and source are credited.
Citation: Zielen, S., Landeis, A., Ume, E. R., Lehmkühler, T., Herrlich, L., et al. (2024). Aerosol Measurement in Inpatients and Outpatients with SARS-CoV-2 Infection. Archives of Infect Diseases & Therapy, 8(3), 01-10.
Abstract
Background: Since the COVID-19 pandemic, research of aerosols and their importance for the transmission of SARS- CoV-2 as well as their role in super-spreading events has intensified. The present study compared healthy controls, outpatients with mild SARS-CoV-2 disease (outpatient group) and severely ill hospitalized patients (inpatient group) to investigate the connection between aerosol production and disease severity.
Methods: For this purpose, the exhaled aerosol concentration of 234 adults (53 outpatients, 61 inpatients and 120 controls) was analyzed in a prospective clinical trial. The study consisted of a clinical examination, spirometry and aerosol measurement using a spectrometer (Resp-Aer-Meter, Palas GmbH, Karlsruhe, Germany).
Results: The outpatients had a milder clinical course, fewer co-morbidities, and a lower age than the inpatient group. The aerosol concentration of the groups differed significantly (p<0.001) from each other (median control 285.5 [14 - 850] n/l; outpatient group 413 [18 - 7355] n/l and inpatient group 1353 [46 – 27779] n/l). The increase of aerosols was primarily observed in the size range from 0.1 to 0.52 μm. Lung function differed significantly (p < 0.001) between the groups (median FEV1; control group 87.6 [57.1 - 149.3], outpatient group 85.3 [50.3 - 117.6] % and inpatient group 59.7 [16.0 – 112.3] %).
In this study, two super-emitters (3.8%) with very high aerosol exhalation (> 5000 n/l) could be identified among outpatients, whereas 15.6% of the inpatients were super-emitters.
Conclusion: Aerosol measurement using the Resp-Aer-Meter is not suitable for detecting SARS-CoV-2 infections. However, it could provide valuable information about super-emitters and may be used to support prevention and control measures in the community.
Keywords
Aerosols, SARS-CoV-2 Infection, Superspreader, Outpatient and Inpatient Infection
Introduction
Respiratory tract infections caused by corona viruses have been known for many years. The global extent of the COVID 19 pandemic far exceeds the outbreaks of the severe acute respiratory syndrome coronavirus type 1 (SARS-CoV-1) or the Middle East respiratory syndrome coronavirus (MERS-CoV) in 2002 and 2012, respectively [1]. SARS-CoV-2 uses a similar mechanism to SARS-CoV-1 for its replication in the respiratory tract. The most important element is the binding of the viral spike protein to the receptor of the angiotensin-converting enzyme 2 (ACE2) [2,3]. After entry and replication in cells, the infection can manifest clinically as COVID-19 [4,5]. Fever, cough, fatigue, impaired smell, and dyspnea were identified in meta-analyses as the most common symptoms in adult patients [6,7], whereas asymptomatic cases were described in around 16 to 22% of diagnosed infections [8,9]. However, the symptom pattern differs between hospitalized and non-hospitalized patients. While patients in outpatient settings are characterized primarily by mild illness with fever, myalgias, headaches and impaired smell [10,11], hospitalized patients more frequently exhibit dyspnea, cough and lung failure [12]. The severity and hospitalization rate are depended on underlying illnesses (obesity, diabetes mellitus, cardiovascular, respiratory and renal diseases), smoking status, age and gender of the patient, but also the virus variant present [13-15].
At the beginning of the pandemic, knowledge on the transmission route of SARS-CoV-2 was largely based on case observations and contact tracing [16,17]. Initially, the focus was on droplet infections through close contact and smear infections, which lead to recommended protective measures such as physical distance rules and disinfection measures [18,19]. However, the relationship to SARS-CoV-1 and MERS suggested that SARS-CoV-2 could also be transmitted via aerosols [20]. This was initially discussed primarily in the context of aerosol-generating medical interventions (endotracheal intubation, bronchoscopy), but also respiratory maneuvers such as singing, speaking, screaming, or coughing [18,21]. Further evidence was provided by the observations of superspreading events and in particular the detection of SARS-CoV-2 nucleic acids and intact virus in samples and cultures from the ambient air around infected patients [22-25].
Aerosols are defined as a mixture of solid and/or liquid particles with a gas, usually air [26]. Two mechanisms for the formation of aerosols in the human respiratory tract are described [26]. Larger aerosols are created by shedding as turbulent air currents move across the liquid film of the airway surface. Smaller aerosols, and thus most of the exhaled aerosols, are generated in the small bronchi [27]. These aerosols arise from the fragmentation of bubbles and fluid bridges between the bronchial walls, that expand and contract with respirations. With each breathing cycle, aerosols are continuously generated, so that every person produces a certain base rate of particles while breathing [28].
How aerosol production changes in the setting of respiratory tract infections have been researched for other pathogens, but with regard to SARS-CoV-2 it is still in its early stages. In the work of Edwards et al [29] and Gutmann et al. [30,31], exhaled aerosols of controls and SARS-CoV-2 positive patients were quantified, showing an increase of exhaled particles in SARS-CoV-2 positive patients. To better understand the transmission of SARS-CoV-2 via aerosols, this study compared exhaled aerosols in inpatients and outpatients, correlated aerosol excretion with disease severity and analyzed the number of superspreaders in both groups.
Methods
Study Design
This was a single-center prospective, clinical trial with exploratory analysis of exhaled aerosols in SARS-CoV-negative controls, SARS-CoV-2-positive outpatients, and inpatients. The measurements of exhaled aerosols in outpatients were performed from April to December 2021 in Frankfurt am Main metropolitan area. An ambulatory team conducted the measurements in the home environment of the isolated test subjects. A total of 61 inpatients, 53 outpatients and 120 controls met the inclusion criteria (listed below) and were thus included in further analysis.
Measurements were performed after detailed written and verbal information about the purpose and risks of the planned examination was provided and written consent was obtained. Before the initiation of the study, approval was granted by the Frankfurt Ethics Committee and the study was registered with ClinicalTrials.gov (identification number NCT04739020). The study was sponsored by an independent grant and equipment of the Palas GmbH, Karlsruhe, Germany.
The following inclusion and exclusion criteria existed: Inclusion criteria for healthy adults:
• Age: 18 – 99 years
• Patients with a current, negative PCR test for SARS-CoV-2
• Ability to understand the study
• Written consent Inclusion criteria for patients with SARS-CoV-2 infection:
• Age: 18 –99 years
• Patients with a current, positive PCR test for SARS-CoV-2 (0 â?? 3 days old)
• Ability to understand the study
• Written consent Exclusion criteria for all patients were:
• Inability to perform spirometry
• Inability to carry out a correct measurement of aerosols
• Inability to understand the scope of the study
After informed consent was obtained, history was taken with documentation of demographic data, clinical symptoms, onset of symptoms and PCR test results (including cycle threshold (Ct value), if available). The exhaled aerosols were measured using the Resp-Aer-Meter (Palas GmbH, Karlsruhe, Germany) and the lung function was measured using a hand-held spirometer.
A detailed description of the used method for exhaled aerosol measurement can be found in our previous work [30,31] and is outlined in the supplement. Figure 1 of the supplement is showing the Resp-Aer-Meter with connected mouthpiece and HEPA filter, and Figure 2 a-c the sequence of a measurement based on the resulting curve.

Figure 1: Lung function
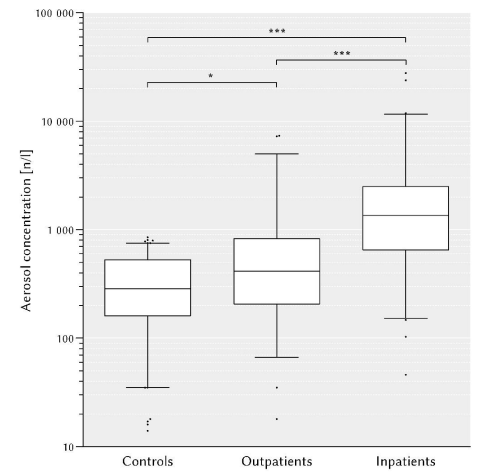
Figure 2: Aerosol Concentration
Spirometry
Spirometry was carried out in accordance with the criteria of the American Thoracic Society and the European Respiratory Society using a hand-held spirometer (Asthma Monitor AM, VIASYS Healthcare GmbH, Hochberg, Germany). The peak flow (PEF) and the one-second capacity (FEV1) were measured. The FEV1 (%) predicted was determined for each patient.
Statistical Methods
GraphPad Prism 5.01 (GraphPad Software, Inc.) and IBM SPSS Statistics 29.0.0.0 (IBM Corporation) were used for statistical analysis. The median and the range were used to represent numerical data. Nominal data were reported as percentages.
The Kruskal-Wallis test followed by Dunn's test as a post hoc test were used to calculate statistically significant differences between numerical data when comparing all three groups. For nominal data, the chi-square test was used. To compare two groups, the Mann-Whitney U test was used for numerical data and the Fisher exact test for nominal data. Results with a p-value < 0.05 were considered statistically significant and larger values were considered not significant (n.s.). Unless otherwise stated, the p-values in the tables refer to the comparison of all groups. The p values within the figures are abbreviated with asterisks as follows: p < 0.05
(*); p < 0.01 (**); p < 0.001 (***).
Results
Demographics and Comorbidities
A total of 234 adults were included in this study. The corresponding group sizes and characteristics can be found in Table 1. The groups differed significantly in their age and body mass index (BMI), but not in their gender distribution or smoking status. There were more men in the hospitalized group, but without statistical significance.
|
|
Controls (n = 120) |
Outpatients (n = 53) |
Inpatients (n = 61) |
p-Value |
|
Age [Years] Median |
42 |
34 |
52 |
< 0.001 |
|
range |
18 – 80 |
19 – 84 |
24 – 87 |
|
|
Sex female |
52 (43.3 %) |
24 (45.3 %) |
18 (29.5 %) |
0.138 |
|
male |
68 (56.7 %) |
29 (54.7 %) |
43 (70.5 %) |
|
|
BMI [kg/m2] Median |
26.1 |
24.5 |
28.2 |
0.004 |
|
Range |
18.9 – 44.4 |
18.0 – 38.0 |
16.6 – 44.4 |
|
|
Smoking status |
|
|
|
|
|
Nonsmoker |
92 (76.7 %) |
39 (73.6 %) |
48 (78.7 %) |
0.813 |
|
Smoker |
28 (23.3 %) |
14 (26.4 %) |
13 (21.3 %) |
|
Table 1: Clinical Characteristics
Table 2 lists the most common comorbidities in the individual groups in absolute and relative incidence. Overall, patients with SARS-CoV-2 infection were more likely to have previous illnesses, with these being most common in the inpatient group. There were significant differences between all groups in all comorbidities, except for previous respiratory illnesses.
Asthma and pollen allergies predominated in the controls and outpatients.
|
Pre-existing conditions |
Controls (n = 120) |
Outpatients (n = 53) |
Inpatients (n = 61) |
p-Value |
|
Obesity |
23 (2.5 %) |
6 (11.3 %) |
21 (34.4 %) |
0,008 |
|
Hypertension |
8 (6.7 %) |
8 (15.1 %) |
27 (44.3 %) |
< 0,001 |
|
Diabetes |
2 (1.7 %) |
1 (1.9 %) |
14 (23.0 %) |
< 0,001 |
|
Respiratory |
16 (13.3 %) |
10 (18.9 %) |
13 (21.3 %) |
0,351 |
|
Cardiac |
0 (0 %) |
3 (5.7 %) |
18 (29.5 %) |
< 0,001 |
|
Renal |
0 (0 %) |
3 (5.7 %) |
20 (32.8 %) |
< 0,001 |
Table 2: Comorbidities
Clinical Manifestation
The clinical presentation is listed in Table 3 with the individual symptoms in the respective groups displayed as absolute and relative occurrence. For this analysis, only the outpatient and inpatient groups were compared, as a separate comparison with the asymptomatic control group would not bring any added value and would distort the evaluation.
|
Symptoms |
Controls (n = 120) |
Outpatients (n = 53) |
Inpatients (n = 61) |
p-value (outpatients vs. inpatients) |
|||
|
Fever |
0 |
(0 %) |
3 |
(5.7 %) |
17 |
(27.9 %) |
0.003 |
|
Cough |
4 |
(3.3 %) |
29 |
(54.7 %) |
33 |
(54.1 %) |
1.000 |
|
Dyspnea |
1 |
(0.8 %) |
9 |
(17.0 %) |
25 |
(41.0 %) |
0.007 |
|
Change in sense of smell and/or taste |
0 |
(0 %) |
18 |
(34.0 %) |
9 |
(14.8 %) |
0.026 |
|
Sore throat |
0 |
(0 %) |
10 |
(18.9 %) |
10 |
(16.4 %) |
0.807 |
|
Myalgia and/or ar-thralgia |
0 |
(0 %) |
5 |
(9.4 %) |
11 |
(18.0 %) |
0.280 |
|
Diarrhea |
0 |
(0 %) |
1 |
(1.9 %) |
5 |
(8.2 %) |
0.213 |
|
Nausea and/or vomit- ing |
0 |
(0 %) |
0 |
(0 %) |
2 |
(3.3 %) |
0.498 |
|
Day X of symptoms |
|
|
|
|
|||
|
Median Range |
– |
6 1 – 12 |
8 1 – 28 |
0.002 |
|||
Table 3: Clinical Presentation
At the time of the measurement, the inpatients were almost five times more likely to have fever and twice as likely to have dyspnea. The outpatients, on the other hand, reported disorders of the sense of taste and/or smell twice as much as the inpatient group.
In the inpatient group, the examination was carried out significantly later (on the median on day 8 of symptoms) and covered a significantly larger time frame overall (days 1 - 28) compared to the outpatient group(median measurement on day 6 ; range day 1 – 12).
Lung Function Testing
When looking at lung function, the FEV1 % predicted and PEF of the three groups were compared and shown as boxplots in Figure 1. For both measured values, the inpatient group differed significantly from the other two groups (control 87.6 (57.1 -149.3) %; outpatient group median FEV1 85.3 (50.3 - 117.6) % and inpatient Group 59.7 (16.0 - 112.3) %; p < 0.0001. A similar distribution was also seen in the PEF measurements (control 464 [238.0 - 873.0] l/min; outpatient group 404.5 [178.0 – 667.0] l/ min and inpatient group 277.0 [62.0 – 715.0] l/min); p < 0.0001.
Aerosol Measurement
The exhaled aerosol concentrations of the individual groups are shown in Figure 2. The boxplots show a confidence interval of 95%, data outside of this are presented as individual dots. In both SARS-CoV-2-positive groups), the aerosol concentrations were significantly increased when compared to controls (control group 285.5 [14 - 850] n/l; outpatient group 413 [18 – 7355] n/l and inpatient group 1353 n/l [46 - 27779] n /l).
Size Distribution
The particle sizes were divided into small (0.1 - 0.52 µm) and large (0.52 - 5.2 µm) aerosols. This distinction was made because although all aerosols can potentially penetrate the entire lung, the large aerosols show a preference for the area of the extrathoracic airways, while the smaller particles penetrate deeper lung fields. The small aerosols accounted for 92.3% of the total aerosols measured across all groups; the large aerosols only for 7.7% (Fig. 3).

Figure 3: Particle Size
As shown in Figure 3, the median aerosol concentrations of small aerosols are significantly higher (control group 247.1 [0 -1026] n/l; outpatient group 350 [17.5 - 7123] n/l; inpatient group 1126 [46.3 – 27607] n/l) than that of the large aerosols in the respective group (control group 17.5 [0 – 597.9] n/l; outpatient group 20.9 [0 – 733.3] n/l; inpatient group 114 [0 – 1759] n/l).
In the fraction of small aerosols all three groups differed significantly from each other, with the inpatient group showing the smallest particles.
Superspreaders
A cutoff of 5000 n/l was set for the classification of superspreaders. Among outpatients, this was exceeded by two patients (3.8%), who accounted for 27.6% of all aerosols measured in the outpatient setting. In total, 11 patients (20.8%) in the outpatient group were responsible for 71.0% of the measured aerosol concentrations (71:21). This ratio was similar in the inpatients at 68:21, while the controls deviated significantly from this at 40:20.
Figure 4 shows the aerosol concentrations of the individual study participants descending according to their height as columns. The relative proportion of all aerosols that were generated by the corresponding proportion of test subjects, i.e. in the sense of the Pareto principle, are shown as points.

Figure 4: Pareto Principle
Discussion
With the occurrence of the first SARS-CoV-2 infections at the end of 2019 and its rapid global spread, the virus became the focus of global research. It quickly became clear that, due to the epidemiological behavior, there must also be airborne transmission route in addition to transmission via droplets.
Aerosols are physiologically generated with each breathing cycle by turbulent air currents and opening airways in the terminal lung sections, breaking up the pulmonary fluid film [26,28,32]. This poses a risk for infected patients to act as so-called superspreaders, releasing a large number of infectious aerosols and thus being responsible for numerous secondary infections [24,33].
The work of Edwards et al. [29] showed increased aerosols in SARS-CoV-2-infected primates and detected humans with higher aerosol excretion in a healthy experimental group. Gutmann et al. [30] were able to demonstrate significantly increased exhaled aerosol concentrations in hospitalized patients with a SARS-CoV-2 infection compared to the control group. The question arose as to whether milder illnesses in outpatients are also associated with increased aerosol concentrations. In addition, looking at subgroups of the studied hospitalized patients, Gutmann et al. [30] found a correlation between severity of disease and concentration of exhaled particles in the inpatient setting. To further investigate this correlation and extend it to the outpatient setting, as part of this study, exhaled aerosols were measured in outpatients an compared with the data from Gutmann et al. [30]. In this comparison, we found an increase in aerosols in both outpatients and inpatients with SARS-CoV-2 when compared to healthy controls, with significantly higher concentrations in the inpatient group compared to the outpatient group, which solidified the correlation of exhaled aerosols and severity of illness.
As expected, the inpatients and outpatients differed from each other in their age, BMI and all comorbidities. These results are not surprising and are consistent with the literature, as comorbidities such as obesity, diabetes and cardiovascular diseases represent risk factors for a severe course of the disease and an increased hospitalization rate [13,34,35]. Accordingly, the sicker and older patients are found primarily in the inpatient group, while the outpatient group consists predominantly of healthier and younger patients. In agreement with our results, Vahey et al. [12] found significantly more frequent productive cough, dyspnea, and hemoptysis in hospitalized patients as signs of an infection of the deep respiratory tract.
When looking at the individual underlying respiratory illnesses, however, it is noticeable that the outpatients and controls mainly had mild preexisting conditions such as asthma or hay fever, while the inpatients had more serious lung illnesses such as pneumonia, COPD, pulmonary fibrosis. Accordingly, lung function was only impaired in inpatients; no difference compared to controls could be demonstrated in the outpatients. There are only a few comparable studies on lung function testing and aerosol measurement during an acute SARS-CoV-2 infection. The international recommendations to reduce spirometry to ovoid spreading of aerosols also restricted its implementation in studies [36]. It was primarily carried out as follow-up care for COVID-19 survivors. The study by Lund Berven et al. [37] performed pulmonary function testing on outpatients aged 12 to 25 years. They found no difference in FEV1 between those infected with SARS-CoV-2 and the control group.
Xi et al. [38] suggested that exhaled aerosols are a kind of fingerprint that can be used to detect various structural lung diseases. Each disease causes an individual modification of the pulmonary architecture and thus influences the formation of aerosols [38]. Structural changes could lead to stronger turbulent flow leading to increased fragmentation of the liquid film that coats the airway surface, resulting in more exhaled aerosols. However, the composition of the liquid film itself could also be changed and in turn influence aerosol production through its viscoelasticity and surface tension. For example, diseases such as COPD or cystic fibrosis are associated with a different composition of the airway fluid film [39]. This principle can also be transferred to iatrogenic changes. Edwards et al [29] showed that after inhalation of a saline solution, the aerosol concentration in the exhaled air decreases due to the increased surface tension. The patients in the inpatient group had multiple and complex previous illnesses with associated polymedication. An isolated consideration of individual comorbidities or the influence of medication was not possible in this study, given the above-mentioned overlays and the small group sizes. However, this should be investigated further in future studies.
Significantly higher exhaled aerosol concentrations compared to healthy controls, were detected not only in patients with severe illness, but also in mildly ill patients. This observation has been described several times by us and other authors [29, 31]. In particular, an increase in aerosols in the size range of less than 0.5 µm was detected in this patient population. The question arises to what extent these small aerosols contain intact viruses. Some working groups were unable to detect SARS-CoV-2 virus material in air samples despite RT-PCR tests [40-42], whereas other authors were able to successfully cultivate viable viruses from aerosols with a size of 0.25 to 0.5 µm [25,43,44]. This confirms the possibility of transmission through small aerosols and thus their relevance for containment of the infection and the potential for superspreading events [27,43-45].
When looking at superspreading events, epidemiological studies have shown that the pareto principle applies to transmission of infections. This concept is referred to as the ''80:20 rule''. Therefore, 80% of secondary infections are typically caused by 20% of the initially infected individuals. In diseases spread by aerosol transmission, the small portion of infected individuals that accounts for most secondary infections most likely generates more exhaled aerosols. In our study, only two super-emitters (3.8%) with very high aerosol excretion (> 5000 n/L) could be identified among outpatients. Within the group they were responsible for 27.6% of the aerosols. In comparison, in the cohort studied by Gutmann et al. [30] 15.6% of inpatients were above the limit (>5000 n/L) and generated 64.8% of aerosols.
However, when analyzing the overall distribution of exhaled aerosols without taking the cut off of 5000n/L into account, both groups have the same proximity to the 80:20 rule (Fig. 4). With a ratio of 71:21 in the outpatient group and 68:21 in the inpatient group, the ratio was significantly closer to the Pareto principle than in the control group (40:20). Edwards et al. [29], on the other hand, were also able to determine a ratio of 80:19 in their healthy test group, which was not the case here. The results of this work indicate that the infection causes a greater increase in aerosol excretion in some infected patients. Therefore, infection increases the difference between super emitters and less excreting patients. Even with a similar severity of illness, an infection appears to have a particularly strong influence on the pulmonary structure of a small group of people and thus leads to a more pronounced increase in their aerosol production.
Studies on exhaled aerosols have already been carried out in respiratory infections with other pathogens such as rhinovirus, Mycobacterium tuberculosis and influenza viruses [46-48]. An increase in the exhaled aerosol concentration of patients infected with these pathogens was found [46 -48]. In addition, aerosols with a size of less than one micrometer were mainly detected [46,47,49]. The results from different studies with different pathogens suggest that the increase in aerosol production is non-specific for a SARS-CoV-2 infection. Respiratory infections appear to influence pulmonary conditions in a similar way, leading to an increase in aerosol formation.
This study had some limitations. The results of the Resp-Aer-Meter are purely quantitative in terms of recording the number and size of exhaled aerosols, without allowing any conclusions about the composition of the aerosols. It does not recognize whether components of pathogens are contained in the exhalate or whether they are intact and vital. Therefore, the question of the infectivity of a patient cannot be answered with the Resp-Aer-Meter. In addition, there was a gap of at least 24 hours between the aerosol measurement and the PCR test and the participants were not tested for any other respiratory pathogens besides SARS-CoV-2.
Conclusion
The present study was the first to compare outpatients with mild disease to severely ill inpatients to examine a connection between aerosol production and disease severity. As expected, the outpatients had a milder clinical condition, fewer comorbidities, and a lower age than the inpatient group. The aerosol concentration of the groups differed significantly from each other, but the outpatient group exhaled lower concentrations than the inpatient group. In addition, only the inpatient group had a severely compromised lung function. Aerosol measurement was not suitable for detecting SARS-CoV-2 infections in outpatient settings however, it could provide valuable information about super-emitters and could be used to support questions about isolation arrangements or duration.
Declaration
Ethics approval
The study was approved by the responsible ethics committee in Frankfurt (application number 20-1001).
Consent for Publication
Consent for publication was obtained for any individual data presented.
Availability of Data and Materials
The datasets used and/or analyzed during the current study are available from the corresponding author on reasonable request.
Competing interests
Dr. Zielen, has received personal fees for lectures from bene-Arzneimittel GmbH, from Bohringer Ingelheim, Allergy Therapeutics, AstraZeneca, SanofiAventis and EryDel SpA in the last 3 years outside the submitted work. All other authors have no competing interest to declare.
Funding
The study was sponsored by an independent grant and equipment of the Palas GmbH, Karlsruhe, Germany.
Authors' contributions
AL, SZ and DG had the idea for the manuscript. AL, DG, UER, TL, LH, did the study design, data collection and interpretation. MH and AL did statistical analysis. AL, SZ and DG wrote the manuscript. AL, SZ, DG, RS, and MH read and revised the manuscript. All authors read and approved the final manuscript.
References
- Feehan, J., & Apostolopoulos, V. (2021). Is COVID-19 the worst pandemic?. Maturitas, 149, 56.
- Jackson, C. B., Farzan, M., Chen, B., & Choe, H. (2022). Mechanisms of SARS-CoV-2 entry into cells. Nature reviews Molecular cell biology, 23(1), 3-20.
- Lee, I. T., Nakayama, T., Wu, C. T., Goltsev, Y., Jiang, S., Gall, P. A., ... & Jackson, P. K. (2020). ACE2 localizes to the respiratory cilia and is not increased by ACE inhibitors or ARBs. Nature communications, 11(1), 5453.
- Elias, C., Sekri, A., Leblanc, P., Cucherat, M., & Vanhems,P. (2021). The incubation period of COVID-19: A meta-analysis. International Journal of Infectious Diseases, 104, 708-710.
- Wu, Y., Kang, L., Guo, Z., Liu, J., Liu, M., & Liang, W. (2022). Incubation period of COVID-19 caused by unique SARS-CoV-2 strains: a systematic review and meta-analysis. JAMA network open, 5(8), e2228008-e2228008.
- Al Maqbali, M., Al Badi, K., Al Sinani, M., Madkhali, N., & Dickens, G. L. (2022). Clinical features of COVID-19 patients in the first year of pandemic: a systematic review and meta-analysis. Biological research for nursing, 24(2), 172-185.
- Grant, M. C., Geoghegan, L., Arbyn, M., Mohammed, Z., McGuinness, L., Clarke, E. L., & Wade, R. G. (2020). The prevalence of symptoms in 24,410 adults infected by the novel coronavirus (SARS-CoV-2; COVID-19): A systematic review and meta-analysis of 148 studies from 9 countries. PloS one, 15(6), e0234765.
- Chen, X., Huang, Z., Wang, J., Zhao, S., Wong, M. C. S., Chong, K. C., ... & Li, J. (2021). Ratio of asymptomatic COVID-19 cases among ascertained SARS-CoV-2 infections in different regions and population groups in 2020: a systematic review and meta-analysis including 130 123 infections from 241 studies. BMJ open, 11(12), e049752.
- He, J., Guo, Y., Mao, R., & Zhang, J. (2021). Proportion of asymptomatic coronavirus disease 2019: a systematic review and meta-analysis. Journal of medical virology, 93(2), 820-830.
- Blair, J. E., Gotimukul, A., Wang, F., Mina, S. A., Bartels,H. C., Burns, M. W., ... & Orenstein, R. (2021). Mild to moderate COVID-19 illness in adult outpatients: characteristics, symptoms, and outcomes in the first 4 weeks of illness. Medicine, 100(24), e26371.
- Nielsen, K. J., Vestergaard, J. M., Schlünssen, V., Bonde, J.P., Kaspersen, K. A., Biering, K., ... & Kolstad, H. A. (2021). Day-by-day symptoms following positive and negative PCR tests for SARS-CoV-2 in non-hospitalized healthcare workers: A 90-day follow-up study. International Journal of Infectious Diseases, 108, 382-390.
- Vahey, G. M., Marshall, K. E., McDonald, E., Martin,S. W., Tate, J. E., Midgley, C. M., ... & Staples, J. E. (2021). Symptom profiles and progression in hospitalized and nonhospitalized patients with coronavirus disease, Colorado, USA, 2020. Emerging infectious diseases, 27(2), 385.
- Li, X., Zhong, X., Wang, Y., Zeng, X., Luo, T., & Liu, Q. (2021). Clinical determinants of the severity of COVID-19: A systematic review and meta-analysis. PloS one, 16(5), e0250602.
- Nguyen, N. T., Chinn, J., Kirby, K., Hohmann, S. F., & Amin, A. (2022). Outcomes of COVID-19 adults managed in an outpatient versus hospital setting. Plos one, 17(2), e0263813.
- Vardavas, C. I., Mathioudakis, A. G., Nikitara, K., Stamatelopoulos, K., Georgiopoulos, G., Phalkey, R., ... & Penttinen, P. (2022). Prognostic factors for mortality, intensive care unit and hospital admission due to SARS-CoV-2: a systematic review and meta-analysis of cohort studies in Europe. European Respiratory Review, 31(166).
- Cai, J., Sun, W., Huang, J., Gamber, M., Wu, J., & He, G. (2020). Indirect virus transmission in cluster of COVID-19 cases, Wenzhou, China, 2020. Emerging infectious diseases, 26(6), 1343.
- Liu, J., Liao, X., Qian, S., Yuan, J., Wang, F., Liu, Y., ... & Zhang, Z. (2020). Community transmission of severe acute respiratory syndrome coronavirus 2, Shenzhen, China, 2020. Emerging infectious diseases, 26(6), 1320.
- World Health Organization, 2. (2020). Transmission of SARS-CoV-2: implications for infection prevention precautions: scientific brief, 09 July 2020 (No. WHO/2019-nCoV/Sci_Brief/Transmission_modes/2020.3). World Health Organization.
- Bak, A., Mugglestone, M. A., Ratnaraja, N. V., Wilson,J. A., Rivett, L., Stoneham, S. M., ... & Wilson, A. P.R. (2021). SARS-CoV-2 routes of transmission and recommendations for preventing acquisition: joint British infection association (BIA), healthcare infection society (HIS), infection prevention society (IPS) and royal college of pathologists (RCPath) guidance. Journal of Hospital Infection, 114, 79-103.
- da Silva, P. G., Nascimento, M. S. J., Soares, R. R., Sousa,S. I., & Mesquita, J. R. (2021). Airborne spread of infectious SARS-CoV-2: Moving forward using lessons from SARS-CoV and MERS-CoV. Science of the Total Environment, 764, 142802.
- Wilson, N. M., Marks, G. B., Eckhardt, A., Clarke, A.M., Young, F. P., Garden, F. L., ... & Tovey, E. R. (2021).The effect of respiratory activity, nonâ?ÂÂinvasive respiratory support and facemasks on aerosol generation and its relevance to COVIDâ?ÂÂ19. Anaesthesia, 76(11), 1465-1474.
- Dave, D., McNichols, D., & Sabia, J. J. (2021). The contagion externality of a superspreading event: The Sturgis Motorcycle Rally and COVID-19. Southern economic journal, 87(3), 769-807.
- Miller, S. L., Nazaroff, W. W., Jimenez, J. L., Boerstra, A., Buonanno, G., Dancer, S. J., ... & Noakes, C. (2021). Transmission of SARS-CoV-2 by inhalation of respiratory aerosol in the Skagit Valley Chorale superspreading event. Indoor air, 31(2), 314-323.
- Majra, D., Benson, J., Pitts, J., & Stebbing, J. (2021). SARS-CoV-2 (COVID-19) superspreader events. Journal of Infection, 82(1), 36-40.
- Lednicky, J. A., Lauzardo, M., Fan, Z. H., Jutla, A., Tilly,T. B., Gangwar, M., ... & Wu, C. Y. (2020). Viable SARS-CoV-2 in the air of a hospital room with COVID-19 patients.International Journal of Infectious Diseases, 100, 476-482.
- Morawska, L., Buonanno, G., Mikszewski, A., & Stabile, L. (2022). The physics of respiratory particle generation, fate in the air, and inhalation. Nature Reviews Physics, 4(11), 723-734.
- Wang, C. C., Prather, K. A., Sznitman, J., Jimenez, J. L., Lakdawala, S. S., Tufekci, Z., & Marr, L. C. (2021). Airborne transmission of respiratory viruses. Science, 373(6558), eabd9149.
- Papineni, R. S., & Rosenthal, F. S. (1997). The size distribution of droplets in the exhaled breath of healthy human subjects. Journal of Aerosol Medicine, 10(2), 105-116.
- Edwards, D. A., Ausiello, D., Salzman, J., et al. (2021). Exhaled aerosol increases with COVID-19 infection, age, and obesity. Proc Natl Acad Sci USA,118(8).
- Gutmann, D., Scheuch, G., Lehmkühler, T., Herrlich, L. S., Landeis, A., Hutter, M., ... & Zielen, S. (2023). Aerosol measurement identifies SARS-CoV 2 PCR positive adults compared with healthy controls. Environmental Research, 216, 114417.
- Gutmann, D., Donath, H., Herrlich, L., Lehmkühler, T., Landeis, A., Ume, E. R., ... & Zielen, S. (2022). Exhaled aerosols in Sars-Cov-2 polymerase chain reaction-positive children and age-matched-negative controls. Frontiers in Pediatrics, 10, 941785.
- Johnson, G. R., & Morawska, L. (2009). The mechanism of breath aerosol formation. Journal of aerosol medicine and pulmonary drug delivery, 22(3), 229-237.
- Frieden, T. R., & Lee, C. T. (2020). Identifying and interrupting superspreading events—implications for control of severe acute respiratory syndrome coronavirus 2. Emerging infectious diseases, 26(6), 1059.
- Lin L, Liu Y, Tang X, He D. The disease severity and clinical outcomes of the SARS-CoV-2 variants of concern. Front Public Health. 2021;9:775224.
- Duecker, R. P., Adam, E. H., Wirtz, S., Gronau, L., Khodamoradi, Y., Eberhardt, F. J., ... & Schubert, R. (2021). The MiR-320 family is strongly downregulated in patients with COVID-19 induced severe respiratory failure. International journal of molecular sciences, 22(19), 10351.
- Crimi, C., Impellizzeri, P., Campisi, R., Nolasco, S., Spanevello, A., & Crimi, N. (2021). Practical considerations for spirometry during the COVID-19 outbreak: Literature review and insights. Pulmonology, 27(5), 438-447.
- Lund Berven, L., Selvakumar, J., Havdal, L., Stiansen-Sonerud, T., Einvik, G., Leegaard, T. M., ... & Wyller, V.B. B. (2022). Inflammatory markers, pulmonary function,and clinical symptoms in acute COVID-19 among nonhospitalized adolescents and young adults. Frontiers in immunology, 13, 837288.
- Xi, J., Si, X. A., Kim, J., Mckee, E., & Lin, E. B.(2014). Exhaled aerosol pattern discloses lung structural abnormality: a sensitivity study using computational modeling and fractal analysis. PloS one, 9(8), e104682.
- Boucher, R. C. (2019). Muco-obstructive lung diseases.New England Journal of Medicine, 380(20), 1941-1953.
- Ma, J., Qi, X., Chen, H., Li, X., Zhang, Z., Wang, H., ...& Yao, M. (2021). Coronavirus disease 2019 patients in earlier stages exhaled millions of severe acute respiratory syndrome coronavirus 2 per hour. Clinical Infectious Diseases, 72(10), e652-e654.
- Zhou, L., Yao, M., Zhang, X., Hu, B., Li, X., Chen, H., ...& Zhang, Y. (2021). Breath-, air-and surface-borne SARS-CoV-2 in hospitals. Journal of aerosol science, 152, 105693.
- Liu, Y., Ning, Z., Chen, Y., Guo, M., Liu, Y., Gali, N. K., ...& Lan, K. (2020). Aerodynamic analysis of SARS-CoV-2 in two Wuhan hospitals. Nature, 582(7813), 557-560.
- Alsved, M., Nygren, D., Thuresson, S., Medstrand, P., Fraenkel, C. J., & Löndahl, J. (2022). SARS-CoV-2 in exhaled aerosol particles from COVID-19 cases and its association to household transmission. Clinical Infectious Diseases, 75(1), e50-e56.
- Alsved, M., Nygren, D., Thuresson, S., Fraenkel, C. J., Medstrand, P., & Löndahl, J. (2023). Size distribution of exhaled aerosol particles containing SARS-CoV-2 RNA. Infectious Diseases, 55(2), 158-163.
- Yao, M. (2022). SARS-CoV-2 aerosol transmission and detection. Eco-Environment & Health, 1(1), 3-10.
- Fabian, P., McDevitt, J. J., DeHaan, W. H., Fung, R. O.,Cowling, B. J., Chan, K. H., ... & Milton, D. K. (2008). Influenza virus in human exhaled breath: an observational study. PloS one, 3(7), e2691.
- Fabian, P., Brain, J., Houseman, E. A., Gern, J., & Milton, D.K. (2011). Origin of exhaled breath particles from healthy and human rhinovirus-infected subjects. Journal of aerosol medicine and pulmonary drug delivery, 24(3), 137-147.
- Wurie, F. B., Lawn, S. D., Booth, H., Sonnenberg, P., & Hayward, A. C. (2016). Bioaerosol production by patients with tuberculosis during normal tidal breathing: implications for transmission risk. Thorax, 71(6), 549-554.
- Dinkele, R., Gessner, S., McKerry, A., Leonard, B., Leukes, J., Seldon, R., ... & Wood, R. (2022). Aerosolization of Mycobacterium tuberculosis by tidal breathing. American Journal of Respiratory and Critical Care Medicine, 206(2), 206-216.