
Journal of Electrical Electronics Engineering(JEEE)
ISSN: 2834-4928 | DOI: 10.33140/JEEE
Impact Factor: 1.2


Research Article - (2025) Volume 4, Issue 4
A Statistical Study on the Effect of Banning the Manufacture, Sale, and Use of Polystyrene Foam on Reducing Beach Litter (A Case Study in Japan)
Received Date: Jun 10, 2025 / Accepted Date: Jul 21, 2025 / Published Date: Jul 28, 2025
Copyright: ©Â©2025 Kentoku Funaki. This is an open-access article distributed under the terms of the Creative Commons Attribution License, which permits unrestricted use, distribution, and reproduction in any medium, provided the original author and source are credited.
Citation: Funaki, K. (2025). A Statistical Study on the Effect of Banning the Manufacture, Sale, and Use of Polystyrene Foam on Reducing Beach Litter (A Case Study in Japan). J Electrical Electron Eng, 4(4), 01-09.
Abstract
Analyzing the results of a survey of the composition of beach litter in 35 prefectures and the data on the amount of polystyrene foam shipped in domestic resin product consumption, it was found that the population of the former was the latter, and that randomly extracted data from that was beach plastic litter. However, a test of population ratios showed that the average proportion of polystyrene foam in the domestic product consumption of the former, 1.6%, was significantly different from the proportion of polystyrene foam in beach litter, 3.6%. In other words, the average value of the latter proportion is about twice the average value of the former, and statistically, polystyrene foam can be said to be a product that is easily scattered outdoors. Furthermore, if the manufacture, sale, and use of polystyrene foam were banned, it would be possible to reduce the amount of plastic littering on beaches by about 4% by weight and about 10% by volume. The conclusion of this paper is that if a deposit system for PET were adopted, it could be possible to reduce plastic litter by 20 to 30 percent in terms of weight.
Keywords
Styrofoam, PET Bottles, Test of Parent Ratio, Microplastics, Drifting Waste
Introduction
I became a senior overseas volunteer 20 years ago and was assigned to Thailand, where worked as an advisor on waste collection and processing in Chiang Mai and Bangkok for two years each. Ten years ago, worked for a year and a half in river surface cleaning work carried out by the Tokyo Metropolitan Government, where floating waste was picked up in rivers with a dip net from a boat in order to understand the state of waste scattered on the coasts and in rivers. Based on these two experiences, in this paper, I would like to introduce the results of an analysis of the "Drifting Debris Data Sheet" which was started by local governments when the "Act on Promotion of Processing of Coastal Drift Debris Related to the Conservation of Beautiful Landscapes and the Environment on the Coast to Protect Beautiful and Rich Nature" ("Coast Drift Debris Processing Promotion Act") was promulgated and enforced on July 15, 2009, and present measures to prevent styrofoam and PET bottles from being scattered on the coast. This paper is based on the essay presented at the Waste Management Society Research Presentation in September 2024, titled "The Situation of Styrofoam Scattering from the Perspective of River Surface Cleaning Work and Solutions"), and "Uncovered the Identity of Missing Plastics! Proposal for Prohibiting the Manufacture, Sale and Use of Styrofoam", and is the result of an analysis and investigation of the above data that I independently collected [1,2].
Characteristics of Floating River Debris
Most floating river debris is disposable container packaging [3]. Plastic bottles of all sizes, energy drink bottles, steel cans, aluminum cans, spray cans, disposable lighters, shopping bags, clear bags, and viscous drink containers are all floating down the drain. There are also a considerable number of black plastic pots for seedlings. Smaller items include cigarette butts and filters, plastic packaging for individual snacks, and plastic bottle caps. Just as the pull tops of aluminum cans once came loose and scattered in the open, causing problems, and the pull top system was abolished, plastic bottle caps should also be made mandatory so that they do not come off the bottle (cigarette butts, filters, snack packaging, etc. slip through the mesh and cannot be picked up).
On the other hand, beer bottles are not floating down the drain. This is probably because of the 5-yen deposit system.
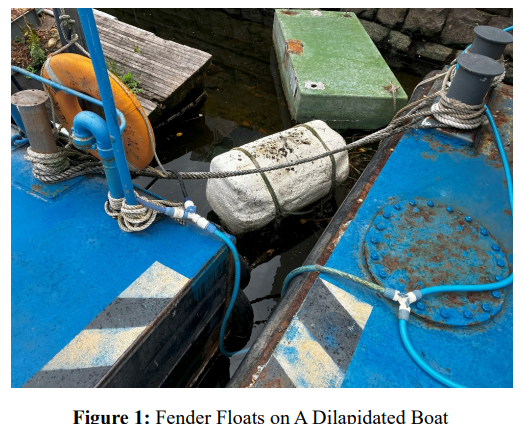
Styrofoam trays, plates, and cups for cup noodles are troublesome. They are easily blown away by the wind, and are difficult to pick up as they become small. Plastic bags and transparent bags become heavier than water as they drift, so they are not easy to find and pick up. There are many cases of illegal dumping, where plastic bags with plastic lunch boxes inside are simply thrown away. I am particularly concerned about polystyrene foam boxes and trays. In the former, the polystyrene foam of the floats used to protect boats from scratches at boat storage areas has become tattered, and if a boat hits them, the polystyrene particles will fall off (Figure 1).
On the beach, polystyrene boxes had washed up, and their broken remains were scattered along the path down to the beach (Figure 2). If they become polystyrene particles, it is impossible to pick them up. The same goes for polystyrene foam floats used in fishing gear. Regarding old polystyrene foam floats, I would like to propose that a system be established to expedite the collection of these floats and to provide subsidies for those who submit them to public institutions in order to prevent them from being accidentally ingested by living creatures or becoming microplastics.
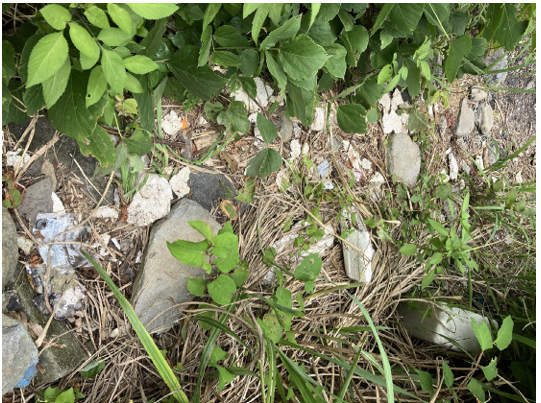
Figure 2: On the Beach, Styrofoam Boxes had Washed up, and their Broken Remains were Scattered Along the Path Down to the Beach
What is Styrofoam?
There are three types of Styrofoam that are generally called Styrofoam, depending on the manufacturing method and use (the following explanation is based on the Styrofoam Association website). EPS (Expanded Polystyrene), also known as the bead- method styrofoam, is made by foaming and molding the raw material beads, and is often box-shaped, making it easy to store and transport fresh foods such as fish. PSP (Polystyrene Paper), also known as styrofoam trays, is made by cutting sheet-shaped styrofoam into a mold and is mainly used as a food container. XPS (Extruded Polystyrene), a plate-shaped foam extruded from an extruder and used as insulation for homes and condominiums, and as the core material for tatami mats, is also used. This article focuses on two types of polystyrene: EPS, also known as the bead- method styrofoam, and PSP, also known as styrofoam trays. Both are light and easily blown away by the wind, and when used, the beads tend to spill and scatter into the environment. If they are taken out into the open, it is almost impossible to pick them up. It can be said that it is the most susceptible to becoming microplastic out of all plastics. I think it is necessary to hurry up with the shift to cardboard and biodegradable materials. In the first place, is something that is in a state where the material that makes up the body crumbles and scatters from the main body as it is used, worthy of being a product? Ideally, the pieces that crumble and scatter will have no impact on living organisms in the environment, but since it is plastic, although it will continue to deteriorate and break down into smaller particles, it will not decompose in the environment and will remain floating in the ocean and air for a long time. Microplastics have already been found not only in fish and shellfish, but also in the human body4), and I believe that their production, sale, and use should be banned worldwide.
In this article, I add PET bottles to styrofoam, for which data is readily available, to provide statistical evidence of how easily these two products scatter among plastics, and hope to aid in decisions regarding bans on their production, sale, and use.
In this article, styrofoam will be abbreviated as ESP and PET bottles as PET.
Survey Method: How to Determine the Likelihood of Scattering Flow of Data Acquisition from the Production of ESP and PET to Being Picked Up on the Beach
Production Volume of ESP and PET
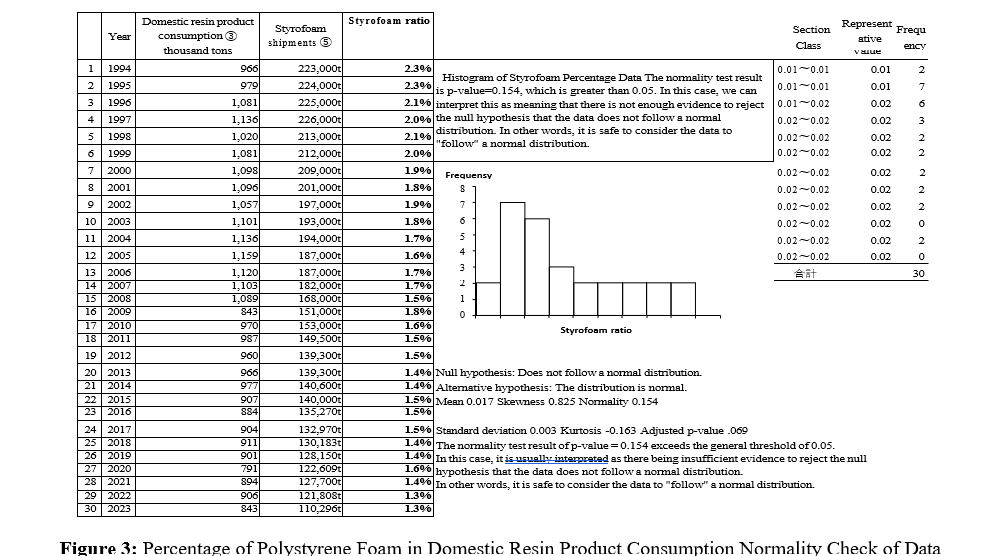
When EPS and PET are produced, the statistical data is as follows: First, as data on the amount of plastic production, the Plastic Waste Management Association publishes data on the change in domestic consumption of resin products over time [5]. In addition, data on the amount of polystyrene foam shipped was obtained from the Expanded Polystyrene Association, and for PET, data on the actual demand for PET resin for bottles was obtained from the PET Bottle Recycling Promotion Council [6,7]. The proportion of the actual demand for polystyrene foam in domestic consumption of resin products and the proportion of the change in PET over time were obtained. In addition, when the normality was checked only for the time series data of the proportion of ESP in domestic consumption of resin products, a histogram like that shown in Figure 3 was created, and since the P value is 0.154 and exceeds 0.05, the null hypothesis that "the null hypothesis does not follow a normal distribution" is not rejected. The time series data on the proportion of ESP in domestic resin product consumption can be considered to follow a normal distribution.
Dynamics of EPS and PET in the Environment After Use EPS and PET are used as polystyrene boxes and trays, and after use as beverage bottles, they are intentionally or due to wind, rain, floods, etc., and flow into the sea through rivers, and some of them drift in the ocean, while others are washed up on the coast and remain there. Remaining EPS and PET are collected and classified as "drifting waste" every year based on the survey method recommended by the Ministry of the Environment, described below, and the minimum requirements for "number and weight" or "number and volume" are measured and recorded for each item shown on the data sheet. If possible, all of the "number", "weight", and "volume" are measured, and the results are reported to the Ministry of the Environment every year.
About the Beach Litter Data Sheet
In order to grasp the actual situation of beach litter and to implement effective measures to prevent its generation, each prefecture has been conducting surveys to grasp the composition and amount of beach litter (in FY2011, surveys were conducted in 39 prefectures and 89 locations) based on the guidelines for surveying the composition of beach litter for local governments provided by the Marine Environment Office, Water Environment Division, Water and Air Environment Bureau, Ministry of the Environment since FY2019 [8]. According to the above guidelines, the survey targets litter with a length of 2.5 cm or more, and the results of the survey on the composition of beach litter are entered into the dedicated "Beach Litter Data Sheet" in Excel, which has been used since FY2019, and reported to the Ministry of the Environment. The collected data is "organized in the form of a ranking of the actual situation of beach litter collection in each prefecture and evaluated as the amount of effort for collection, with the aim of increasing motivation for collection work and contributing to the promotion of effective and efficient implementation of collection and processing work nationwide [9]. The results of this survey are published every year under the title "Results of the compilation of data on the composition of beach litter" Individually completed "marine litter data sheets" are not made public, and the data is aggregated and published as national rankings for each item, coastal zone sorting rankings taking ocean currents into account, percentages by written language and country, and amount of washed-up plastic. I asked the Ministry of the Environment to publish marine litter data sheets for each prefecture, but was told they could not do so because the data was aggregated on the premise that it would not be made public. Therefore, I sent emails to local governments that do not publish the information on their websites, requesting that they release the information. All but Tokyo agreed to release the information, and the analysis was based on the collected data. In addition, because the waste is beached on the coast, the data was analyzed for six prefectures (Tochigi, Yamanashi, Nagano, Gifu, Shiga, and Nara) excluding Saitama Prefecture, which does not have a coast, and for PET in III-6 of the Ministry of the Environment's "Reiwa 5 Comprehensive Review Work Report on Understanding the Actual Situation of Marine Litter and Efficient Collection" 9, which states that "In Nagasaki, Yamaguchi, and Shimane prefectures, more than 80% were products with foreign language labels," for these three prefectures and Okinawa Prefecture, and there is a risk that the nature of the data may be influenced by overseas, so this paper analyzes 35 prefectures, excluding 12 prefectures in total.
In this paper, for prefectures with multiple survey sites, the data is aggregated and tabulated in one "Beached Litter Data Sheet" because the degree of influence of the trends of municipalities with multiple survey sites will be large if the data is summarized as multiple. R4 and R5 in the table refer to data for fiscal years 2022 and 2023, respectively. In this paper, due to the limited data collection, the analysis also included the two years of 2022 and 2023.
Furthermore, when analyzing beached waste, weight is the main focus, and as the "natural matter" and "other" categories sometimes contain excessively high figures, these have been excluded from the analysis in this paper.
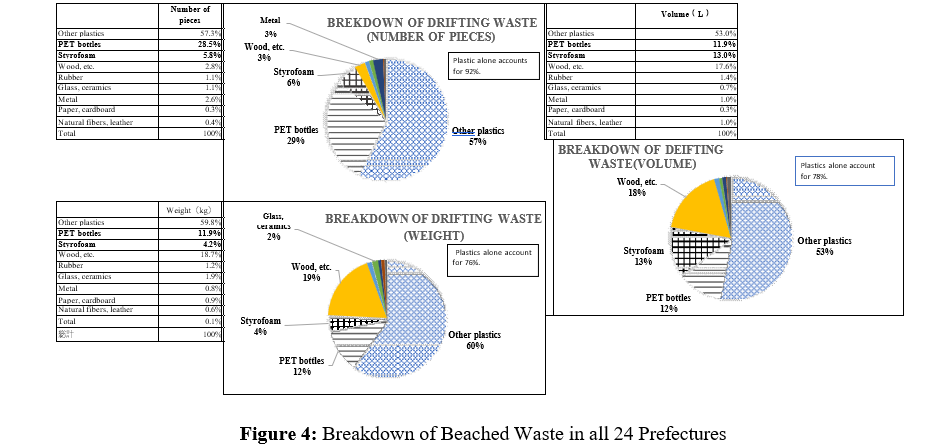
Characteristics of Drifting Waste
Looking at the 24 prefectures for which the number, volume, and weight are all available, as shown in Figure 4, plastics account for 92% of drifting waste by number, 78% by volume, and 76% by weight, meaning that, excluding wood, most drifting waste is plastic. Among them, polystyrene foam accounts for 6% by number, 13% by volume, and 4% by weight. PET account for 29% by number, 12% by volume, and 12% by weight.
Statistical Survey Method for The Scattering Tendency of Polystyrene Foam
How can the scattering tendency of EPS and PET be statistically evaluated? In this paper, I evaluated it using a statistical survey called "Test of population ratio" [10].
Time Series Data on The Proportion of Polystyrene Foam in Domestic Consumption of Resin Products (Data A)
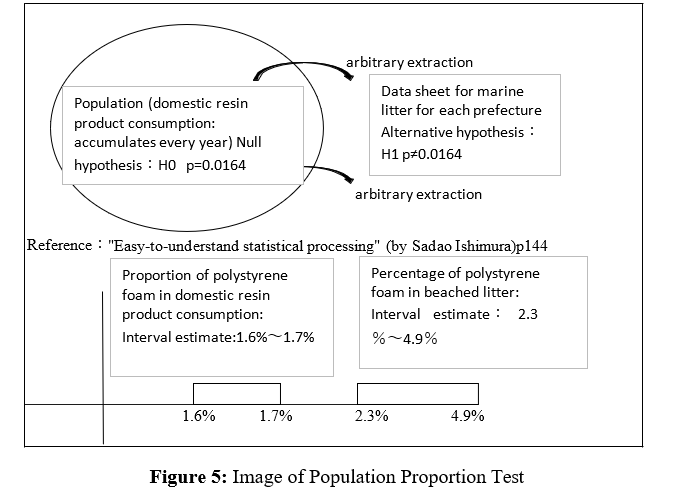
Looking at the proportion of polystyrene foam in drifting waste by prefecture (Data B), Data A is considered to be the population of Data B. Figure 5 shows an image of this. Styrofoam boxes and trays are produced every year and discharged into the environment. Some of these are scattered on the coast through rivers, and some of these are randomly selected by prefecture as drifting waste, resulting in data B.
Results of the Population Proportion Test
In the population proportion test (bottom of Table 1), the null hypothesis is that the 20-year average proportion of styrofoam in domestic consumption, which is the population, is 1.6% (data A), and the proportion of styrofoam in drifting waste in each prefecture, which is randomly selected from 20 cases, is the same 1.6%. As a result of the population proportion test, the p-value is less than 0.05, so the null hypothesis that the proportions are the same is rejected, and the alternative hypothesis that the proportions are not the same, the average proportion of data A, 3.6% (estimated interval 2.3% to 4.9% at a significance level of 5%), is adopted. As can be seen in the lower interval estimate of Figure 5, the interval estimates of 1.6-1.70% for "the proportion of polystyrene foam in domestic resin product consumption" does not overlap with the interval estimate of 2.3-34.9% for "the proportion of polystyrene foam in marine litter." The proportion of polystyrene foam in marine litter is roughly twice as high as the proportion of polystyrene foam in plastic products at the time of production, and polystyrene foam products are roughly twice as likely to scatter.
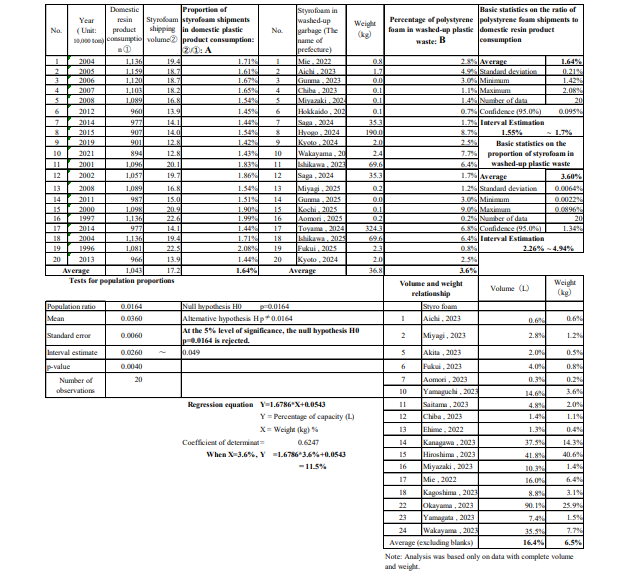
The above is a view on weight. Regarding volume, the following regression equation can be created from the relationship between weight and volume (bottom right of Table 1).
Regression equation Y (volume) = 1.6786 x X + 0.0543, coefficient of determination 0.6247 If X = 3.6% is substituted into this equation, Y = 11.5%. In other words, if restrictions are imposed on the manufacture, sale, and use of polystyrene foam, the regression equation above suggests that plastic scattering could be reduced by about 4% by weight and about 10% by volume.
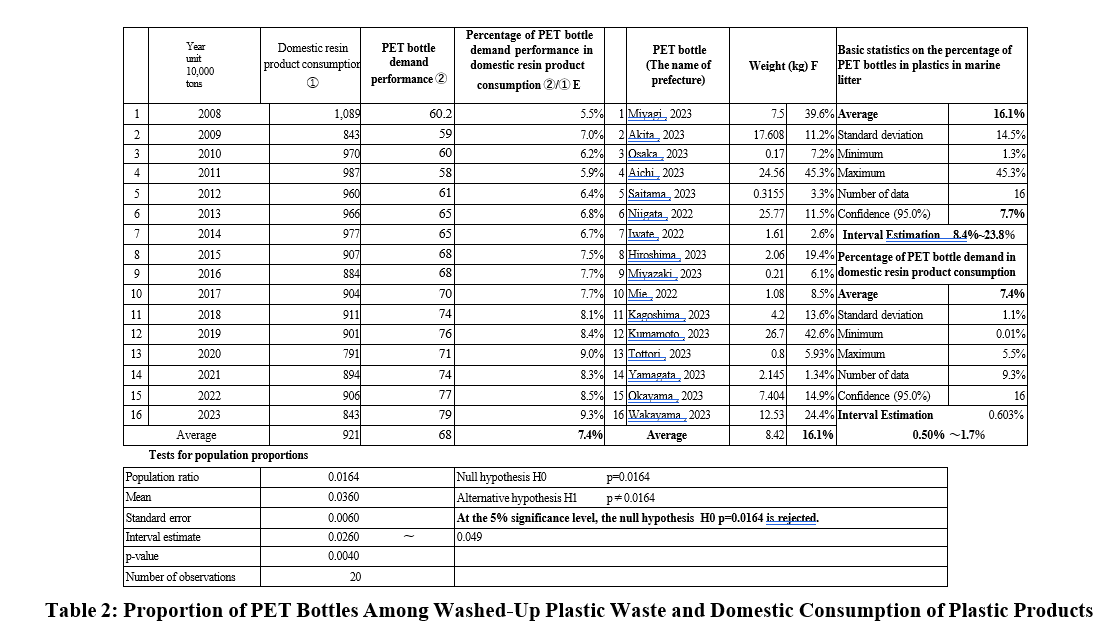
Similarly, for PET in Table 2, the 16-year average proportion of PET in the population of domestic consumption (7.4% data E) is the same as the null hypothesis that the proportion of PET in the drifting waste of each prefecture (16 randomly selected cases from that population) is the same average proportion of 7.4%. As a result of the population proportion test, the p-value is less than 0.05, so the null hypothesis that the proportions are the same is rejected, and the alternative hypothesis that the proportions are not the same, the average proportion of the F data, 16.1% (estimated interval 8.4% to 23.8% at a significance level of 5%), is adopted. The proportion of PET in drifting waste is roughly twice as high as the proportion of PET in plastic products at the time of production, and like styrofoam products, PET are roughly twice as likely to scatter.
As styrofoam and PET are prone to scattering, some kind of regulation should be imposed to prevent them from scattering, and environmental economic measures are required to switch to materials that are biodegradable even if they are scattered. So, what kind of regulations are imposed overseas?
Styrofoam and PET Regulations Overseas
For overseas information, the following are useful references for gathering information: JETRO's Business Brief and the Environment Observatory of the Ministry of the Environment's National Institute for Environmental Studies [11,12].
In the United States, New York City, San Francisco, and Los Angeles have enacted ordinances banning the use of EPS, and have banned the distribution and sale of disposable polystyrene foam.
In the EU, the Disposable Plastics Directive was issued in Septem- ber 2019, banning the distribution of disposable plastic products such as plastic cutlery such as knives and forks, EPS beverage containers (including lids and caps), and cups in the EU market
In the United Nations, the Intergovernmental Negotiating Com- mittee (INC) was launched in February 2022 to discuss "Ending Plastic Pollution: A Legally Binding International Treaty," and dis- cussions are currently ongoing for the fifth time, but no agreement has been reached. Japan has proposed the Osaka Blue Ocean Vi- sion, which aims to reduce additional pollution from marine plas- tic waste to zero by 2050, and is leading the discussion.
Alternatives to EPS
EPS can be replaced by, for example, pulp foam molded products sold by Nissha Co., Ltd., which can be recycled as paper, and biodegradable cellulose nanofibers (CNF), which are made in Japan, have also been developed, but they have not yet become widespread among the general public. It seems that plastic EPS is not viable due to the price, etc. I hope that an environmental tax will be imposed on EPS to open the way for the conversion to these alternative materials.
Adoption of a Deposit System for PET
How do I pick up PET that is scattered outdoors? First of all, I would like to prevent the caps from being scattered, such as by making the caps not detachable from the PET itself. In this analysis, there was no statistically significant difference in the population ratio when comparing the data on caps with the data on PET itself. If a system were put in place to pick up PET without compulsion after they are scattered, it would save the country money and taxes. It would be best to adopt a deposit system for PET. In other words, a system would be established in which consumers would pay an extra 5 to 10 yen per PET in advance, and would get the money back if they returned it to the store after use. This would encourage consumers to voluntarily return PET to the store. If PET are left out in the wild, either intentionally or unintentionally, they would be given a 5 to 10 yen deposit if they were returned to the store, so it is expected that someone will pick them up. It would also be expected to cover some of the costs incurred when volunteers clean up the beaches. It would be a good idea to consider this not only in Japan, but also overseas.
What was disappointing about this study was that the Ministry of the Environment's project only published the results of the data in a ranking format, and did not check whether the data was compiled correctly or have the idea of open data, such as publishing the data for researchers to use in their research and analysis. The beach litter data sheet also used combined columns, making it very difficult to compile the data. Also, please standardize the rows and columns of the sheets so that I can do a cross-sectional tally.
Conclusion
Recently, microplastics have further deteriorated, breaking down into nano-sized particles measuring one billionth of a meter, and floating in the air and water. They have also been detected in drinking water, human lungs, and the placenta of pregnant women, becoming a major problem [4]. I am particularly concerned about polystyrene foam. It is a product that is most likely to turn into microplastics, as plastic particles scatter around. I believe that we should first try to switch from polystyrene foam to marine biodegradable plastics that can be decomposed in the ocean.
In this paper, a test was conducted on the proportion of polystyrene foam shipped in domestic resin product consumption and the proportion of polystyrene foam in washed-up plastic waste. The null hypothesis was that the 20-year average proportion of polystyrene foam in domestic consumption, which is the population, is 1.6%, and that the proportion of polystyrene foam in washed-up waste in each prefecture, which was randomly selected from 20 cases, is the same 1.6%. As a result of the test, the null hypothesis was rejected and the alternative hypothesis that the proportions are not the same, that is, the average proportion of 3.6%, was adopted. The proportion of polystyrene foam in washed-up waste is about twice as high as the proportion of polystyrene foam in plastic products when they were produced, and polystyrene foam products are about twice as likely to scatter. Similarly, for PET, the proportion of PET in washed-up waste is about twice as high as the proportion of PET in plastic products when they were produced, and it can be said that PET are about twice as likely to scatter. If the manufacture, sale, and use of polystyrene foam were banned, the amount of drifting plastic litter on the beach could be reduced by 2-5% by weight, and by about 10% by volume. If a deposit system for PET is also adopted, the conclusion of this paper is that the amount of plastic littering could be reduced from the lower limit of the interval (1.6% + 8.4% = 10%) to the upper limit (4.9% + 23.8% = about 30%).
How to Conduct the Same Survey Abroad
In this paper, I investigate the percentage (A) of polystyrene foam (or PET bottles) in plastics consumed in the country (imports and production), and the percentage of polystyrene foam (or PET) in plastic waste in the results of a composition survey of beach debris measuring 2.5 cm or more. By rejecting the null hypothesis that A and B are the same percentage through a population proportion test, I conclude that the percentages of A and B are different, and that the percentage of B is significantly higher than A. I believe that the key is how to obtain data on the consumption of the product being investigated.
Acknowledgement
I would like to thank the local governments who provided us with the Excel "Drifting Litter Data Sheet". However, if possible, I would like you to publish it on your homepage, and to publish it in Excel, which can be analyzed, rather than in PDF, which cannot be processed. In addition, the homepage (https://ilovepdf.com/ja) set up by the I LOVE PDF team was very useful in converting the PDF data to Excel this time. I would like to take this opportunity to express our deepest gratitude.
References
- Funaki, K. (2024). “Scattering of polystyrene foam from the perspective of river surface cleaning work and its solutions”. Proceedings of the 35th Research Presentation Meeting of the Japan Society of Waste Management.
- Funaki, K. (2025). Uncovered the Identity of Missing Plastics! Proposal for Prohibiting the Manufacture, Sale and Use of Styrofoam, Journal of Electrical Electronics Engineering. ISSN: 2834-4928.
- Funaki, K. (2017). “Plastic dynamics from river surface cleaning work.” Monthly Waste, January 2017 issue, pp.38- 39.
- Okochi, Hiroshi, Yoshida, Nobunaga, Niida, Yasuhiro, Itaya, Yohei, Katsumi, Naoya, Takada, Hideshige. (2020). Current status of research on atmospheric microplastics and their impact on health and the global environment, Marine Plastic Litter Academic Symposium.
- Plastic Waste Management Institute: Data on the secular trends in domestic resin product consumption.
- Japan Polystyrene Foam Association: Data on the volume of polystyrene foam shipped.
- PET Bottle Recycling Promotion Council: Data on actual demand for PET resin.
- Marine Environment Office, Water Environment Division, Water and Air Environment Bureau, Ministry of the Environment: Guidelines for investigating the composition of drifting garbage for local governments, FY2019.
- Ministry of the Environment: Comprehensive study report on understanding the actual situation of marine garbage and efficient collection in FY2023, pâ?¡-1.
- Ishimura, S. (1994). Easy-to-understand statistical processing. Tokyo Tosho, p144, May.
- JETRO Business News.
- Ministry of the Environment. National Institute for Environmental Studies, Environmental Observatory.