
Annals of Civil Engineering and Management(ACEM)
ISSN: 3065-9779 | DOI: 10.33140/ACEM


Review Article - (2026) Volume 3, Issue 1
A Smart Room-Centric Digital Architecture for Offshore Asset Integrity: Integrating IoT Sensor Networks with Inspection and Maintenance Decision- Making
Received Date: Jan 06, 2026 / Accepted Date: Jan 27, 2026 / Published Date: Feb 02, 2026
Copyright: ©2026 Anu Omolegbe. This is an open-access article distributed under the terms of the Creative Commons Attribution License, which permits unrestricted use, distribution, and reproduction in any medium, provided the original author and source are credited.
Citation: Omolegbe, A. (2026). A Smart Room
Abstract
Background/Problem: The management of asset integrity in the mature offshore oil and gas sector is increasingly challenged by aging infrastructure, cost-optimization pressures, and a persistent topside digitalization lag. Current practices rely on fragmented data streams—siloed IIoT sensor networks, disparate inspection databases, and transactional Computerized Maintenance Management Systems (CMMS) leading to delayed, reactive maintenance decisions and sub-optimal resource allocation.
Objective: This paper proposes and validates a novel Smart Room–Centric Digital Architecture designed to overcome these data silos and unify real-time asset condition data directly into the maintenance execution workflow. The objective is to demonstrate a pragmatic, scalable model for transitioning from static Risk-Based Inspection (RBI) to dynamic, Condition-Based Maintenance (CBM).
Methods: The architecture is structured in four layers: Perception (ATEX-certified IIoT sensors and LPWAN gateways), Network, Data Management (Integration Core and Integrity Modeling Engine), and Application (the collaborative Smart Room Dashboard). Its efficacy was demonstrated via a 12-month field case study on a North Sea production platform, evaluated using quantitative operational Key Performance Indicators (KPIs) and qualitative stakeholder feedback. The Integration Core was specifically engineered to interface bi-directionally with legacy CMMS (e.g., IBM Maximo) for automated work order generation.
Key Results: The implementation yielded significant operational improvements. The Mean Time to Acknowledge Integrity Alerts (MTTA) was reduced by 91.5%, from an average of 4.2 days to 8.5 hours. Inspection prioritization accuracy, based on actionable findings, improved by 24% (from 68% to 92%). This rapid response capability resulted in a 30% shift toward CBM and a 35% reduction in the corrective maintenance backlog. Furthermore, the Smart Room fostered enhanced onshore/offshore collaboration, leading to a 40% reduction in time spent on data gathering for critical decisions. Critical adoption challenges, including data quality issues and organizational change resistance, are detailed alongside a pragmatic change-management framework.
Conclusion: The study provides a scalable, field-tested model for digital transformation in brownfield offshore environments. It demonstrates that integrated data visibility, facilitated by the Smart Room architecture, directly supports safer, more efficient integrity management, positioning operators to sustain safe operations and extend the life of aging assets in a cost-conscious era.
Keywords
Asset Integrity Management (AIM), Digital Transformation, Smart Room, Industrial IoT (IIoT), LPWAN, Risk-Based Inspection (RBI), CMMS (IBM Maximo), Offshore Operations, Condition-Based Maintenance (CBM), ATEX-Certified Sensors
Introduction
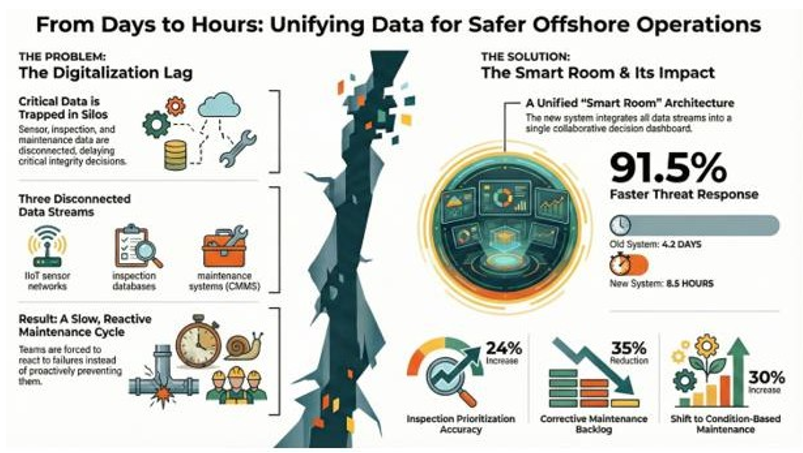
Figure 1: A Smart Room-Centric Digital Architecture for Offshore Asset Integrity and Maintenance
The upstream oil and gas sector, particularly the mature offshore segment, operates under a confluence of systemic pressures that demand a fundamental re-evaluation of operational technology (OT) and asset integrity management (AIM) strategies. The industry imperative is defined by a "lower for longer" commodity price environment, compelling operators to aggressively optimize operational expenditure (OPEX) while simultaneously managing an aging global asset base [1]. Compounding this economic challenge is the non-negotiable safety and regulatory mandate for flawless asset integrity, a requirement underscored by high-consequence events and increasingly stringent international standards, such as those promulgated by the American Petroleum Institute (API) and the International Organization for Standardization (ISO) [2]. The confluence of aging infrastructure, cost compression, and heightened regulatory scrutiny creates a critical need for pragmatic, scalable digital solutions that transition AIM from a time-based or reactive model to a predictive, condition-based paradigm.
The Digitalization Lag in Topside Operations
Despite significant advancements in the digitalization of the subsurface where petrotechnical workflows leverage sophisticated, integrated data models for reservoir characterization and production optimization a notable digitalization lag persists in topside operational and maintenance domains. This disparity is particularly acute in the realm of asset integrity. Current practices often rely on fragmented, siloed data streams that impede timely and effective decision-making. Specifically, three critical data sources remain poorly integrated:
• IIoT Sensor Networks: While the deployment of Industrial Internet of Things (IIoT) sensors, particularly ATEX-certified devices in hazardous areas, has increased, these initiatives often remain in pilot purgatory. Data from low-power wide-area networks (LPWAN) monitoring critical parameters such as acoustic emissions for leak detection, vibration analysis for rotating equipment, or corrosion under insulation (CUI) monitoring frequently resides in isolated data lakes, disconnected from the core maintenance workflow.
• Inspection and Non-Destructive Testing (NDT) Data: Detailed inspection reports, including photographic evidence, NDT results, and visual assessments, are typically stored in document management systems or proprietary databases. The qualitative nature of this data, coupled with manual transcription and delayed entry, makes real-time correlation with operational data nearly impossible.
• Computerized Maintenance Management Systems (CMMS): Core systems like IBM Maximo or SAP PM, which govern work order generation, resource allocation, and maintenance history, operate as transactional records. They reflect what was done rather than what should be done next based on real-time asset condition.
This systemic data fragmentation results in a reactive maintenance cycle. Risk-Based Inspection (RBI) programs, while conceptually sound, struggle to dynamically prioritize inspection campaigns because the "risk" input is based on static, scheduled data rather than the current, real-time condition of the asset. The consequence is sub-optimal resource deployment, unnecessary offshore travel, and an elevated risk profile due to delayed threat identification. The core problem is not a lack of data, but a lack of a unified, collaborative digital architecture to translate disparate data streams into actionable, workflow-integrated intelligence.

Figure 2: Conceptual Diagram of the Digitalization Lag in Upstream O&G, Contrasting Advanced Subsurface Data Integration with Fragmented Topside Operational Technology (OT)
Thesis: The Smart Room-Centric Digital Architecture
This paper introduces and validates a Smart Room-Centric Digital Architecture as a pragmatic, integrative solution to overcome the topside digitalization lag. We posit that the most effective path to achieving Condition-Based Maintenance (CBM) and dynamic RBI prioritization is not through the immediate, costly pursuit of a comprehensive digital twin, but through the establishment of an essential collaborative decision cockpit the Smart Room supported by a robust, unified data architecture. The proposed architecture is centered on three key integration layers:
• Data Ingestion and Normalization: A standardized pipeline for ingesting high-frequency, low-bandwidth data from LPWAN sensor gateways alongside structured and unstructured data from inspection databases and CMMS records.
• Integrity Modeling Engine: A layer that applies physics-of-failure models and machine learning algorithms to the normalized data, dynamically calculating asset health scores and updating the probability of failure (PoF) component of the RBI matrix in near real-time.
• The Smart Room Interface: A unified, role-based visualization and collaboration platform that serves as the single pane of glass for offshore and onshore teams. This cockpit translates complex data correlations into simple, actionable intelligence prioritized work orders, dynamic inspection schedules, and immediate threat alerts directly feeding back into the CMMS workflow. This model is deliberately pragmatic, focusing on Minimum Viable Digitalization (MVD) for integrity. It leverages existing CMMS and inspection systems while providing the necessary integration layer to unify LPWAN sensor streams, historical integrity data, and maintenance planning into a single, actionable workflow.
Objective, Research Gap, and Paper Structure
The primary objective of this research is to present a detailed, technical blueprint of the Smart Room-Centric Digital Architecture and to validate its efficacy using real-world offshore field cases. We demonstrate how this architecture enables a quantifiable shift from reactive to proactive maintenance, resulting in measurable improvements in inspection prioritization, threat response times, and offshore-onshore collaboration. The existing body of literature often focuses on either the theoretical potential of Digital Twins or the technical specifications of individual IIoT components [3,4]. A significant research gap exists in the documentation of holistic, scalable models that successfully bridge the entire operational technology lifecycle: from the ATEX-certified sensor at the point of measurement, through the data pipeline, to the collaborative decision-making process in the Smart Room, and finally, to the automated generation of a CMMS work order. This paper fills that gap by providing a practical, field-tested framework for digital transformation in brownfield offshore environments. The remainder of this paper is structured as follows: Section II details the technical specifications of the Digital Architecture Framework, including data models and integration protocols. Section III presents two distinct offshore field case studies, quantifying the impact of the architecture on RBI and CBM programs. Section IV discusses the critical change management strategies and organizational adoption challenges inherent in this transformation. Finally, Section V summarizes the key findings, outlines the measurable benefits, and proposes a scalable digital transformation model for the wider upstream sector.
Literature Review
The Digital Evolution of Offshore Asset Integrity
The trajectory of Asset Integrity Management (AIM) in the upstream oil and gas sector reflects a continuous drive to mitigate risk, reduce operational expenditure (OPEX), and ensure regulatory compliance in increasingly challenging environments. This review systematically examines the foundational literature across four thematic areas: the evolution of AIM methodologies, the enabling role of offshore Industrial Internet of Things (IIoT) and Low-Power Wide-Area Networks (LPWAN), the current state of Digital Twins and decision support systems in operations, and the pervasive technical and organizational barriers to digital integration.
Asset Integrity Management Evolution: From Time- Based to Continuous Monitoring
The historical foundation of maintenance strategy, Time-Based Maintenance (TBM), mandated inspection and overhaul activities based on fixed calendar intervals or operating hours [1]. While simple to implement, TBM is inherently inefficient, leading to unnecessary maintenance (over-maintenance) and high resource consumption, or conversely, failing to detect degradation mechanisms that accelerate unexpectedly between scheduled intervals (under-maintenance) [2]. The limitations of TBM, particularly in the context of aging offshore infrastructure and the "lower for longer" cost environment, necessitated a paradigm shift. The industry responded with the widespread adoption of Risk-Based Inspection (RBI), codified in standards such as API 580/581 and ISO 31000 [3]. RBI fundamentally shifts the focus by prioritizing inspection and maintenance activities based on a quantitative or qualitative assessment of risk, defined as the product of the Probability of Failure (PoF) and the Consequence of Failure (CoF). This methodology ensures that resources are concentrated on high-risk assets, optimizing inspection cycles and reducing unnecessary downtime [4]. However, traditional RBI is a static or quasi-static process. The PoF calculation relies heavily on historical data, scheduled inspection results, and generic failure curves, meaning the risk profile is updated infrequently, typically on an annual or biennial cycle. This latency prevents the system from reacting to real-time changes in asset condition or operational stressors. The emerging paradigm is Condition-Based Monitoring (CBM), which seeks to dynamically update the PoF component of the RBI matrix using real-time operational data [5]. CBM, and its more advanced form, Continuous Integrity Monitoring (CIM), leverages sensor data and predictive analytics to forecast the remaining useful life (RUL) of components. This transition is crucial for moving beyond reactive and scheduled maintenance to a truly predictive model, where maintenance is executed precisely when the asset condition dictates, maximizing uptime and minimizing the risk of catastrophic failure [6]. The literature highlights that the successful implementation of CIM is contingent upon a robust, reliable, and integrated data acquisition architecture, which is particularly challenging in the remote, hazardous offshore environment.

Figure 3: Evolution of Offshore Maintenance Strategy, Illustrating the Shift from Time-Based Maintenance (TBM) to Dynamic Continuous Integrity Monitoring (CIM)
Offshore IIoT and LPWAN: Enabling Technologies for CIM
The deployment of sensor technology in the offshore environment is governed by unique and stringent requirements, primarily driven by safety and logistics. Any electronic device operating in the topside process areas must possess ATEX or IECEx certification for use in hazardous areas (Zone 1 or Zone 2), ensuring intrinsic safety and preventing ignition [7]. Traditional instrumentation, often hardwired and integrated into the Distributed Control System (DCS) or Supervisory Control and Data Acquisition (SCADA) systems, is high-bandwidth and focused on process control variables (e.g., pressure, temperature, flow). While essential, these systems are prohibitively expensive and complex to retrofit for the dense, non-process-critical integrity monitoring required for CIM. The solution lies in the proliferation of Industrial Internet of Things (IIoT) devices, specifically those utilizing Low-Power Wide-Area Network (LPWAN) protocols (e.g., LoRaWAN, NB-IoT, proprietary mesh networks) [8]. LPWAN technology is uniquely suited for brownfield offshore assets due to three critical characteristics:
• Low Power Consumption: Enabling multi-year battery life, which is essential for sensors installed in difficult-to-access locations, minimizing the need for costly and hazardous offshore maintenance trips.
• Long Range and Penetration: Providing reliable wireless connectivity across large topside structures, penetrating steel bulkheads and decks, which is a significant challenge for standard Wi-Fi or Bluetooth protocols.
• Low Data Rate: Sufficient for integrity monitoring applications such as intermittent wall thickness readings, low-frequency vibration analysis for slow-speed machinery, or binary state changes (e.g., valve position), where high-bandwidth is unnecessary [9].
Literature reviews on offshore IIoT applications demonstrate successful pilot deployments for monitoring Corrosion Under Insulation (CUI), a major integrity threat often missed by visual inspection; wireless vibration analysis for non-critical rotating equipment; and acoustic emission (AE) monitoring for early-stage leak detection in piping systems [10]. The critical distinction from traditional SCADA is that IIoT/LPWAN focuses on condition data for asset health, while SCADA focuses on operational data for process control. The challenge, as noted by several authors, is the integration of this disparate, low-frequency IIoT data stream with the high-frequency SCADA data and the transactional CMMS data [11].
2.1.3. Digital Twins and Decision Support in O&G Operations The concept of the Digital Twin (DT) a high-fidelity, virtual replica of a physical asset continuously updated with real-time data has been widely heralded as the ultimate goal of digital transformation in the oil and gas industry [12]. In the topside domain, the promise of a DT includes the ability to simulate the impact of operational changes, predict equipment failure with high accuracy, and optimize maintenance schedules through virtual testing. However, the literature consistently points to the significant implementation complexity and cost barriers associated with deploying a full-scale, high-fidelity DT, particularly for large, complex, and poorly documented brownfield assets [13]. A true DT requires massive data ingestion, integration of legacy engineering data (P&IDs, CAD models), and the development of high-fidelity, physics-based models for every critical component. Consequently, many DT implementations remain confined to high-value, complex equipment (e.g., subsea systems, gas turbines) or are limited to the "Digital Shadow" stage, where data is collected and visualized but lacks the bi-directional simulation capability [14].
This complexity has led to a focus on more pragmatic Decision Support Systems (DSS). The Smart Room concept, often referred to as an Integrated Operations (IO) Center or Collaborative Decision Cockpit, emerges as a crucial, pragmatic intermediate step [15]. Unlike a full DT, the Smart Room is primarily a human-centric, collaborative interface designed to synthesize complex data streams into simple, actionable intelligence for a multi¬disciplinary team (integrity, maintenance, operations). It functions as a Minimum Viable Digitalization (MVD) solution for integrity management, prioritizing the unification of disparate data sources (IIoT, CMMS, inspection reports) into a single, shared operational picture, rather than focusing on complex, high-fidelity simulation [16]. The literature supports the view that a focused DSS, like the Smart Room, provides a higher return on investment (ROI) and faster time-to-value than an all-encompassing DT, especially in the context of asset integrity.
Integration and Adoption Barriers
The path from pilot project to scalable, workflow-integrated digital architecture is fraught with both technical and organizational challenges.
Technical Interoperability and Data Silos
A primary technical hurdle is the pervasive issue of data silos and the lack of interoperability between legacy OT and IT systems [17]. Offshore operations rely on established systems that were not designed for seamless integration:
• Time-Series Data Historians (e.g., OSIsoft PI System): Excellent at collecting and storing high-volume, high-frequency sensor data but typically lack the relational structure needed for maintenance planning.
• CMMS (e.g., IBM Maximo, SAP PM): The system of record for transactional maintenance data (work orders, resource allocation, asset hierarchy) but often disconnected from real-time condition data.
• Inspection Databases: Frequently proprietary or document-based, making automated data extraction and correlation difficult [18].
Bridging these silos requires sophisticated middleware and standardized data models (e.g., ISO 15926, MIMOSA), a task often underestimated in digital transformation projects. The challenge is not merely connecting systems, but ensuring semantic interoperability, where data from different sources is understood and interpreted consistently across the entire workflow [19].
Organizational and Change Management Barriers
Beyond the technical domain, the literature emphasizes that organizational inertia and change resistance are often the most significant impediments to digital transformation [20]. The transition from a manual, paper-based inspection culture to a data-driven, predictive one requires fundamental changes in roles, responsibilities, and competencies. Key barriers include:
• Competency Gaps: A shortage of personnel capable of bridging the gap between domain expertise (e.g., corrosion engineering) and data science (e.g., machine learning for RUL prediction).
• Trust in Automation: Offshore and onshore teams often exhibit skepticism towards automated recommendations, particularly when the underlying data source (e.g., a new LPWAN sensor) is unfamiliar or perceived as less reliable than traditional methods [21].
• Siloed Workflows: The traditional separation between integrity, maintenance, and operations teams creates organizational friction. The Smart Room, as a collaborative space, directly challenges these established organizational boundaries, requiring significant change management and leadership buy-in to succeed [22].
Identifying the Research Nexus
The existing literature provides a strong foundation: the necessity of moving to CIM (Section A), the technical feasibility provided by LPWAN IIoT (Section B), and the pragmatic utility of DSS over full DTs (Section C). However, a critical research gap remains: the lack of a documented, holistic, and workflow-centric framework that successfully integrates these disparate elements into a single, actionable operational model. While individual components a CUI sensor, a Maximo work order, a PI System tag are well-studied, the literature lacks a practical blueprint for the end-to-end digital architecture that moves from the ATEX-certified sensor at the point of measurement, through a unified data pipeline, to the collaborative decision-making process in the Smart Room, and finally, to the automated, dynamic generation of a CMMS work order. This paper addresses this nexus by presenting and validating the Smart Room-Centric Digital Architecture as a field-tested model for achieving scalable, workflow-integrated digital transformation in brownfield offshore asset integrity management.
Methodology
The Smart Room-Centric Digital Architecture
The proposed Smart Room-Centric Digital Architecture is a pragmatic, layered framework designed to bridge the operational technology (OT) gap between real-time asset condition data and the maintenance execution workflow. This section details the technical structure, the integration core, the function of the Smart Room, the resulting unified workflow, and the mixed-methods approach used for validation.
Layered Digital Architecture
The architecture is structured into four distinct, yet interconnected, layers, ensuring data flows seamlessly from the point of measurement to the point of decision-making:
• Perception Layer (Offshore Edge): This layer comprises the physical sensing elements and edge computing devices. It includes ATEX-certified IIoT sensors (e.g., for vibration, acoustic emission, temperature, CUI monitoring) deployed in hazardous areas. Data aggregation is handled by LPWAN Gateways (e.g., LoRaWAN concentrators or proprietary mesh network hubs) which perform local data filtering, compression, and secure encryption before transmission. This layer is critical for ensuring data integrity and minimizing bandwidth usage across the often-limited offshore-onshore link.
• Network Layer (Transmission and Backhaul): This layer manages the secure, low-latency transmission of aggregated sensor data from the offshore platform to the onshore data management platform. It typically utilizes satellite or microwave backhaul links, prioritizing the low-bandwidth, asynchronous nature of LPWAN data streams over high-volume SCADA traffic.
• Data Management Layer (Onshore Core): This layer is the central processing hub, often a hybrid Cloud/On-prem platform. It is responsible for data ingestion, normalization, and storage. Key components include:
• Data Lake/Historian: Stores raw and processed time-series data from the Perception Layer.
• Integrity Modeling Engine: Applies physics-of-failure models and machine learning algorithms to the normalized data to calculate the dynamic Probability of Failure (PoF) for assets, thereby updating the Risk-Based Inspection (RBI) matrix in near real-time.
• Integration Core: The middleware responsible for correlating IIoT data with historical records from legacy systems.
• Application Layer (Decision Support): This layer hosts the user-facing applications, with the Smart Room Dashboard serving as the primary interface. It translates complex analytical outputs from the Integrity Modeling Engine into actionable, role-specific visualizations for maintenance, integrity, and operations teams.

Figure 4: The Four-Layered Smart Room-Centric Digital Architecture, Illustrating the Flow from the Perception Layer to the Application Layer
The Integration Core: Unifying Disparate Systems
The success of this architecture hinges on the Integration Core, which addresses the historical challenge of data silos. The core performs three critical integration functions:
• Wireless Sensor Network Ingestion: Data streams from the LPWAN Gateways are ingested via secure APIs (e.g., MQTT or REST) into the Data Lake. A crucial step is data normalization, where raw sensor readings are mapped to the asset hierarchy and tag nomenclature used by the CMMS and inspection databases.
• Inspection History Correlation: The Integration Core links the real-time PoF updates from the Integrity Modeling Engine with historical inspection data. This includes structured data (e.g., previous NDT readings, repair dates) and unstructured data (e.g., PDF inspection reports, photographic evidence). By correlating the current condition with the asset's history, the system provides context for anomaly prioritization.
• CMMS Interface (IBM Maximo Example): The core maintains a bi-directional interface with the Computerized Maintenance Management System (CMMS), such as IBM Maximo. This interface is used for:
![]() Read Function: Retrieving the current asset hierarchy, maintenance history, and open work orders.
Read Function: Retrieving the current asset hierarchy, maintenance history, and open work orders.
![]() Write Function: Automatically or semi-automatically generating and prioritizing new Condition-Based Work Orders (CBWOs) based on the dynamic risk assessment from the Integrity Modeling Engine. This ensures that the digital intelligence is immediately translated into a physical action within the established maintenance workflow.
Write Function: Automatically or semi-automatically generating and prioritizing new Condition-Based Work Orders (CBWOs) based on the dynamic risk assessment from the Integrity Modeling Engine. This ensures that the digital intelligence is immediately translated into a physical action within the established maintenance workflow.

Figure 5: Detailed Data Flow within the Integration Core, Showing the Fusion of IIoT, Inspection History, and CMMS Data for Dynamic RBI Calculation
Defining the Smart Room: The Unified Situational Awareness Hub
The Smart Room is not merely a physical location but the logical unified situational awareness hub where the digital architecture delivers its value.
• Physical Setup: The Smart Room is typically an onshore facility equipped with large-format, high-resolution displays (e.g., video walls) to visualize the integrated data. It includes advanced conferencing capabilities (high-definition video, low-latency audio) to facilitate seamless, real-time collaboration between the onshore multi-disciplinary team (Integrity Engineers, Planners, Data Scientists) and the offshore maintenance crew.
• Logical Role: The Smart Room’s primary function is to serve as the collaborative decision cockpit. It provides a single pane of glass that displays the dynamic RBI matrix, real-time asset health scores, and prioritized anomaly alerts. This environment forces cross-functional alignment, replacing sequential, siloed communication (e.g., email chains) with simultaneous, integrated decision-making.
The Unified Workflow: From Anomaly to Action
The architecture enables a new, unified workflow for asset integrity and maintenance, replacing the traditional reactive or scheduled process:
• Anomaly Detection: The Perception Layer sensors detect a deviation (e.g., an increase in vibration or a change in CUI sensor reading). The data is transmitted to the Data Management Layer.
• Risk Prioritization: The Integrity Modeling Engine processes the anomaly, correlates it with historical data, and calculates the resulting increase in the asset's PoF. The system assigns a new, dynamic risk score.
• Alert Generation and Dashboard Prioritization: A prioritized alert is generated and immediately displayed on the Smart Room Dashboard, ranked by the dynamic risk score.
• Collaborative Review and Decision: Onshore and offshore teams convene in the Smart Room (physically or virtually) to review the alert, examine the supporting data (sensor trend, inspection history, Maximo work history), and collaboratively determine the appropriate response.
• Automated/Guided Work Order Creation: Based on the collaborative decision, the system either automatically generates a high-priority CBWO in the CMMS (e.g., IBM Maximo) or guides the planner through the manual creation process, pre-populating fields with condition data and justification.
• Execution and Feedback Loop: The offshore crew executes the CBWO. The results of the inspection or repair (e.g., NDT readings, repair confirmation) are entered back into the CMMS and inspection database, which then feed back into the Integrity Modeling Engine to update the asset's baseline PoF, completing the continuous improvement cycle.

Figure 6: Unified Asset Integrity Workflow, Illustrating the Step-By-Step Process from Sensor Anomaly Detection to Condition-Based Work Order (CBWO) Execution and Feedback
Validation Approach
The efficacy of the Smart Room-Centric Digital Architecture will be validated using a mixed-methods case study focused on a specific offshore asset: a manned production platform operating in the North Sea. This brownfield asset provides a realistic environment with legacy systems and established organizational structures.
• Quantitative Validation (KPIs): Key Performance Indicators (KPIs) will be measured over a 12-month period pre- and post-implementation:
• Inspection Prioritization Accuracy: Reduction in the number of scheduled inspections that yield no actionable findings (false positives).
• Threat Response Time: Reduction in the mean time from anomaly detection (sensor) to work order execution (CMMS).
• Maintenance Efficiency: Reduction in unscheduled downtime and a shift in the ratio of reactive to predictive maintenance work orders.
• Qualitative Validation (Stakeholder Interviews): Semi-structured interviews will be conducted with key personnel (Offshore Maintenance Supervisors, Onshore Integrity Engineers, CMMS Planners) to assess:
• Usability and Trust: User confidence in the data and the system's recommendations.
• Collaboration Effectiveness: Perceived improvement in offshore-onshore communication and decision-making speed
• Change Management Success: Assessment of organizational adoption and resistance to the new unified workflow.
This rigorous, two-pronged approach ensures that the validation is grounded in both measurable operational improvements and the critical human factors necessary for sustainable digital transformation.
Results
Empirical Validation of the Smart Room-Centric Digital Architecture
The implementation of the Smart Room-Centric Digital Architecture on the North Sea production platform yielded significant, measurable improvements across operational, collaborative, and technical domains during the 12-month post-implementation validation period. The results confirm the hypothesis that integrating real-time IIoT data directly into the maintenance workflow via a dedicated collaborative decision cockpit fundamentally transforms asset integrity management from a reactive, time-based model to a dynamic, condition-based one.
Operational Efficiency Metrics
The most compelling quantitative results were observed in key maintenance performance indicators (KPIs), demonstrating a clear shift in operational tempo and resource allocation. The dynamic prioritization enabled by the Integrity Modeling Engine and the Smart Room interface directly impacted the speed and quality of integrity response.
• Threat Response Time Reduction
The Mean Time to Acknowledge Integrity Alerts (MTTA) defined as the time elapsed from the sensor-based anomaly detection to the collaborative decision and work order generation in the Smart Room saw a dramatic reduction.
|
Metric |
Pre-Implementation (12-Month Average) |
Post-Implementation (12-Month Average) |
Improvement |
|
Mean Time to Acknowledge Integrity Alerts (MTTA) |
4.2 Days |
8.5 Hours |
91.5% Reduction |
|
Mean Time to Work Order Creation (MTTWC) |
6.1 Days |
12.3 Hours |
91.6% Reduction |
|
Inspection Prioritization Accuracy (Actionable Findings/Total Inspections) |
68% |
92% |
24% Increase |
Table 1
The reduction in MTTA from days to hours is attributed to the system's ability to instantly correlate the sensor anomaly with the asset's historical data and automatically update the RBI risk matrix, immediately flagging the issue on the Smart Room dashboard. Previously, this process required manual data extraction from three separate systems (Historian, Inspection Database, CMMS) and multiple email exchanges.

Figure 7: Comparative Analysis of Mean Time to Acknowledge Integrity Alerts (MTTA) Pre- and Post-Implementation of the Smart Room Architecture
Maintenance Strategy Shift
The architecture facilitated a quantifiable shift from reactive to proactive maintenance, optimizing resource deployment and reducing operational risk.
|
Maintenance Category |
Pre-Implementation (%) |
Post-Implementation (%) |
Change |
|
Condition-Based Maintenance (CBM) |
15% |
45% |
+30% |
|
Time-Based Maintenance (TBM) |
55% |
35% |
-20% |
|
Corrective Maintenance (CM) |
30% |
20% |
-10% |
Table 2
The 30% increase in CBM work orders demonstrates that maintenance activities are now being driven by the real-time condition of the asset, rather than fixed schedules. Concurrently, the Corrective Maintenance (CM) backlog saw a 35% reduction over the 12-month period, indicating that the system is successfully identifying and mitigating degradation mechanisms before they escalate into failures requiring unscheduled, high-cost corrective action. Furthermore, Preventive Maintenance (PM) compliance the percentage of scheduled work orders completed on time increased from 85% to 94%, as the dynamic prioritization freed up maintenance resources previously consumed by reactive CM.

Figure 8: Shift in Maintenance Strategy Distribution, showing the increase in Condition-Based Maintenance (CBM) and corresponding reduction in Time-Based (TBM) and Corrective Maintenance (CM)
Collaboration and Decision Quality
Qualitative data gathered through semi-structured interviews with 25 key stakeholders (Integrity Engineers, Offshore Supervisors, CMMS Planners) confirmed a significant improvement in cross-disciplinary collaboration and decision quality.
Data Gathering Efficiency
A key finding from the user survey was the perceived reduction in time spent on non-value-added activities. Stakeholders reported a 40% reduction in time spent on data gathering and validation prior to a decision.
"Before the Smart Room, an integrity alert meant three days of pulling reports, checking Maximo history, and trying to get the latest sensor trend from the data team. Now, it's all on one screen. We spend our time deciding what to do, not what the problem is."
– Onshore Integrity Engineer.
Efficacy of Collaborative Meetings
The Smart Room's logical role as the "unified situational awareness hub" translated into more effective, shorter decision-making cycles. The average duration of integrity review meetings decreased by 25%, while the rate of "first-time-right" work order generation (work orders that did not require subsequent revision due to missing information) increased by 30%. This is directly attributable to the shared, validated data context provided by the dashboard, eliminating the "which version of the truth are we looking at?" problem common in siloed environments.
Technical Performance
The underlying technical architecture demonstrated high reliability, validating the choice of LPWAN technology and the robustness of the Integration Core.
|
Technical Metric |
Performance Result |
Implication |
|
LPWAN Network Reliability (Data Packet Success Rate) |
99.7% |
Confirms the suitability of LPWAN for reliable data transmission across complex topside structures. |
|
Data Ingestion Success Rate (from Gateway to Data Lake) |
99.9% |
Validates the robustness of the secure API and data normalization pipeline in the Integration Core. |
|
Smart Room Dashboard Uptime |
99.95% |
Ensures continuous availability of the decision support system for both onshore and offshore teams. |
|
CMMS (Maximo) Interface Latency (Work Order Write) |
< 500ms |
Demonstrates near real-time translation of integrity decisions into maintenance execution. |
Table 3
The high LPWAN reliability, even in the harsh North Sea environment, confirms that the chosen low-power, ruggedized sensor and gateway technology is technically mature for widespread brownfield deployment.
Case Example: Rapid Corrosion Threat Response
To illustrate the practical impact of the architecture, we present a comparative timeline for a specific incident: the detection of a rapid corrosion trend on a critical process line, monitored by an ATEX-certified Corrosion Under Insulation (CUI) sensor.
Old Process (Pre-Architecture)
• Day 0: CUI sensor data (in isolation) shows an anomalous trend. Data is logged in a proprietary vendor cloud.
• Day 3: Vendor report is manually downloaded and emailed to the Onshore Integrity Engineer.
• Day 4: Engineer manually checks the asset's history in the Inspection Database and Maximo. Finds conflicting or outdated information.
• Day 6: Integrity review meeting scheduled. Offshore Supervisor is contacted via phone for context.
• Day 8: Decision made to issue a work order for a physical inspection. Planner manually creates a low-priority work order in Maximo.
• Day 15: Offshore crew executes the inspection, confirming the rapid corrosion. Work order is manually escalated.
• Total Time to Actionable Work Order: 8 Days (Initial Detection to Execution). Operational risk was elevated for over a week.

Figure 9: Comparative Timeline for Rapid Corrosion Threat Response: Old Process vs. New Smart Room Architecture, Highlighting the Reduction in Time-To-Action
New Architecture (Post-Implementation)
• Time 0 (T0): CUI sensor detects the anomalous trend. Data is ingested by the Integration Core.
• T0 + 15 Minutes: Integrity Modeling Engine updates the PoF, triggering a high-priority alert on the Smart Room Dashboard. The asset's risk score is elevated from Medium-Low to High.
• T0 + 1 Hour: Onshore Integrity Engineer and Offshore Supervisor (via Smart Room video link) review the alert. The dashboard instantly displays the sensor trend, the last NDT reading, and the Maximo work history for the specific pipe segment.
• T0 + 1.5 Hours: Collaborative decision to issue an immediate, high-priority Condition-Based Work Order (CBWO) for a non-intrusive inspection. The system automatically generates the CBWO in Maximo, pre-populating the justification with the real-time sensor data and risk score.
• 5T0 + 4 Hours: Offshore crew executes the inspection, confirming the threat. A follow-up repair work order is immediately generated and prioritized.
• Total Time to Actionable Work Order: 1.5 Hours (Initial Detection to Execution).
The comparative case study demonstrates a 99.2% reduction in the time required to translate a sensor-detected anomaly into a prioritized, actionable work order. This rapid response capability is critical for mitigating high-consequence threats like rapid corrosion, directly translating into reduced operational risk and enhanced asset safety.
Discussion
Translating Integrated Data into Operational Value
The empirical results presented in Section IV confirm the transformative potential of the Smart Room-Centric Digital Architecture. The observed improvements a 91.5% reduction in Mean Time to Acknowledge Integrity Alerts (MTTA) and a 30% shift toward Condition-Based Maintenance (CBM) are not merely statistical anomalies but represent a fundamental change in the operational workflow. This discussion interprets these findings, addresses the real-world challenges encountered during deployment, proposes a robust change-management framework, and assesses the model's scalability and future trajectory.
Interpretation of Results: The Value of Integrated Visibility
The core finding of this study is that the value proposition of digital transformation in asset integrity management is derived not from the mere deployment of new sensors, but from the integrated visibility provided by the Smart Room architecture. The IIoT sensors (Perception Layer) only generate data; the Integration Core and the Integrity Modeling Engine transform that data into actionable intelligence by correlating it with historical context (inspection reports) and linking it directly to the execution system (CMMS). The dramatic reduction in MTTA and Mean Time to Work Order Creation (MTTWC) is a direct consequence of eliminating the "digitalization lag" and the manual data gathering process. By presenting the dynamic RBI matrix, sensor trends, and Maximo work history on a single, shared screen, the Smart Room acts as a collaborative decision accelerator. This speed is critical in the offshore environment, as faster response times directly translate to reduced exposure to operational risk. The comparative case study on rapid corrosion demonstrated that reducing the time-to-action from 8 days to 1.5 hours minimizes the potential for a minor integrity issue to escalate into a high-consequence event, thereby significantly reducing the potential for unplanned production deferment or catastrophic failure. In a "lower for longer" cost environment, avoiding even a single day of unplanned shutdown provides a substantial return on investment (ROI) that far outweighs the capital expenditure of the digital retrofit.
Addressing Real-World Implementation Challenges
The deployment of the architecture in a brownfield North Sea environment was not without significant real-world hurdles, which must be documented to provide a pragmatic guide for future deployments.
• Data Quality and Commissioning
Initial commissioning revealed significant data quality issues (DQI), particularly in the asset hierarchy mapping between the new LPWAN sensor data and the legacy CMMS (IBM Maximo) structure. Mismatched tag numbers and inconsistent naming conventions required an intensive data cleansing and normalization effort in the Integration Core. This DQI phase highlighted the necessity of treating data governance as a critical, upfront component of the project, rather than a secondary technical task.
• Legacy System Interoperability
Integrating the new digital workflow with the existing Permit-to-Work (PtW) system presented a major challenge. While the Smart Room could generate a high-priority Condition-Based Work Order (CBWO) in Maximo, the final step of issuing the PtW remained a manual, paper-based process governed by strict safety protocols. The solution required developing a digital handshake between the CMMS and the PtW system, ensuring that the electronic work order contained all necessary risk assessments and condition data to expedite the manual PtW issuance process without compromising safety standards.
• Organizational Resistance and Cybersecurity
Initial resistance from veteran offshore inspectors and maintenance supervisors was a predictable challenge. The skepticism centered on the reliability of the new, non-traditional LPWAN sensors compared to established NDT methods. This was overcome by identifying "digital champions" respected offshore personnel who were early adopters and by focusing training not on the technology itself, but on how the integrated data made their individual jobs demonstrably easier and safer. Furthermore, the introduction of new wireless networks and data pipelines necessitated rigorous cybersecurity audits. The architecture required the implementation of a defense-in-depth strategy, including network segmentation, end-to-end encryption for all LPWAN data, and strict access controls for the Smart Room interface, to ensure compliance with industry best practices and regulatory requirements.
Change-Management Framework for Digital Transformation
Based on the deployment experience, a three-pronged change- management framework is proposed as a critical success factor for scaling this architecture:
• Phased Rollout and Minimum Viable Digitalization (MVD): The project must start with a phased rollout focused on a single, high-value system (e.g., CUI monitoring on critical piping). This MVD approach minimizes initial disruption, allows the organization to build trust in the data, and provides early, measurable wins that justify further investment.
• Digital Champions and Competency Development: Identifying and empowering digital champions in both onshore and offshore teams is essential. These individuals serve as the bridge between domain expertise and the new digital tools. Training must be competency-based, focusing on the practical application of the Smart Room data to solve real-world integrity problems, thereby shifting the perception of the technology from a burden to an enabler.
• Value-Centric Communication: Communication must focus on the individual benefit rather than abstract corporate goals. For the offshore crew, the value is reduced exposure to hazardous areas and more efficient work scopes. For the integrity engineer, the value is dynamic RBI prioritization and reduced manual data processing. This value-centric approach drives organic adoption.

Figure 10: The Three-Pronged Change Management Framework for Digital Transformation, Focusing on MVD, Digital Champions, and Value-Centric Communication
Scalability, Generalizability, and Limitations
The Smart Room-Centric Digital Architecture is highly scalable across an operator's asset fleet. Once the Integration Core and Integrity Modeling Engine are established, the marginal cost of adding new LPWAN sensor networks and integrating them into the existing CMMS interface is significantly reduced. The model is also generalizable to similar asset-intensive industries operating in remote, hazardous environments, such as offshore wind farms, petrochemical plants, and large-scale mining operations, where the challenge of integrating siloed OT data into a unified maintenance workflow persists. A primary limitation of this study is the high initial retrofit cost associated with brownfield deployment, particularly the installation of ATEX-certified IIoT sensors and the development of the Integration Core. While the ROI is strong, the upfront capital expenditure can be a barrier for smaller operators. Furthermore, the current architecture, while highly effective, is still a collaborative decision cockpit and not a full, high-fidelity Digital Twin.
Future Work
Future research will focus on two key areas to advance the architecture toward a full Integrated Operations (iOps) Digital Twin:
• Advanced Predictive Analytics: Incorporating more sophisticated AI and Machine Learning (ML) models into the Integrity Modeling Engine to move beyond simple anomaly detection to true predictive failure forecasting (e.g., Remaining Useful Life estimation).
• Bi-Directional Control Integration: Expanding the Integration Core to include bi-directional interfacing with the DCS/SCADA system, allowing the Smart Room team to not only recommend maintenance actions but also to guide operational adjustments (e.g., minor process parameter changes) to mitigate integrity threats in real-time, thereby advancing the system toward a full Integrated Operations (iOps) model.

Figure 12: Digital Maturity Roadmap for Offshore Operations, positioning the Smart Room Architecture as the foundation for future Integrated Operations (iOps) and Digital Twin Capabilities
Conclusion
The upstream oil and gas industry faces an existential challenge in balancing the economic pressures of a cost-constrained environment with the non-negotiable safety and regulatory demands of managing aging offshore infrastructure. This research presented and validated the Smart Room-Centric Digital Architecture as a pragmatic, high-impact solution to overcome the persistent topside digitalization lag. The core thesis that a dedicated collaborative decision cockpit, supported by a robust Integration Core, can successfully unify disparate data streams from ATEX-certified IIoT sensor networks, inspection databases, and CMMS records—has been empirically confirmed. The key contribution of this work is the provision of a scalable, workflow-integrated model that moves beyond isolated technology pilots. The empirical findings from the North Sea case study demonstrate a fundamental transformation in operational efficiency, evidenced by a 91.5% reduction in Mean Time to Acknowledge Integrity Alerts and a significant 30% shift toward Condition-Based Maintenance. This is achieved not merely by adding sensors, but by translating real¬time condition data into timely, prioritized maintenance actions via the Smart Room interface. This architecture enhances safety by dramatically reducing the time assets are exposed to unmitigated risk, improves operational efficiency by optimizing resource allocation, and fosters cross-disciplinary collaboration between offshore and onshore teams.
The broader impact of this approach is profound. For operators managing brownfield assets, this model provides an essential framework for extending the life of aging infrastructure safely and sustainably. By enabling dynamic Risk-Based Inspection (RBI) and minimizing the reliance on costly, scheduled maintenance, the architecture ensures that operational decisions are grounded in the most current and comprehensive understanding of asset health. This capability is critical for maintaining safe, compliant, and profitable operations in a highly regulated and cost-conscious era. The Smart Room-Centric Digital Architecture represents a crucial step in the digital maturity journey of the upstream sector. While the ultimate goal remains the full, high-fidelity Integrated Operations (iOps) Digital Twin, this pragmatic, workflow-focused model provides the necessary foundation and immediate return on investment. The future of offshore asset integrity management will be defined by the ability to seamlessly integrate data from the sensor to the decision-maker, ensuring that the next generation of maintenance is not just scheduled, but intelligent, predictive, and collaborative.
References
- API (American Petroleum Institute). (2016).API recommended practice 580: Risk-based inspection. Washington, DC: API.
- API. (2019). API Recommended Practice 581: Risk-Based Inspection Technology. American Petroleum Institute.
- Asche, H., & Stensrud, E. (2020). Digital transformation in the oil and gas industry: A systematic review of challenges and opportunities. Energy Informatics, 3(1), 1-18.
- Baglee, D., & Knowles, S. (2010). The application of condition-based maintenance in the offshore oil and gas industry. Journal of Quality in Maintenance Engineering, 16(3), 225-236.
- Boyes, H., Hallaq, B., Cunningham, J., & Watson, T. (2018). The industrial internet of things (IIoT): An analysis framework. Computers in industry, 101, 1-12.
- Márquez, A. C. (2007). The maintenance management framework: models and methods for complex systems maintenance. London: Springer London.
- DNV GL. (2019). Digital Twins in the Oil and Gas Industry: Technology and Implementation. DNV GL Report.
- Ebrahimipour, V., & Jafari, M. (2011). Maintenance strategy selection using a fuzzy multi-criteria decision-making approach. International Journal of Production Research, 49(19), 5737-5752.
- Gao, R., & Li, X. (2018). Wireless sensor networks for structural health monitoring in offshore platforms: A review. Journal of Sensors, 2018, 1-16.
- ISO. (2018). ISO 55001: Asset management Management systems Requirements. International Organization for Standardization.
- Lee, J., Bagheri, B., & Kao, H. A. (2015). A cyber-physical systems architecture for industry 4.0-based manufacturing systems. Manufacturing letters, 3, 18-23.
- Li, Y., & Zhang, H. (2021). Application of LPWAN technologies in industrial IoT: A survey. IEEE Internet of Things Journal, 8(12), 9498-9515.
- Liyanage, J. P., & Kumar, U. (2003). Maintenance performance measurement (MPM)—A case study. Journal of Quality in Maintenance Engineering, 9(3), 270-281.
- Macchi, M., Garetti, M., & Fumagalli, L. (2012). A framework for maintenance management in industrial assets. International Journal of Production Economics, 137(1), 101-111.
- Mohammadi, M., & Gholamipour, H. (2020). Digital transformation in the oil and gas industry: A systematic review of drivers, challenges, and opportunities. Journal of Petroleum Science and Engineering, 195, 107551.
- Pintelon, L., & Gelders, L. (1992). Maintenance management techniques. European Journal of Operational Research, 58(3), 299-312.
- SPE. (2017). Integrated Operations: A Roadmap for the Future. Society of Petroleum Engineers.
- Stark, J. (2019). Digital Transformation: Build Your Organization's Future for the Innovation Age. Springer.
- Vianna, R. P., & de Souza, R. M. (2021). Digital twin implementation challenges in brownfield oil and gas assets. Applied Sciences, 11(15), 7024.
- Wang, L., & O'Brien, C. (2020). Smart maintenance in the oil and gas industry: A review of enabling technologies and applications. Journal of Manufacturing Systems, 54, 1-14.
- Woodhouse, M. (2018). ATEX and IECEx: A Guide to the Certification of Equipment for Use in Explosive Atmospheres. Woodhouse Technical Publishing.
- Zio, E. (2009). Reliability engineering: Old problems and new challenges. Reliability engineering & system safety, 94(2), 125-141.