


Research Article - (2025) Volume 4, Issue 2
A New Zerbet’s Statistic for Detecting Outliers in Exponential Distribution
Received Date: May 30, 2025 / Accepted Date: Jun 02, 2025 / Published Date: Jun 09, 2025
Copyright: ©Â©2025 Aicha Zerbet. This is an open-access article distributed under the terms of the Creative Commons Attribution License, which permits unrestricted use, distribution, and reproduction in any medium, provided the original author and source are credited.
Citation: Zerbet, A. (2025). A New Zerbet
Abstract
The problem of multiple upper outlier detection in a sample from an exponential distribution is considered in this paper. A new test statistic for an exponential sample is thus proposed. Distribution of the test based on this new statistic under slippage alternative also under the null hypothesis is obtained. The critical values of the new statistic for various n (size of the sample) are tabulated. An extensive Monte Carlo simulation study is conducted for comparing the performance of the new test with other available tests. The proposed test has the highest outlier identification power.
Keywords
Critical Values, Outliers, Slippage Alternative
Introduction
The problem of detecting outliers is universal. In the presence of good theoretical tools, an analysis based on erroneous data often leads to false conclusions, hence the importance of developing statistical tests to detect anomalies and ensure the quality of the data is warranted. A so-called outlier value does not imply that this value is necessarily not useful and interesting, but it presents the extreme case of a particularly important phenomenon. This explains why we do not seek to remove outliers but to minimize their undesirable effects when using them. The objective of this paper is to focus on alternative models, namely slippage alternatives in exponential distribution [1]. This distribution has several applications in various fields, such as queueing systems, reliability engineering, survival analysis, etc. It is specifically used to model processes or events that occur with a constant rate (or intensity) λ. The rate λ determines the average number of events or occurrences per unit of time. An exponential random variable can be regarded as the time between consecutive events in a Poisson process with a constant rate λ. For this distribution, a number of discordancy tests for multiple upper outliers have been proposed by various authors; for example, see [2-7].
The Proposed New Test Statistic
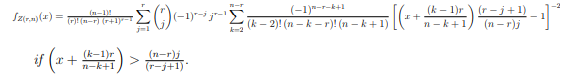
In this paper, to test H0 against Hr, we propose the new following statistic:
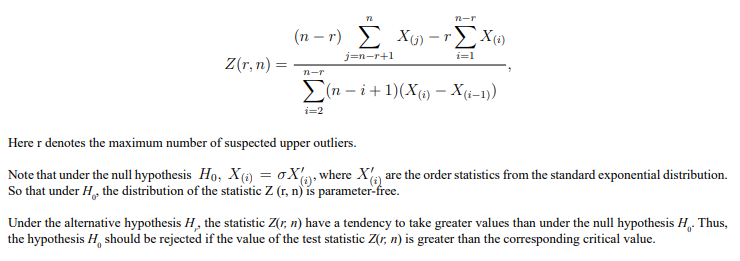
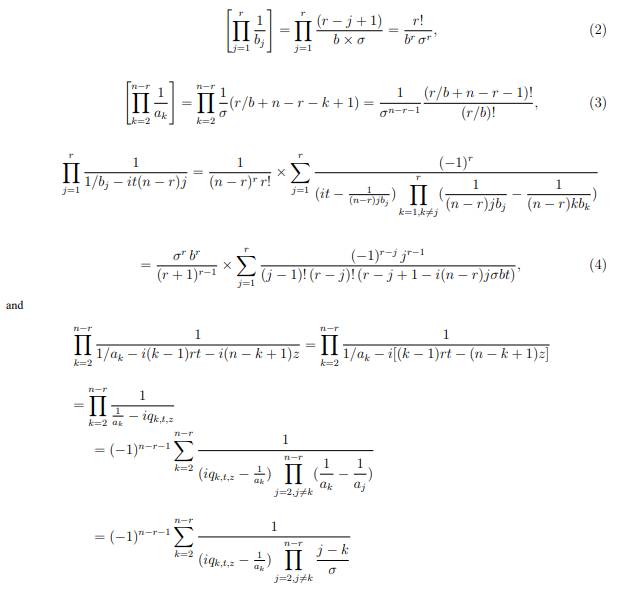
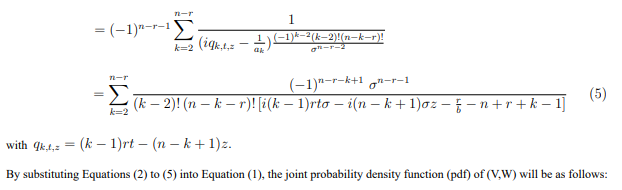
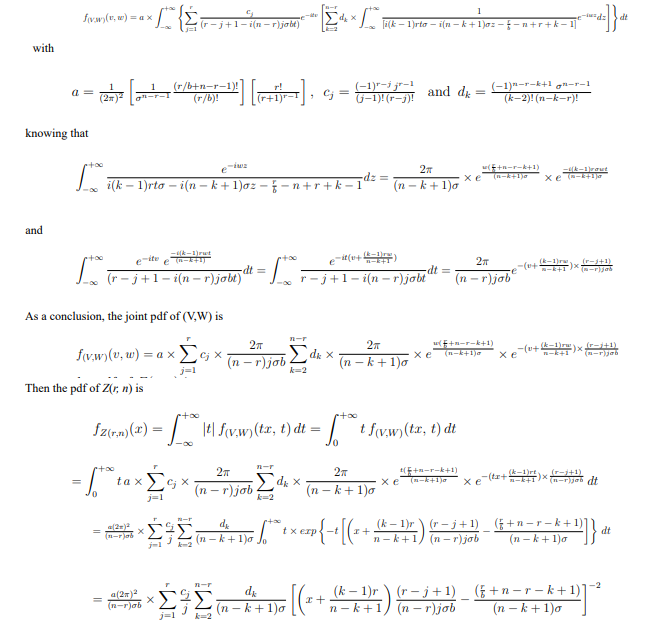
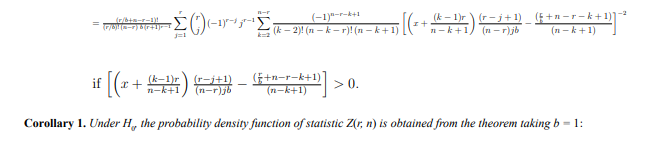
The Probability Density Function of The New Statistic
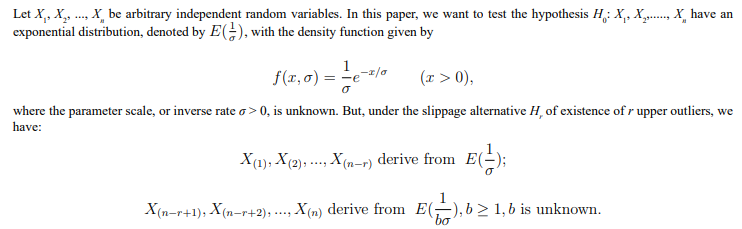
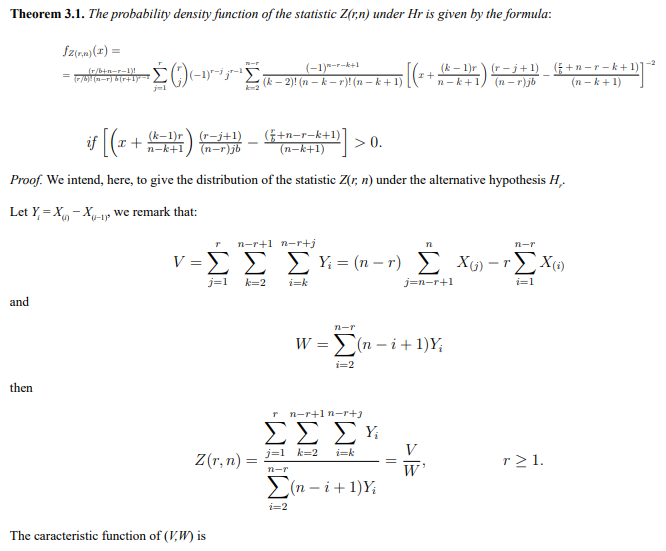
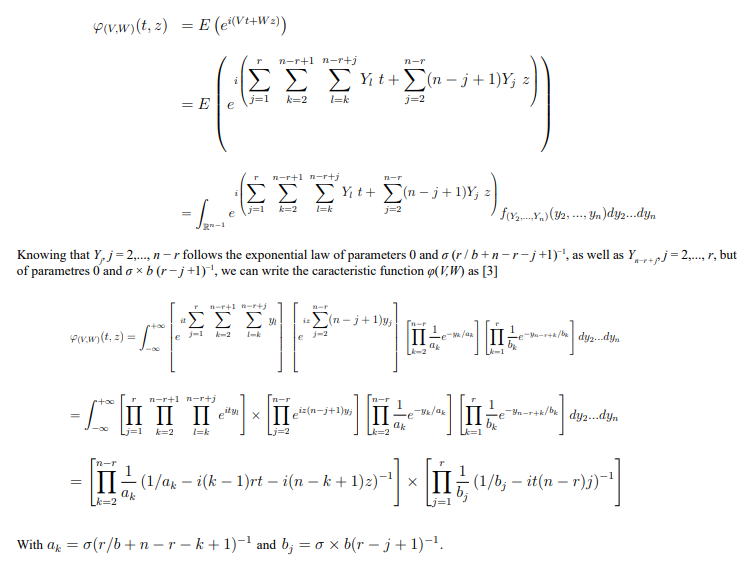
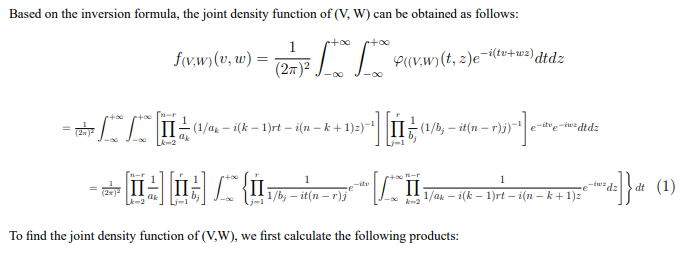
The main objective in this section is to obtain the probability density function of the statistic Z(r, n), with r ≥ 1 in the explicit form, under the slippage alternative Hr and also under null hypothesis.
Critical values
The main objective in this section is to give the critical values of the six tests ZN, D1, D2, BG, MLR and Z computed by simulation using the Monte Carlo method (100 000 replications) at the 0.2,0.15,0.1,0.05,0.02 and 0.01 levels of significance, for r = 2, n = 20, 40,...,100, the results are summarized in the tables 1, 2, ..., 6 below.
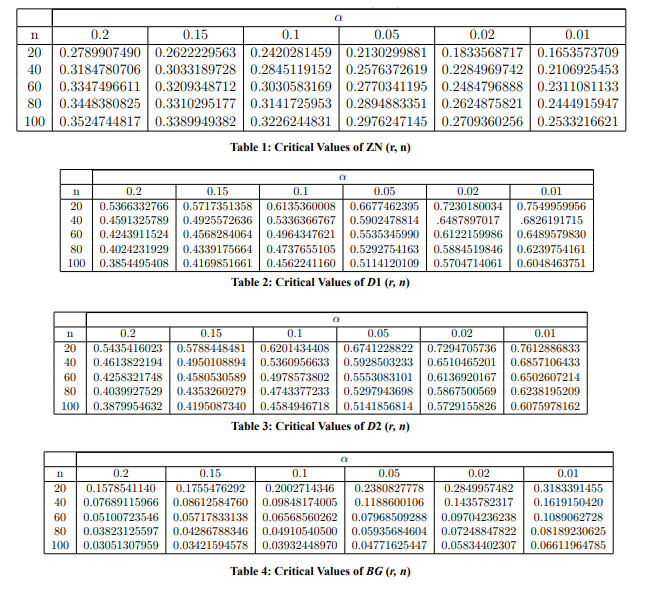

According to the above tables, we can see the critical values of 1, D2, BG and MLR decrease when n is increased. But the critical values of ZN and Z increase when n is increased.
Simulations Experiments
Under the null hypothesis, the distribution of any of the considered test statistic is parameterfree; hence, investigating by simulation the power of the tests, the value σ = 1 could be taken when simulating the data under the null hypothesis, and different values of b could be considered for fixed σ = 1 when simulating the data under the alternative hypothesis Hr.
Assume that r = 2. For performance comparison of the six tests ZN, D1, D2, BG, MLR and Z, we generated N = 100 000 samples of size n = 20 from the alternative distributions considered Hr. We computed then the power of the six tests by simulation for various values of b. The results are presented in Table 7. A good test should have a high power.
|
b |
Tests |
|||||
|
Dixon-1 |
Dixon-2 |
MLR |
Balasooriya and Gadag |
Zerbet |
Zerbet and Nikulin |
|
|
1 |
0.05 |
0.05 |
0.05 |
0.05 |
0.049930 |
0.04999 |
|
2 |
0.047630 |
0.047850 |
0.046610 |
0.048210 |
0.53175 |
0.04763 |
|
3 |
0.067850 |
0.066860 |
0.081710 |
0.074020 |
0.91151 |
0.06744 |
|
4 |
0.10840 |
0.10715 |
0.16043 |
0.13382 |
0.99333 |
0.11401 |
|
5 |
0.17326 |
0.17080 |
0.28963 |
0.23375 |
0.99974 |
0.19275 |
|
6 |
0.25113 |
0.24710 |
0.44261 |
0.35786 |
1 |
0.29262 |
|
7 |
0.34747 |
0.34244 |
0.60295 |
0.49830 |
1 |
0.40951 |
|
8 |
0.44985 |
0.44316 |
0.74042 |
0.63089 |
1 |
0.52783 |
|
9 |
0.54799 |
0.54098 |
0.84488 |
0.74355 |
1 |
0.63606 |
|
10 |
0.63762 |
0.62976 |
0.91360 |
0.82904 |
1 |
0.72731 |
|
11 |
0.71496 |
0.70743 |
0.95502 |
0.89045 |
1 |
0.80013 |
|
12 |
0.77548 |
0.76852 |
0.97793 |
0.93044 |
1 |
0.85267 |
|
13 |
0.82803 |
0.82154 |
0.98976 |
0.95824 |
1 |
0.8961 |
|
14 |
0.86969 |
0.86414 |
0.99572 |
0.97537 |
1 |
0.92705 |
|
b |
Tests |
|||||
|
Dixon-1 |
Dixon-2 |
MLR |
Balasooriya and Gadag |
Zerbet |
Zerbet and Nikulin |
|
|
15 |
0.90414 |
0.89976 |
0.99845 |
0.98572 |
1 |
0.94954 |
|
16 |
0.92758 |
0.92364 |
0.99931 |
0.99157 |
1 |
0.96484 |
|
17 |
0.94658 |
0.94318 |
0.99973 |
0.99534 |
1 |
0.97567 |
|
18 |
0.96032 |
0.95769 |
0.99986 |
0.99715 |
1 |
0.98318 |
|
19 |
0.97078 |
0.96858 |
0.99997 |
0.99836 |
1 |
0.98843 |
|
20 |
0.97856 |
0.97673 |
1 |
0.99911 |
1 |
0.99209 |
|
21 |
0.98442 |
0.98297 |
1 |
0.99945 |
1 |
0.99459 |
|
22 |
0.98842 |
0.98741 |
1 |
0.99970 |
1 |
0.99609 |
|
23 |
0.99141 |
0.99054 |
1 |
0.99988 |
1 |
0.99735 |
|
24 |
0.99416 |
0.99365 |
1 |
0.99990 |
1 |
0.9984 |
|
25 |
0.99591 |
0.99545 |
1 |
0.99995 |
1 |
0.99884 |
|
26 |
0.99654 |
0.99615 |
1 |
0.99997 |
1 |
0.99908 |
|
27 |
0.99778 |
0.99748 |
1 |
0.99999 |
1 |
0.99951 |
|
28 |
0.99840 |
0.99815 |
1 |
0.99999 |
1 |
0.99968 |
|
29 |
0.99891 |
0.99874 |
1 |
0.99999 |
1 |
0.99976 |
|
30 |
0.99902 |
0.99886 |
1 |
1 |
1 |
0.99986 |
|
31 |
0.99940 |
0.99929 |
1 |
1 |
1 |
0.99986 |
|
32 |
0.99956 |
0.99948 |
1 |
1 |
1 |
0.99993 |
|
33 |
0.99959 |
0.99949 |
1 |
1 |
1 |
0.99991 |
|
34 |
0.99966 |
0.99962 |
1 |
1 |
1 |
0.99995 |
|
35 |
0.99978 |
0.99973 |
1 |
1 |
1 |
0.99998 |
|
36 |
0.99983 |
0.99978 |
1 |
1 |
1 |
0.99999 |
|
37 |
0.99988 |
0.99986 |
1 |
1 |
1 |
0.99999 |
|
38 |
0.99992 |
0.99989 |
1 |
1 |
1 |
1 |
|
39 |
0.99995 |
0.99992 |
1 |
1 |
1 |
1 |
|
40 |
0.99997 |
0.99997 |
1 |
1 |
1 |
1 |
|
41 |
0.99997 |
0.99997 |
1 |
1 |
1 |
1 |
|
42 |
0.99998 |
0.99997 |
1 |
1 |
1 |
1 |
|
43 |
1 |
1 |
1 |
1 |
1 |
1 |
Table 7: Empirical Power for n=20, r=2 and α = 0.05
From Table 7, we observed that:
The powers of the six tests ZN, D1, D2, BG, MLR and Z increase to 1 when b increases;
The D1 and D2 tests are equivalent; For b ≥ 3, the ZN test has more power than the D1 and D2 tests;
The test based on the BG test is more powerful than the D1, D2 and ZN tests;
The power of MLR test increases to 1 rapidly than the D1, D2, ZN and BG tests;
The power of the new Z test increases to 1 very rapidly than the other tests D1, D2, BG, MLR and ZN. The curves of the empirical power of different test statistics at n = 20, r = 2 and α = 0.05 are depicted in the following figure:

Figure 1: Empirical Power of Tests
Conclusion
The power analysis shows that, for exponential distribution, the Dixon1, Dixon2, Zerbet and Nikulin, and Balasooriya and Gadag tests have considerably smaller power than the new Zerbet and Maximum Likelihood Ratio tests. The power of the new Zerbet test increases to 1 very rapidly than the Maximum Likelihood Ratio test. We conclude that, for exponential distribution, the new Zerbet test has a higher probability of identifying the contaminant observations as outliers than the Dixon1, Dixon2, Zerbet and Nikulin, Balasooriya and Gadag, and Maximum Likelihood Ratio tests for all values of b > 1 [2-8].
Acknowledgement
I would like to express my sincere gratitude the anonymous referees, an Associate Editors and the Editors for their constructive comments that improved the quality of this paper.
Acknowledgement
I would like to express my sincere gratitude the anonymous referees, an Associate Editors and the Editors for their constructive comments that improved the quality of this paper.
References
- Barnett, V. and Lewis, T. (1978). Outlier in statistical data. John Wiley and Sons, Inc: New York.
- Likes, J. (1967). Distribution of Dixon’s statistics in the case of an exponential population. Metrika, 11(1), 46-54.
- Chikkagoudar, M. S., & Kunchur, S. H. (1983). Distributions of test statistics for multiple outliers in exponential samples.Communications in Statistics-theory and Methods, 12(18), 2127-2142.
- Likes, J. (1987). Some Tests for k£ 2 Upper Outliers in an Exponential Sample. Biometrical Journal, 29(3), 313-321.
- Balasooriya, U., & Gadag, V. (1994). Tests for upper outliers in the two-parameter exponential distribution. Journal of statistical computation and simulation, 50(3-4), 249-259.
- Zhang, J. (1998). Tests for multiple upper or lower outliers in an exponential sample. Journal of Applied Statistics, 25(2), 245-255.
- Zerbet, A., & Nikulin, M. (2003). A new statistic for detecting outliers in exponential case. Communications in Statistics-theory and Methods, 32(3), 573-583.
- Lin, C. T., & Balakrishnan, N. (2014). Tests for multiple outliers in an exponential sample. Communications in Statistics-Simulation and Computation, 43(4), 706-722.
- BagdonaviÄius, V., Nikulin, M. S., & Zerbet, A. (2015). On outliers detection for location-scale and shape-scale families. Notes ofscientific seminars of POMI, 442(0), 5-17.
- Bagdonavicius, V., Nikulin, M. and Zerbet, A. (2017). On Outliers Detection for Location-Scale and Shape-Scale Families. Journal of Mathematical Sciences, 225, 723-732.
- Pyke, R. (1965). Spacings. Journal of Royal Statistical Society, 3, pp. 395-449.
- Sweeting, T. J. (1986). Asymptotically independent scale-free spacings with applications to discordancy testing. The Annals of Statistics, 1485-1496.