
Journal of Investment, Banking and Finance(JIBF)
ISSN: 2997-2256 | DOI: 10.33140/JIBF
Impact Factor: 0.92


Review Article - (2025) Volume 3, Issue 2
A Comprehensive Study of Statistical Mechanics in Financial Thermodynamic Systems
Received Date: May 11, 2025 / Accepted Date: Jun 05, 2025 / Published Date: Jun 13, 2025
Copyright: ©2025 Prokarsha Kumar Ghosh. This is an open-access article distributed under the terms of the Creative Commons Attribution License, which permits unrestricted use, distribution, and reproduction in any medium, provided the original author and source are credited.
Citation: Ghosh, P. K. (2025). A Comprehensive Study of Statistical Mechanics in Financial Thermodynamic Systems. J Invest Bank Finance, 3(2), 01-08.
Abstract
The stock market has been viewed as a dynamical system composed of complex interactions among top 100 firms of different stock indices as a time evolving network. This network has been constructed by stock price movements through regression analysis, capturing the changing structure of the market over time. A novel quantum statistical approach has been applied, where the network is treated as a system of energy states occupied by indistinguishable particles as bosons governed by Bose-Einstein statistics. In this paper partition functions have been used to define a thermodynamic entropy, which has been applied to identify structural changes during major financial events. Significant variations in entropy have been interpreted as indicators of systemic transitions in the market. The fitted temperature like parameter has been found to correlate with levels of economic development. Furthermore, financial systems have been conceptualized as condensates similar to Bose-Einstein condensates, and resulting statistical distributions have matched empirical patterns. Investment distributions have aligned with Pareto laws, and price movement distributions have resembled exponentially truncated distributions. These analogies and the integration of network modelling with quantum statistics, a thermodynamic framework has been established to capture complex market behaviours and systemic movements.
Keywords
Statistical Methods, Pareto Distribution, Machine Learning, Deep Learning, Deep Neural Network, Bose Einstein Statistics
Introduction
In the contemporary financial landscape, the global economy is characterised as an intricate and interconnected system encompassing economic activities and policies across various countries. It has been shaped by a wide array of factors including international trade, financial markets, investment flows, and multinational regulations. Continuous exchanges of resources, goods, and services have been observed on a global scale, thereby creating significant interdependencies among national economies. The dynamics of financial activity levels have been seen to be influenced by global events such as political transitions, technological innovations, conflicts, and many other economic developments. As a result, the health of the global economy has been monitored consistently by governments, investors, and international organizations.
To gauge economic stability and performance, top 100 firms in global stock indices such as the S&P BSE 100, FTSE 100, NASDAQ 100, S&P TSX Composite, S&P ASX 100, and Euronext NV 100 have been widely utilised. These indices have served as essential benchmarks to interpret market trends, investor sentiment, and regional economic outlooks. Through their movement, insights into the performance of countries and broader economic segments have been extracted, facilitating informed investment decisions, strategic policymaking, and financial planning. Thus, the critical role of the global economy has been highlighted through the data and signals offered by these indices. Statistical modelling techniques have been applied extensively to identify patterns and trends in the stock market, enhancing the ability to assess risk, predict outcomes, and optimize financial strategies. Among these methods, regression analysis has been implemented to determine the linear relationships between the various global indices. By minimizing the sum of squared residuals, estimates for regression coefficients have been obtained, quantifying the impact of each independent variable on the dependent index. To address multiple objectives such as error minimization and risk control, Pareto optimization has been incorporated.
Furthermore, in an innovative analytical approach, Bose-Einstein statistics have been adopted to describe collective behaviours in stock markets. The market states have been modelled as energy levels, while trading events have been interpreted as indistinguishable particles bosons that may occupy the same state without restriction. This framework has allowed for the examination of clustering phenomena and anomalous market behaviour that are typically not captured by classical statistical models. The Bose-Einstein distribution, through its allowance for condensation effects, has provided a novel perspective on the concentration of trades and market trends, contributing to a deeper understanding of the non-linear dynamics prevalent in financial systems. Through the integration of conventional regression analysis and quantum statistical principles, a comprehensive and multifaceted exploration of stock market interdependencies and behaviours has been conducted in this project.
Literature Review
According to Perez et al., 2010, the size distribution of business firms using an analogy with Bose–Einstein statistics, annual revenues associated by selected firms with energy levels [1]. The cumulative distribution functions of firm rankings across various countries are well-fitted by BE statistics, with the temperature- like parameter correlating positively with economic development as measured by the Human Development Index. In developing economies, top performing firms tend to cluster at low revenue levels, resembling BE condensation at low temperatures. Distribution functions suggest the potential of extending this analogy to developed nations and to other distributions like income and wealth, thereby reinforcing the proposed link between economic "temperature" and development. According to Staliunas et al., 2003, financial markets as partially coherent bosonic systems, using ideas from Bose Einstein condensation [2]. It assumes that participants tend to follow the majority and seek profit. The first behaviour leads to a Bose–Einstein distribution, while the second introduces exponentially truncated Pareto distributions. These better match empirical data, especially for price changes and wealth distributions. Exponent models are consistent with observed values in financial markets and align with results from kinetic finance models.
According to Kurten 2012, the financial crisis can be avoided if the measures to stop the BEC or to remove the Bose-Condensed fraction will be taken. Therefore, it explains that the financial movements as per time when the majority of population are excluded from trading for the money exchange process. It measures what to do to avoid financial downfall. by making active all existing economic agents. According to Lapinski 2013, statistical mechanics methods and precise estimates the entropy approximation, partition functions, and a custom Laplace-type integral approach [3]. The work separates two cases of resulting distributions, expanding theorem suggested by V.P. Maslov. Distribution functions derived to economic systems, suggesting that different statistical forms may correspond to the economic states of countries by BE statistics. This supports the idea of a shared underlying structure across economies.
According to Kusmartev, 2011, Statistical mechanics is applied to economics by modeling market snapshots as ensembles to derive probability distributions [4]. Distributions of capital, income, and debt are found to follow the Bose–Einstein form, revealing key market relationships. Stock market has been is analysed to observe the financial crises between 1996 to 2008, has been indicated by peaks in activity coefficients and future ones predicted. According to Xu, 2015, a modified kinetic exchange model can be presented by drawing a parallel between economic crises and Bose–Einstein condensation [5]. There will be time dependent parameter ð?¿ representing technological advancement, whose growth widens inequality and induces crises despite rising living standards. ð?¿– ð??ð??– ð¸ð??ð?¡ð??ð??ð?ð?¦ results in dilemma reflects the second law of thermodynamics, suggesting crises arise in isolated economies, while open economies avoid this fate raising concerns about a globally isolated economy under full globalisation.
Methodology
In the modern era, global economy is defined as the interconnected system of economic activities and policies that span across various countries. It is shaped by international trade, financial markets, investment flows, and other factors. Resources, goods, and services are exchanged globally, and national economies are influenced by each other through trade agreements, multinational corporations, and cross-border regulations. Trends such as inflation, interest rates, and employment levels are affected by global events, such as political shifts, technological advancements, wartime situations, conflictions and many more activities. It effects the health of the global economy which is monitored by governments, investors, and organizations worldwide. Global stock indices, such as the S&P BSE 100, FTSE 100, NASDAQ 100, S&P TSX Composite, S&P ASX 100, Euronext NV 100 and many other stocks are used to represent the performance of specific segments of the global stock market. Thess stocks are used as benchmarks to assess market trends, investor sentiment, and economic stability. Through these indices, the economic performance of countries and regions can be observed and analysed. Investment decisions, policy responses, and financial planning are influenced by movements in these indices. Therefore, the importance of global economy lies in the insights they provide into the global economic climate and in the role, they play in guiding capital allocation across the world.
Statistical Modelling
Statistical techniques help identify trends and patterns in stock market behaviour, to make better investment decisions. They allow for risk assessment and performance evaluation of financial assets. By analysing market data, investors can make predictions and optimize strategies. Ordinary Least Squares is a important statistical method used to evaluate the relationship between a dependent variable (S&P BSE 100) and independent variables (FTSE 100, NASDAQ 100, S&P ASX 100, S&P TSX 100, and
Euronext NV 100). It works by minimizing the sum of squared differences between actual and predicted values. By using Pareto optimization with OLS helps when there are multiple objectives which is minimizing error and controlling risk or variance across markets.

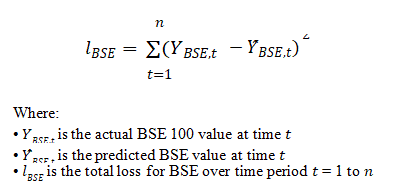
The loss function measures how far off predictions are from actual values. In your case, it quantifies the error between S&P BSE 100 and the predicted values from global indices. It guides the model during training, helping adjust weights to improve accuracy.
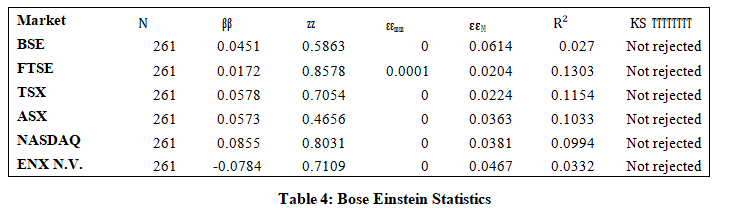
Bose Einstein Statistics
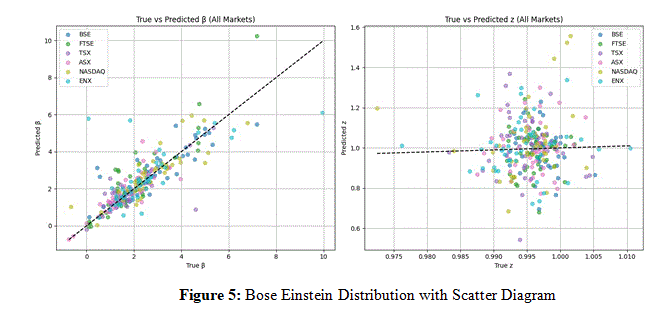
The behaviour of stock market indices can be considered as particles whose collective behaviour is governed by certain probabilistic rules. In this approach, market states are viewed as energy levels, while stocks or trading events are treated as bosons that can occupy these states with no restriction on the number of occupants per state. This is in contrast to classical statistics, where such occupancy restrictions are generally assumed. The Bose- Einstein distribution allows for the emergence of condensation effects, which have been interpreted as the clustering of trades or price movements in specific market conditions. This phenomenon explains the high concentration of trades around particular price points or the formation of strong trends. Such clustering is difficult to model using conventional Gaussian or Poisson statistics but is naturally captured through Bose-Einstein formalism.
Bose-Einstein statistics has been utilized to enhance the understanding of collective behaviour and complex dynamics in stock markets. This approach provides a novel theoretical framework to explain anomalies and non-linear phenomena frequently observed in financial indices. The Bose-Einstein distribution describes the statistical distribution of indistinguishable bosons over energy states in thermal equilibrium
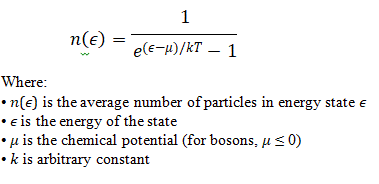
The Bose-Einstein distribution has a minus one in its denominator, unlike the Fermi-Dirac distribution, which has a plus one. This difference exists because bosons, unlike fermions, do not follow the Pauli exclusion principle and can share the same energy state. At low temperatures, bosons tend to gather in the lowest energy state, causing Bose-Einstein condensation. This phenomenon leads to unique quantum effects, as many particles occupy a single state simultaneously, which is not possible for fermions.
Analysis
The analysis is interpreted using the top 100 firms from various countries listed in their respective domestic stock indices, such as the BSE 100, FTSE 100, NASDAQ 100, Euronext 100, TSX 100, and ASX 100. A total of 261 days has been taken into consideration for the last financial year which is FY24-25.
|
Index |
Mean |
Standard Deviation |
|
S&P BSE 100 |
0.0003 |
0.0092 |
|
FTSE 100 |
0.0003 |
0.0061 |
|
S&P TSX 100 |
0.0005 |
0.007 |
|
S&P ASX 100 |
0 |
0.0073 |
|
NASDAQ 100 |
0.0003 |
0.0125 |
|
Euronext NV 100 |
0.0017 |
0.0113 |
Table 1: Descriptive Statistics
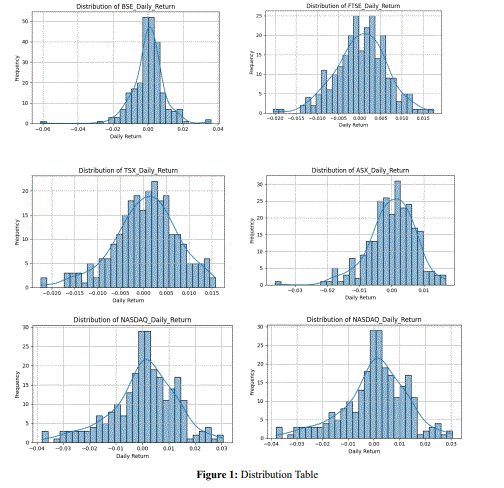
The analysis of top 100 firms across various global stock indices for FY24-25, spanning 261 trading days, reveals generally low positive average daily returns but varying volatility. The FTSE 100 exhibited the lowest volatility with lowest σ= 0.0061 suggesting stable price movements whereas, NASDAQ 100 displayed the highest volatility σ = 0.0125 alongside µ = 0.003, indicating significant daily price swings, typical of growth-oriented stocks. Euronext NV 100 offered the highest µ= 0.0017 but also high σ = 0.0113, signifying a dynamic market with higher risk-reward but S&P ASX 100 notably showed µ = 0, implying flat average daily performance with σ = 0.0073. S&P BSE 100 µ = 0.0003 and σ= 0.0092 and S&P TSX 100 with σ = 0.0005 and µ = 0.007 presented moderate returns and volatility. Overall, the period was characterized by marginal average gains, with notable differences in daily price stability across markets.
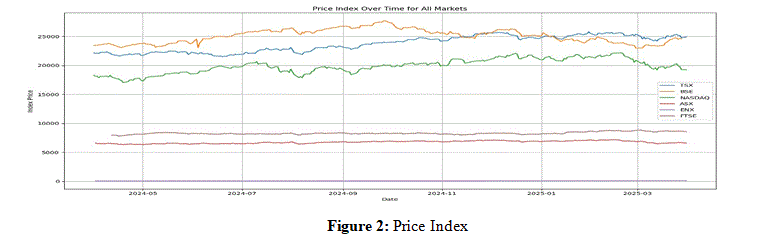
The above figure provides a comprehensive overview of several global stock market indices, illustrating the historical price movements of FY24-25. This allows for a visual comparison of their performance trends and relative magnitudes over the observed period.
|
Dependent Variable |
BSE Daily Return |
R-squared |
0.711 |
|
Model |
OLS |
Adjusted R-squared |
0.747 |
|
Method |
Least Square |
F-statistic |
1.335 |
|
No. of observations |
261 |
Prob (F-statistic) |
0.212 |
|
Df Residuals |
256 |
Log-Likelihood |
153.58 |
|
Df Mode |
5 |
AIC |
-259.2 |
|
Covariance Type |
non robust |
BIC |
-247.6 |
|
|
coefficient |
Standard Error |
t |
P>|t| |
[0.025 |
0.975] |
|
FTSE Daily Return |
0.3379 |
0.421 |
0.802 |
0.427 |
-0.511 |
1.135 |
|
TSX Daily Return |
0.5141 |
0.368 |
1.396 |
0.170 |
-0.228 |
1.269 |
|
ASX Daily Return |
0.3564 |
0.422 |
0.844 |
0.403 |
-0.494 |
1.298 |
|
NASDAQ Daily Return |
0.1914 |
0.212 |
0.901 |
0.372 |
-0.236 |
0.935 |
|
ENX NV Daily Return |
-0.2415 |
0.230 |
-1.051 |
0.299 |
-0.704 |
0.369 |
|
Omnibus: |
2.080 |
Durbin-Watson (DW) |
1.950 |
|
Prob (Omnibus): |
0.351 |
Jarque-Bera (JB) |
714.588 |
|
Skewness |
-0.337 |
Prob (JB): |
6.75e-156 |
|
Kurtosis |
3.369 |
Cond. |
196 |
Table 2: Regression Analysis
The regression analysis has been conducted to analysis the relationship between BSE and other international indices. The model yielded an uncentered R-squared of 0.711, indicating minimal explanatory power, and the overall model found to be statistically significant, as evidenced by a Prob (F-statistic) of 0.212. Critical diagnostic tests, including the Omnibus and Jarque-Bera, strongly indicated a severe violation of the normality assumption for residuals, with respective p-values of 0.001 and an extremely low 6.75e-156, alongside notable skewness and kurtosis. While the Durbin-Watson statistic of 1.950 suggested an absence of significant autocorrelation and the compromised residual normality significantly impacts the reliability of the inferential findings.
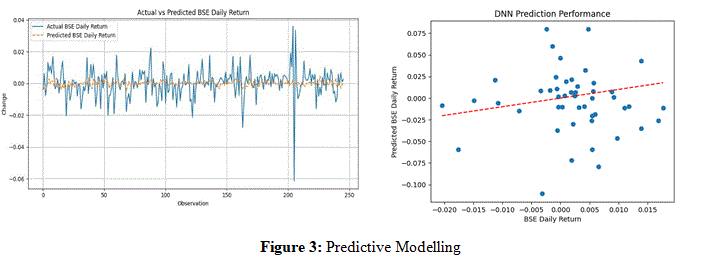
The provided visualizations offer insights into the predictive performance of different models for BSE Daily Return. The "Actual vs Predicted BSE Daily Return" time series plot, likely representing one of the regression models given its flat prediction line, demonstrates a significant inability to capture the actual daily fluctuations, showing a largely static predicted value against highly volatile actual returns. In contrast, the "DNN Prediction Performance" scatter plot, showing BSE Daily Return versus Predicted BSE Daily Return, indicates the DNN model to align predictions with actual values along the ðÂÃÃÃÂ???ÂÃÃÂ??ÂÃÂ?ÂÂ?¦ = ðÂÃÃÃÂ???ÂÃÃÂ??ÂÃÂ?ÂÂ?Â¥ line. While there's a wider scatter indicating prediction errors, the DNN appears to capture a range of movements (both positive and negative), suggesting it may offer a more nuanced, albeit still imperfect, relationship compared to the very static predictions of the regression model shown in the time series plot. Both visualizations collectively highlight the inherent difficulty in accurately predicting shortterm market movements.
|
MSE |
SSE |
MAE |
|
0.000083 |
0.020513 |
0.028167 |
The model exhibits excellent predictive accuracy, with very low Mean Squared Error value of 0.000083, Sum of Squared Errors value of 0.020513, and Mean Absolute Error value of 0.028167. Therefore, loss function leads to minimal deviation between predicted and actual values across the dataset.
Conclusion
This paper contains the analysis of global stock indices has yielded significant observations regarding market dynamics and the applicability of various statistical modelling paradigms.
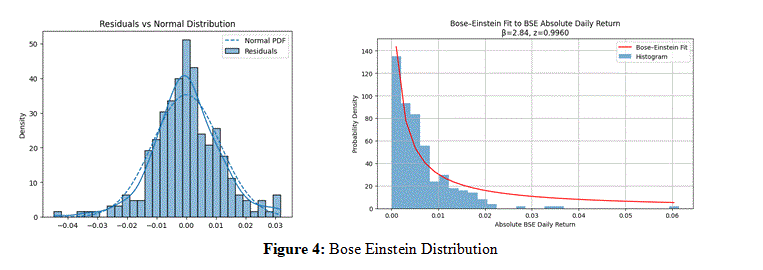
The application of regression to ascertain the relationship between daily return of top 100 firms within international indices demonstrated limited explanatory power. Bose-Einstein statistics were employed to model stock market indices, conceptualizing market states as energy levels and trading events as bosons. This framework effectively captured clustering effects in trading or price movements. However, despite providing a plausible descriptive fit for observed market volatility distributions, its explanatory power was limited, as reflected in notably low Rsquared values across all markets.
This research also underscores the inherent complexities associated with accurately forecasting short-term market movements. Bose- Einstein statistical model while offering analytical insights into stock market behaviour and pattern identification, demonstrated limitations in their predictive capacities within the scope of this study. Efficiency of the regression model was constrained by issues of residual normality and predictive precision, whereas the BoseEinstein framework, despite its descriptive utility for return distributions, exhibited restricted explanatory variance. These findings collectively highlight the formidable challenges confronting financial predictive modelling in dynamic market environments [6,7].
Further Scope of the Research
This paper consists of FY24-25 data and find the nature of the international stock markets. Other researchers can go for further statistical modelling by using various statistical tools and techniques.
Limitations of the Study
Stock market analysing may face a strong challenge to predicting the future stock market and it is a foolish game for traders and investors for a short-term period. But researchers also have to use proper mathematical modelling to examine the nature and predict the future outcome.
Ethical Standards
This stock market analysis was conducted with unwavering adherence to ethical principles. By maintaining the highest standards of research integrity, valuable insights were aimed to be contributed to the field of financial analysis, and the trust of the readers and the wider research community was upheld.
Funding
Author did not receive any funding for support for this work.
Declaration of Interest
No conflict of interest is declared by the author. And this paper is not for any commercial usage, author wrote it for non-commercial and pure education purpose.
Data Sharing Statement
The dataset is available in investment india official website.
References
- Hernández-Pérez, R. (2010).An analogy of the size distribution of business firms with Bose–Einstein statistics. Physica A: Statistical Mechanics and its Applications, 389(18), 3837- 3843.
- Staliunas, K. (2003). Bose-Einstein condensation in financial systems. arXiv preprint cond-mat/0303271.
- Lapinski, T. M. (2013). Limit theorems leading to Bose- Einstein, Maxwell-Boltzmann statistics and Zipf-Mandelbrot law (Doctoral dissertation, University of Warwick).
- Kusmartsev, F. V. (2011). Statistical mechanics of economics I. Physics Letters A, 375(6), 966-973.
- Xu, J. (2015). Bose-Einstein condensation mechanism in economic system. Europhysics Letters, 110(5), 58002.
- Shelankov, A., & Rammer, J. (2008). Counting statistics of interfering Bose-Einstein condensates. Europhysics letters, 83(6), 60002.
- Wang, J., Lin, C., & Wang, Y. (2019). Thermodynamic entropy in quantum statistics for stock market networks. Complexity, 2019(1), 1817248.