
International Journal of Clinical and Medical Education Research(IJCMER)
ISSN: 2832-7705 | DOI: 10.33140/IJCMER
Impact Factor: 0.93


Review Article - (2025) Volume 4, Issue 2
TestBio: An In Silico Tool for the Estimation of Phytocomplex Bioactivity
Received Date: Mar 02, 2025 / Accepted Date: Apr 01, 2025 / Published Date: Apr 04, 2025
Copyright: ©Ã?©2025 Alessandro Careglio. This is an open-access article distributed under the terms of the Creative Commons Attribution License, which permits unrestricted use, distribution, and reproduction in any medium, provided the original author and source are credited.
Citation: Careglio, A. (2025). TestBio: An In Silico Tool for the Estimation of Phytocomplex Bioactivity. Int J Clin Med Edu Res, 4(2), 01-04.
Abstract
TestBio is an in silico tool designed for the rapid estimation of phytocomplex bioactivity, with applications in medicinal plant re- search. The tool utilizes SMILES inputs of components, calculates molecular fingerprints, and compares them against a library of 1700 bioactive compounds using the Tanimoto coefficient [1]. It generates similarity scores, target information, and predict- ed bioactivities. TestBio visualizes data through interactive graphs, including scatter plots, bar charts, box plots, and network graphs, for similarity analysis, target frequencies, and compound-target interactions. Implemented in Python with libraries such as pandas, RDKit, matplotlib, and plotly, TestBio offers an efficient platform for preliminary in silico screening of phytocomplex bioactivity, supporting the identification of bioactive compounds from plant extracts and accelerating research in the field.
Introduction
Computational methods for predicting drug-target interactions can be broadly categorized into ligand-based, docking-based, and machine learning methods [2]. In traditional pharmacological research, a protein target is selected, and molecules with the highest affinity for that target are identified. Conversely, TestBio adopts a reverse approach, where one or more molecules are selected, and potential protein targets with which they may exhibit activity are predicted.
Machine learning methods, while powerful, were not chosen due to their high computational cost and the extensive training required for achieving reliable results. Traditional fingerprints, such as Morgan fingerprints, were selected for their simplicity, efficiency, and proven effectiveness in various applications, despite the potential of machine learning-based fingerprints to capture complex molecular relationships. The SMILES format was preferred for its manageability in molecular representation, ensuring consistent fingerprint generation [3,4].
Molecular Fingerprint Description
Molecular fingerprints are numerical representations of a molecule's structural features, analogous to chemical barcodes that capture the presence or absence of specific fragments or patterns.
These fingerprints are crucial for rapid molecule comparison, property prediction, and structural similarity identification. Morgan fingerprints, in particular, are widely used in computational chemistry for their ability to capture molecular connectivity characteristics [5].
It is known that plant species can contain thousands of different phytochemical compounds. However, for reasons of computational feasibility and analysis specificity, this study focuses on a set of approximately twenty characteristic compounds per species, selected based on their relevance and documentation in scientific literature. It is important to note that this model does not take into account the relative concentrations or specific activities of individual compounds, treating them as equivalent entities. This simplification allows for an efficient preliminary analysis, while acknowledging the intrinsic complexity of phytochemical composition [6].
Materials and Methods
TestBio is a software tool developed using the Django Python framework, accessible on GitHub at https://github.com/ alessandrocareglio/testbio. The code was generated with the assistance of artificial intelligence, following a structured development workflow:
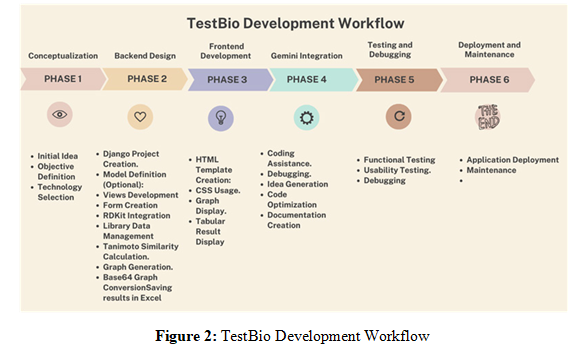
Phase 1: Conceptualization and Planning
• Initial Idea: The idea for TestBio arose from the need for an in silico tool to predict the bioactivity of phytocomplexes, simplifying research in the pharmaceutical and nutraceutical fields.
Objective Definition
o Create a web application that allows users to input molecules in SMILES format.
o Calculate molecular fingerprints.
o Compare fingerprints with a library of known compounds.
o Visualize results through interactive graphs.
o Provide a table with numerical results.
Technology Selection
o Django: Python web framework for backend and frontend development.
o RDKit: Chemical library for calculating fingerprints and manipulating molecules.
o Matplotlib, Seaborn, NetworkX, Plotly: Libraries for data visualization.
o Pandas: Library for data management and analysis.
o Gemini: Google's language model for coding assistance, debugging, and idea generation.
Phase 2: Backend Design and Development (Django)
• Django Project Creation: Initialization of a new Django project and creation of an application within the project.
• Model Definition (Optional): In this case, Django models were not used, as data is processed directly from files.
• Views Development
o index: Displays the form for SMILES input.
o process_smiles: Processes SMILES, calculates fingerprints,
compares with the library, and generates graphs.
o genera_scatterplot, genera_barplot, genera_boxplot, genera_ network_graph: Functions to generate graphs and encode them in base64.
o load_library_data: Loads fingerprints and targets from the
library.
o calculate_fingerprints, tanimoto_similarity, confronta_ fingerprints: Functions for fingerprint calculation and comparison.
• Form Creation: Use of django.forms to create a form for SMILES input.
• RDKit Integration: Use of RDKit to convert SMILES into molecules and calculate fingerprints.
• Library Data Management: Loading fingerprints and targets from text files.
• Tanimoto Similarity Calculation: Implementation of the function to calculate similarity between fingerprints.
• Graph Generation: Use of Matplotlib, Seaborn, and NetworkX to generate scatter plots, bar plots, box plots, and network graphs.
• Base64 Graph Conversion: Conversion of graphs to base64 format for display in the HTML template.
• Saving results in Excel: Saving the results into an Excel file.
Phase 3: Frontend Development (HTML/CSS/JavaScript)
• HTML Template Creation
o index.html: Template for the SMILES input form.
o results.html: Template to display results, including graphs and data table.
o base.html: base template.
• CSS Usage: CSS styles to enhance website appearance.
• Graph Display: Insertion of base64 images into HTML templates.
• Tabular Result Display: Creation of an HTML table to display comparison results.
• JavaScript Usage (Optional): Addition of JavaScript scripts to improve interactivity (e.g., for error handling or message display).
Phase 4: Gemini Integration
• Coding Assistance: Use of Gemini to generate code snippets, syntax suggestions, and solutions to specific problems.
• Debugging: Use of Gemini to identify and fix code errors.
• Idea Generation: Use of Gemini to explore different implementation options and improve project architecture.
• Code Optimization: Gemini was used to optimize code, making it more efficient and readable.
• Documentation Creation: Gemini was used to create code documentation.
Phase 5: Testing and Debugging
• Functional Testing: Verification of the correct functioning of all application features.
• Usability Testing: Verification of the user interface and user experience.
• Debugging: Correction of any errors or issues found during testing.
Phase 6: Deployment and Maintenance
• Application Deployment: Publication of the application on a web server.
• Maintenance: Updating and maintaining the application to ensure proper functioning and addition of new features.
Results
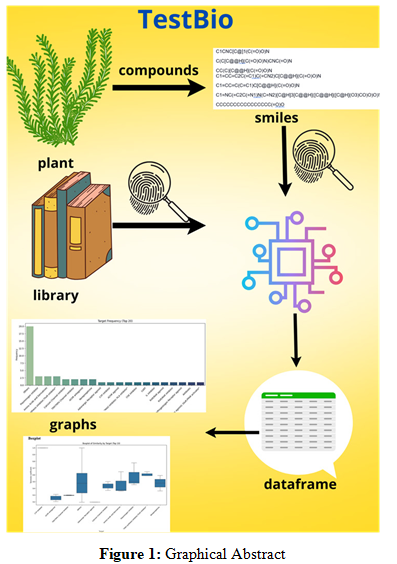
TestBio processes molecules in SMILES format, calculates Morgan fingerprints, and compares them with a library of bioactive compounds using the Tanimoto coefficient. The tool generates a comparison dataset, displaying the top five similarity results for each input compound. Visualizations include scatter plots for similarity score distribution, bar charts for target protein frequency, box plots for Tanimoto similarity distribution across targets, and network graphs for compound-target interactions.
TestBio generates several types of graphical representations to facilitate the interpretation of the similarity analysis. These visualizations are also included in the graphical abstract for a quick overview of the results.
Scatter Plot: This plot displays the distribution of Tanimoto similarity scores for each compound in the input phytocomplex. It allows for the identification of compounds with high or low similarity to the library compounds.
Bar Chart: This chart illustrates the frequency of different protein targets associated with the compounds in the phytocomplex. It provides insights into the potential targets of the compounds. Notably, the "others" category may appear in this graph. This is due to the presence of natural compounds, such as limonene, in the library, which do not have a defined protein target. To understand their biological activity, it is necessary to consult the similarity scores provided in the results table and other graphs.
Box Plot: This plot analyzes the distribution of Tanimoto similarity scores across different protein targets. It helps to understand the variability of similarity scores for each target.
Network Graph: This graph visually represents the interactions between the compounds in the phytocomplex and the potential target molecules. It allows for the identification of key interactions and potential synergistic effects.
Results Table Description
The results table provides a detailed overview of the similarity analysis. It includes the following information
• Query Index: The index of the compound in the input phytocomplex.
• Library Index: The index of the compound in the library.
• Tanimoto Similarity: The Tanimoto similarity score between the two compounds.
• Target: The protein target associated with the library compound.
• Bioactivity: The bioactivity of the library compound.
This table allows for a detailed analysis of the similarity scores and the identification of potential targets and bioactivities of the compounds in the phytocomplex."
These graphical representations provide a comprehensive overview of the similarity analysis and facilitate the interpretation of the results obtained with TestBio.
Discussion
TestBio offers a streamlined approach to preliminary in silico bioactivity screening, leveraging AI assistance to enhance development efficiency. The tool's integration of molecular fingerprinting and comparative analysis provides valuable insights into potential bioactivities of phytocomplexes.
Declaration of Competing Interests
There are no conflicts of interest to declare.
Funding
This project was self-funded.
Declaration of Generative AI Usage
Gemini was integrated into the workflow and was used for English translation and grammatical correction.
Disclaimer
Please note that TestBio is a research and development tool designed exclusively for use in academic and research settings. The information and results provided by TestBio should not be interpreted or used for diagnostic, therapeutic, or commercial purposes. This tool is intended to facilitate preliminary research and in silico analysis of phytocomplex bioactivity, but it does not replace the need for experimental studies and clinical validations. The use of TestBio for any other purpose is at the user's own risk. The authors and developers of TestBio disclaim all liability for any damages or consequences arising from the misuse of this tool.
References
1. Approved drugs library. Thanks to Dr. William Bains for publishing the library on Research Gate.
2. Nikraftar, Z., & Keyvanpour, M. R. (2023). A comparative analytical review on machine learning methods in Drugtarget interactions prediction. Current Computer-Aided Drug Design, 19(5), 325-355.
3. Boldini, D., Ballabio, D., Consonni, V., Todeschini, R., Grisoni, F., & Sieber, S. A. (2024). Effectiveness of molecular fingerprints for exploring the chemical space of natural products. Journal of Cheminformatics, 16(1), 35.
4. Liu, Z., Chen, H., Liu, X., Liu, B. & Chen, J. (2019). Deep learning for drug discovery: methods, applications and challenges. Briefings in bioinformatics, 20, 1641–1660.
5. Ertl, P. (2023). Morgan fingerprints—still going strong. Journal of cheminformatics, 19, 1–11.
6. Domingo-Fernández, D., Gadiya, Y., Mubeen, S. et al. (2023). Esplorare lo spazio chimico noto del regno vegetale: approfondimenti su modelli tassonomici, lacune di conoscenza e regioni bioattive. J Cheminform 15 , 107.