
Journal of Electrical Electronics Engineering(JEEE)
ISSN: 2834-4928 | DOI: 10.33140/JEEE
Impact Factor: 1.2


Research Article - (2023) Volume 2, Issue 3
Sociological Explanation of Factors Affecting Households Energy Consumption in Iran
Research Article J Electrical Electron Eng, 2023 Volume 2 | Issue 3 | 249-258; DOI: 10.33140/JEEE.02.03.07
Batoul Mahmoud Molaei Kermani1*, Hossein Mirzaei2, Mahdi Kolahi3 and Mahdi Kermani4
1Ph.D. in Economic Sociology and Development
2Assistant Professor, Faculty of Literature and Humanities,Ferdowsi University of Mashhad
3Assistant Professor, Faculty of Natural Resources and Environment, Ferdowsi University of Mashhad
4Assistant Professor, Faculty of Literature and Humanities, Ferdowsi University of Mashhad
*Corresponding Author : Batoul Mahmoud Molaei Kermani, Ph.D. in Economic Sociology and Development.
Submitted: 2023, June 21; Accepted: 2023, July 14; Published: 2023, August 04
Citation: Kermani, M. M. B., Mirzaei, H., Kolahi, M., Kermani, M. (2023). Sociological Explanation of Factors Affecting Households Energy Consumption in Iran. J Electrical Electron Eng, 2(3), 249-258.
Abstract
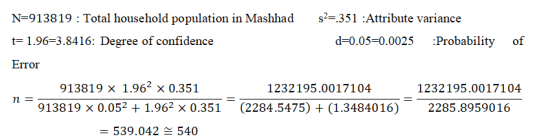
How energy is consumed as part of a lifestyle has attracted a lot of attention. Energy consumption, like other socio-economic phenomena, is influenced by various factors. The current paper aims at identifying the factors affecting the attitude towards households’ energy consumption in Iran (Mashhad). In recent decades, energy consumption has become one of the major urban issues with the growth of urban population, increasing. Mashhad is also one of the metropolises of Iran that according to statistics has a high consumption. Thus, the current paper was conducted quantitatively through a questionnaire with a sample of 540 households using cluster sampling method. The results showed that independent variables explained the variance of the dependent variable by 21.5%. Other results showed that the variables of religiosity, social inequality, environmental knowledge and social comparison directly affect household energy consumption and the variable of mass media use indirectly affected energy consumption by affecting social inequality.
- Keywords: Energy Consumption, Mashhad, Environmental Knowledge, Social Comparison.
1. Introduction
The rapid increase in energy production and consumption, followed by the increase in food production and economic growth over the past two centuries, has led to a dramatic increase in world population (from about 1 billion in 1800 to about 7 billion in 2000) during the so-called energy revolution [1]. Today, energy is considered as a basic necessity for social life and social integration, which has a strong relationship with social structure and power relations. Energy consumption has become part of social classification, and often social inequalities are manifested in different uses of energy [2].
In its World Energy Outlook report, the International Energy Agency predicts that energy consumption will continue to grow by 2035. According to the report, global energy consumption will grow by 36% from 2008 to 2035. The results also show that slightly more than 25 percent of the Middle East gas production is done by Iran, while the Middle East has only 12.5 percent of total world consumption, and in the latest statistical report (British Petroleum) in 2011, Iran consumed 1.5 million cubic meters more than production [3].
Higher energy consumption will eventually lead to more carbon dioxide emissions. Statistics show that given the rate of economic development of countries, energy consumption can lead to more greenhouse gas emissions, but the figures do not match in Iran. The results of global statistics show that the countries with the highest ranking in carbon dioxide production are China, USA, India, Russia, Japan, Germany, Canada, Iran, South Korea and Indonesia. In other words, Iran ranks eighth in carbon dioxide production, while Iran's economic ranking in the world is 65. However, it should be noted that the basis of the economic ranking of countries is income, as a country like Qatar ranks first in the world, and this ranking is only due to the sale and export of a single product, namely oil. The 10 higher economically ranked countries are Qatar, Macau, Luxembourg, Brunei, Ireland, the United Arab Emirates, Kuwait, Switzerland and San Marino (World Statistics Database), respectively.
Early views on consumption (e.g. Adorno and Horkheimer) emphasized political and economic implications in the macro dimension, regardless of consumers. In contrast, people like Schor (2008) emphasize individual aspects in which people are able to reduce environmental impact by reducing working hours and luxuries while increasing their quality of life. Of course, some consumption behaviours are due to habits and lifestyles that are due to the ways of socializing and learning from the past [4].
Consumption is a major part of human behaviour that the behavioural and psychological mechanisms of consumption underlie home consumption patterns; however, the foundations of consumer behaviour remain largely unknown and undiscovered. The problem of over-consumption of a phenomenon [such as energy] becomes more apparent, especially at the medium or macro level. In systems of considerable big size [such as the earth], too much loss of a particular phenomenon [such as energy] has little effect at the individual level, because the effects of individual consumption behaviour are determined only collectively [5]. However, these effects at the level of communities with excessive consumption patterns have dangerous effects on the world.
Communities are a combination of individuals with particular beliefs, values, norms, and ways of thinking, and this means that each is nurtured in their own cultural context, and so their response to a thing or situation may vary from one who lives in another cultural context. Although modernity has destroyed some traditions, it has nevertheless led to other approaches that are more in line with commercial, economic and political interests [6].
On the other hand; it should be noted that collective culture, through accepted discourses and economic institutions, also addresses the issue that consumers adapt goods to their lives in meaningful ways, and that these meanings are created through multiple and overlapping increments; that is, through consumers and as an integral part of their consumption. Hence, the term "consumer culture" seeks to suggest that core values and identities are tied to or transmitted through consumption and commodities [7].
The International Energy Agency, in a report on the World Energy Outlook, predicts that energy consumption will continue to grow by 2035. The report also states that global energy consumption will grow by 36% from 2008 to 2035. The results show that slightly more than 25 percent of the Middle East gas production takes place in Iran, while the Middle East has only 12.5 percent of total world consumption, and in the latest statistical report (BP) of 2011, Iran consumed 1.5 million cubic meters more than production. The cube has consumed more than production. However, a large part of the country's energy resources is wasted every year due to inadequate technology, reasonable energy prices and carelessness in consumption. Natural gas enjoys a special advantage, given its relatively cheap and competitive price compared to the thermal energy it produces, the well-being of households in terms of ease and continuity of access to it, less environmental pollution compared to other fuels and many other benefits [8]. The 10 highest electricity consumer countries in the world are: China, USA, Russia, India, Japan, Germany, Canada, Brazil, South Korea and France, respectively, in which Iran ranks 18th. Meanwhile, the top 10 countries in electricity production are: China, USA, India, Russia, Japan, Canada, Germany, Brazil, France and South Korea, and Iran ranks 16th out of 219 countries (global statistics).
Iran is the third largest producer of natural gas in the world, while a large part of its production goes to domestic consumption. The share of heating is 29% of production, 24% of power generation, 15% of non-petrochemical industries, 13% of petrochemical industries, 9% of injection and 3% of transportation. Also, more than 90% of households use natural gas for energy, and this fuel replaces liquefied hydrocarbons and is used for heating and cooking, increasing consumption by 180 million, cubic meters per day over the past 25 years [9]. The current paper aims at answering the following questions: 1-What are the main social factors affecting people is energy consumption? 2-What are the main cultural factors affecting people's energy consumption? 3-What are the main environmental factors affecting people's energy consumption?
2. Literature Review
Numerous researches have been done to explain the effect of the variables affecting the energy consumption of people in different places, and here are the most important and influential researches.
In a study using secondary data showed that social capital is different in different provinces and social capital has a negative impact on household electricity consumption in the provinces, meaning that with increasing social capital, electricity consumption will decrease and per capita household income will also affect electricity consumption [10].
In a study with a statistical sample of 383 households living in Yazd showed that the higher income is among the factors affecting the inappropriate pattern of energy consumption [11]. With the increase of religiosity in the doctrinal and emotional dimensions, energy consumption has a more appropriate pattern. While domestic media have a positive but weak impact on consumption patterns, international media have a negative impact.
Hansen conducted a research from 2011 to 2012, combining quantitative methods with qualitative perspectives. The results show that increased income will lead to the purchase of larger and more specific homes, and as a result will lead to more energy consumption. Education was also indirectly effective in that as education increased, individuals' incomes and thus social status, resulting in larger homes and increased heat.
Studied and explained attitudes related to energy and energy saving behaviors and research findings showed that economic factors such as income have influenced the installation of energy saving lamps and most people by adjusting the thermostat or having one or two energy saving lamps save energy at home [12].
Funk and Alper in a study in 2002 and 2014 tried to study the impact of religion on various aspects of American life, especially the environment, online and by telephone. Some results showed that only 6% of the sample believe that religious beliefs have lots of impact to think about protecting their environment. Also, religious affiliation and church attendance had nothing to do with people's perceptions of climate change, deep-sea research and drilling, and increased use of nuclear energy.
Showed in a study that students are concerned about energy problems, although this concern has little to do with cognition and behavior due to their limited knowledge; higher education students performed better in this regard, in other words, in addition to worrying, they also had appropriate energy consumption behavior [13]. Behavior is also more important than having knowledge of energy, and only about one-third of students recognized energy conservation as the fastest and cheapest way to meet energy needs.
In a study using secondary data analysis showed that people generally like to make social comparisons but prefer that the comparison be through non-rhythmic graphs. Also, people who could compare energy consumption showed more energy savings [14].
3. Theoretical Framework
Studies have shown that the subject of the environment, its and sociological dimensions, especially in the beginning, has been less considered by sociological knowledge. This can be due to various reasons, including the fact that at the beginning of the formation of sociological knowledge, human society had not yet experienced environmental problems as it is today, on the other hand, sociology was involved in more objective and serious issues such as political, social and religious chaos [15]. As Norgaard points out, in the beginning, modern sociology focused only on the development of societies and did not include environmental crises [16].
Since 1970s, sociology made its way into environmental studies and energy consumption as a social action, and many thinkers in this field rejected the monolithic economic view that human action, including consumption, a function of profit and loss and emphasized other social factors and variables such as preferences, social status, etc. As research has shown, for example, consumer preferences to buy goods and services can depend on demographic, environmental (geographical) and attitudes variables.
In the beginning, the sociology of energy consumption, like other topics in the sociology of consumption over the past two decades, has been that people use it "for everyday life," so it mostly refers to theories like that of Veblen. Veblen considers the two main ways of displaying wealth to be the Conspicuous Leisure and the Conspicuous Consumption [17]. He believed that most of the leisure time of the rich is not spent in front of the spectators, but can only serve the purposes of their fame. This result should be demonstrable, measurable and comparable to their competitors in other classes of products in the same class. This result should be demonstrated to their competitors in other provable, measurable, and comparable classes of products in the same class [18]. Veblen, as a socialist economist, rejects individualistic economic utilitarianism [19]. According to Veblen, financial ability or any wealth in order to be able to provide a status for its owner, must be ostentatious and showy and must show itself in consumption. And since wealth is the most important factor in gaining prestige, it must have an external appearance and the best example of it is demonstrative consumption [20]. Hence, in the modern world, consumption is more common for display. Accordingly, Veblen emphasized only the agent, but by presenting theories that were later combined, such as Bourdieu's theory, he tried to establish a link between the agent at the micro level and the structure at the macro level. In this theory, an attempt was made not to focus the sociological view of a phenomenon such as energy consumption only on the micro level
Bourdieu knows three types of capital to affect people's habits: The first type of capital is social capital, which is related with owning a sustainable network of more or less institutionalized relationships of mutual acquaintance and knowledge. In other words, group membership provides its members with the support of its collective capital. Thus, social capital includes resources based on links and group membership. As a result, both bond density and durability are important. The second type of people's capital is economic capital. Economic capital, which is related to one's wealth and income, is directly converted into money and can be institutionalized in property rights [21]. The third capital is cultural capital. For cultural capital should be an important mechanism of social reproduction, educational qualifications are an important mechanism through which wealth and power are transferred [22]. According to Bourdieu, most people bring their cultural capital from their families [23]. Of course, it should be borne in mind that cultural capital inherited from the family or acquired in school is to some extent the definition of capital [24]. In addition to Bourdieu, Giddens also took a holistic view of the issues, so as Giddens in his discussions considers the element of trust in the modern age as an essential element, especially in scientific and expert matters, and since the high impact of energy consumption on the atmosphere is also an expert discussion, thus the element of trust is essential. He also emphasizes the element of reproduction through schools and the media that these two intermediate structures are able to institutionalize a sense of inequality or the learning of values in individuals [25]. Refers to cultural reproduction through social institutions that, along with schools, encourage the perpetuation of social and economic inequalities. He focuses on the means by which schools influence the learning of values, attitudes, and habits through a covert program. According to him, mass media today have a role beyond providing entertainment and have a profound impact on people's lives. Mass media provide and shape a lot of information that we need and use in our daily lives.
Baudrillard is a theorist who has paid serious attention to the mass media. In his view, the media in the postmodern world is a tool that not only does not convey the message, but also represents reality itself. In fact, television is the creator of the world in which any construction can take place [26]. According to Baudrillard, in the current age and with the presence of mass media in all spaces, a new reality is created that includes a mixture of people's behaviours and media images [27]. Also, according to Baudrillard's theory, the meaning of "dissolving television and life in each other" is that the mass media have become so influential in social life that they play a decisive role in social life and it is difficult to distinguish reality from unreality [28]. In addition to Giddens' emphasis on the structure of the media, Baudrillard tried to take a fresh look at phenomena from a macro perspective and through the lens of television that can shape people's lives. Therefore, it can be said that according to Giddens and Baudrillard, the mass media, especially television, have a great ability to influence people's energy consumption and even change people's lifestyles. Thus, according to Baudrillard, mass media, especially television, can influence people's consumption culture.
4. Materials and Methods
Sampling is one of the most important issues in the social sciences, which is measured by the size of the population or the subjects to be sampled [29].
4. 1 Sampling
Cluster sampling; this sampling is generally used for large regions [30]. For this study, sampling was done from all 35 regions in 13 districts of Mashhad.
At first, an attempt was made to obtain the most recent division of regions and districts according to the category of space segmentation (status clusters) and according and given the adaptation of the development of the regions with the division of space (status clusters) five categories were named into in terms of development. Electricity and gas infrastructure was also considered as a variable due to the fact that it is usually related to the development of regions and also usually leads to feelings of inequality and consumption.
In the next step, having determined the sample size and in order for samples from all districts to be present in the sample, one neighborhood from each districts were selected at random numbers and sampling was done in the selected neighborhood of each districts as a proportional quota. The questioners were also reminded to distribute the questionnaires randomly among the blocks and to fill in only one questionnaire in each block. The blocks were filled in as regular numbers, ie one questionnaire for every 5 blocks.
4.2 Preliminary Test
The nature of research variables requires careful design of questions. Thus, before the final implementation of the questionnaire, the designed items and the structure of the questionnaire were tested in two stages. In the first stage, i.e. in the preliminary test stage, after referring the questions to the supervisors and the consulting experts and collecting the experts' opinions about the content and the wording of each item, the necessary corrections were made and the questionnaire was finalized. After preparing the questionnaire, it was tested among 40 citizens of Mashhad and after evaluating the Cronbach's alpha level as well as the type of response of the respondents to the questions, a number of questions were removed or corrected.
5. Results
5.1 Research Validity and Reliability
Measuring the validity and reliability is important for any social research [31]. After preparing the referrals, we must make sure that they measure the concept that we want to measure (Validity) and also make sure that we can trust the answers they give to our questions. The question that people answer today in one way and tomorrow in another way is a useless question (this is the issue of reliability) [32].
| Variables Dimensions | Questionnaire | |||
|---|---|---|---|---|
| Number of items | Reliability coefficient | |||
| Energy Consumption | - | 8 | 0.624 | 0.624 |
| Religiosity | Practical | 3 | 0.573 | 0.867 |
| Epistemological | 3 | 0.644 | - | |
| Emotional | 4 | 0.793 | - | |
| Social capital | Links | 4 | 0.717 | 0.803 |
| Membership | 5 | 0.825 | - | |
| Feeling of Social Inequality | --- | 8 | 0.784 | 0.784 |
| Social Comparison | --- | 6 | 0.780 | 0.780 |
| Mass Media | --- | 6 | 0.565 | 0.565 |
| Environmental Knowledge | --- | 10 | 0.763 | 0.763 |
Table 1: Cronbach's Alpha Coefficient of Scales in the Questionnaire.
5.2 Descriptive Results
The results showed that most of the respondents belong to the high school diploma level with 227 samples. Following the high school diploma, the number of bachelor's degree holders is the highest (146 people). The lowest number of respondents is in the illiterate and doctoral categories, in each of which there are 4 samples, although in the illiterate category one sample is male and in the doctoral category there are 3 male samples. 75% of the respondents were married. The main respondents have an income of 2 million Tomans per month, followed by 3 million Tomans, and income of 15 million Tomans was the lowest number among the people surveyed.
5. 3 Energy Consumption
The results show that the energy consumption variable is almost normal. However, given the high sample size (above 30) and the assumption of normal in this case, given the high volume of data, as a result, the variables are considered normal
The items of this variable are more related to the attitude or the way people face energy consumption. What people will do to save or waste were measured in a Likert scale. Descriptive results of this variable show that 16% of people have moderate and occasional consumption, which means that this percentage of people have moderate consumption; they are not too frugal and not too extravagant. About 35.2% of people are literally wasteful and do not care about consumption and other issues related to energy consumption. About 48.8% of people are frugal and sensitive to the issue of balanced consumption and the consequences of improper consumption.
5.4 Religiosity
This variable was measured based on model [33]. Religiosity was considered to have three dimensions: epistemological, practical and emotional. In the epistemological dimension, the intensity of belonging, attachment and trust in the content of religion, in the practical dimension the signs of religiosity (appearance and identity) and attention to religious rites and participation and in the emotional dimension seeking meaning and creativity were examined. The results showed that the average religiosity (3.37) among people is more than half (2.5). The relatively low variance of individuals 'responses indicates individuals' religious agreement. Respondents seem to be more religious and religious in nature<./p>
In total, less than 5% (4.1%) of the people in question do not have very religious beliefs, 73.4% of people are in the range of moderate religiosity and about 22.5% of people have high beliefs.
5. 5 Social Capital
To measure this variable based on Bourdieu's theory, two dimensions of membership and links were measured. In the membership dimension, the average response of people is more than half (4.51) and in the link dimension, it is close to half. And the scatter of responses is almost the same in both dimensions. In both dimensions, the mean and the median are close.
To measure this variable based on Bourdieu's theory, two dimensions of membership and links were measured. In the membership dimension, the average response of people is more than half (4.51) and in the link dimension, it is close to half. And the scatter of responses is almost the same in both dimensions. In both dimensions, the mean and the median are close.
To measure this variable based on Bourdieu's theory, two dimensions of membership and links were measured. In the membership dimension, the average response of people is more than half (4.51) and in the link dimension, it is close to half. And the scatter of responses is almost the same in both dimensions. In both dimensions, the mean and the median are close.
A- Links: Less than half (38.9%) of the respondents have little social relations and less than ten percent (7.4) have very high social relations.
B- Membership: 1.2% of people have little membership in groups. About 36% of the sample stated that they are members of the mentioned groups and are very active in them. In contrast, only 0.2% of sample were not members of any of the groups in question.
5. 6 Social Comparison
Most respondents try to make some comparison for consumption. The average of the answers is more than half (2.5) and it is close to the median and the index. The variance of the respondents, although not very high, has slightly increased compared to other variables. Also, about 8.8% of respondents are against comparing, while about 37.1% often compare their consumption with others, and 54.1% of people believe that one of the best ways to consume is to compare yourself with others to get the right results.
5. 7 Social Inequality
The average social inequality among the respondents is 2.48, which is close to the median, and in other words, the respondents feel that there is a lot of social inequality in the society, and also the amount of variance confirms that there is agreement among the respondents in this regard. 29.9% of the respondents are against the presence of inequality in the society, while 22.2% of the people agree and believe that in today's society, social inequality is high. 47.7% were in the middle.
5. 8 Environmental Knowledge
To measure this variable, ten yes and no items were used to examine the respondents' environmental knowledge. The results showed that people's environmental knowledge is relatively high. The average of their answers is higher than half of the score and shows that people's environmental knowledge is relatively good and a small amount of variance is a confirmation of this. The results of this section showed that only 5 (0.8%) respondents answered 10 items incorrectly. 42 samples (7.12%) gave at least one correct answer to the questions. However, these answers include less than 50% of the correct answers and 342 samples (57.97%) answered more than half of the questions correctly. The results also show that 201 samples (34.07%) answered all the items correctly.
| Variables Name | N | Missing | Mean | Median | Mode | Variance | Kurtosis | Skewness |
|---|---|---|---|---|---|---|---|---|
| Energy Consumption | 562 | 37 | 3.76 | 3.76 | 3.63 | 0.451 | -0.60 | -0.18 |
| Religiosity | 565 | 34 | 3.37 | 3.42 | 4.33 | 0.534 | -0.543 | -0.138 |
| Social Capital Links | 597 | 2 | 3.47 | 3.50 | 3.00 | 1.00 | -0.129 | -0.243 |
| Membership | 597 | 2 | 4.51 | 4.60 | 6.00 | 1.26 | -0.769 | -0.369 |
| Social Comparison | 593 | 6 | 3.13 | 3.16 | 3.17 | 0.615 | 0.195 | -0.175 |
| Feeling of Social Inequality | 571 | 28 | 2.48 | 2.50 | 2.63 | 0.568 | -0.322 | 0.080 |
| Mass Media | 560 | 39 | 2.85 | 2.83 | 3.00 | 0.461 | -0.017 | -0.177 |
| Environmental Knowledge | 590 | 9 | 0.800 | 0.90 | 1.00 | 0.051 | 1.556 | -1.363 |
Table 2: Descriptive Statistics of Research Variables.
6. Inferential Statistics
Hypothesis 1: There is a relationship between feelings of inequality and energy consumption.
The results showed that there is no significant relationship between energy consumption and the feeling of social inequality and in other words, the feeling of inequality in society has no effect on people's consumption attitudes.
Hypothesis 2: There is a relationship between religiosity and energy consumption.
The results confirm that there is a positive and significant relationship (0.243) between energy consumption and religiosity, although the relationship is relatively weak. However, it can be said that in the sample, increasing the religious beliefs in people causes them to have a more positive attitude towards energy consumption.
Hypothesis 3: There is a relationship between media use and energy consumption.
Pearson correlation between energy consumption and media use is significant, positive and weak (0.091).
Hypothesis 4: There is a relationship between social capital and energy consumption.
Pearson correlation between energy consumption and social capital was significant, positive and weak (0.089).
Hypothesis 5: There is a relationship between economic capital and energy consumption.
The results of Pearson correlation coefficient test indicate that there is no significant relationship between energy consumption and economic capital of the samples.
Hypothesis 6: There is a relationship between cultural capital and energy consumption.
The correlation (analysis of variance) between cultural capital (the sample and their parent’s education) and energy consumption was not confirmed and this indicates that the cultural capital of individuals has no effect on their energy consumption.
Hypothesis 7: There is a relationship between social comparison and energy consumption.
Pearson correlation between energy consumption and social comparison is significant, positive and relatively weak (0.241).
Hypothesis 8: There is a relationship between environmental knowledge and energy consumption.
The results confirm that there is a positive and significant relationship (0.255) between energy consumption and environmental knowledge, although the relationship is relatively weak. However, it can be said that in the study sample, increasing environmental knowledge and awareness of people leads to a more positive attitude towards energy consumption.
7. Regression Analysis of Energy Consumption Variables
| Research hypotheses | Non-standard coefficient | Standard coefficient | |||
|---|---|---|---|---|---|
| B | Standard deviation | β | t | sig | |
| Constant number | 2.163 | 0.317 | --- | 6.184 | 0.000 |
| Income | 0.025 | 0.017 | 0.070 | 1.510 | 0.132 |
| Job prestige | 0.004 | 0.003 | 0.060 | 1.298 | 0.195 |
| Religiosity | 0.218 | 0.043 | 0.239 | 5.040 | 0.000 |
| Environmental Knowledge | 0.547 | 0.131 | 0.184 | 4.166 | 0.000 |
| Mass Media | 0.023 | 0.048 | 0.022 | 0.469 | 0.639 |
| Social Comparison | 0.186 | 0.041 | 0.220 | 4.486 | 0.000 |
| Feeling of Social Inequality | -0.148 | 0.043 | -0.165 | -3.481 | 0.001 |
| Social Capital | 0.105 | 0.035 | 0.142 | 2.983 | 0.003 |
Table 3: Regression Analysis of Energy Consumption Variables.
Square R, which is in fact the coefficient of explanation, shows that this analysis explains 0.187 and in other words 18.7% of the changes in the dependent variable. The table above shows that all variables except mass media and job prestige of individuals are able to influence energy consumption and have the ability to predict behaviour. Also, the results of the above table show that the greatest impact on energy consumption goes for individual values (religiosity), social comparison and then environmental knowledge and then social capital of individuals, respectively.
8. Structural Equation Model
In a structural equation model, the researcher, on the one hand, seeks to measure a set of references and, on the other hand, analyses the structural relationships between the hidden variables. Therefore, some of the variables in the structural model may be of the observed variables. On the other hand, the structural equation model is a combination of measurement and structural models. Measurement models are derived from the theoretical foundations of the studied phenomena and structural models are derived from the theoretical foundations of research [34].
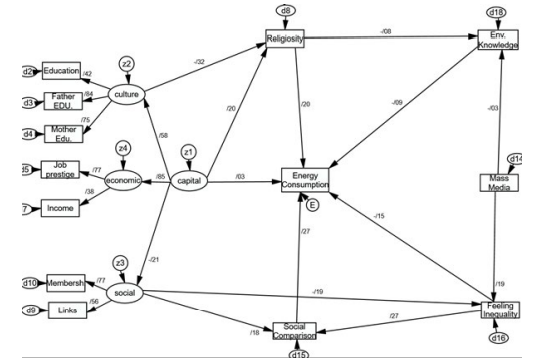
Figure 1: Figure 1: Research Structural Equation Model.
| CMIN/DF | PGFI | CFI | PCFI | RMSEA | HOELTER0/05 | |
|---|---|---|---|---|---|---|
| Model indices | 3.196 | 0.538 | 0.898 | 0.587 | 0.061 | 252 |
| Optimal minimum value | 1 | 0.5 < | 90< | 0.5< | 0.05> | 200 |
| Optimal maximum value | 5 | 0.6 < | 0.6 < | 0.08> | >200 | |
Table 4: Modified Model Indices.
The results of the Indies in Figure (1) of the structural equation model show that this model is acceptable. In particular, indices such as the root-mean-square deviation (RMSD) and the Holter enjoy good values. The normalized Chi-square index (CMIN / DF) is also one of the indices for model acceptability. Considered values between 1 and 5 acceptable. Therefore, the above model can be considered an acceptable model.
| Variable | Standard value | Standard error | Critical Ratio (C.R) | P-Value |
|---|---|---|---|---|
| Capital <--- Social Capital | -0.214 | 0.106 | -2.750 | 0.000 |
| capital <--- Cultural Capital | 0.584 | --- | --- | --- |
| Mass Media <--- Social Inequality | 0.194 | 0.044 | 4.914 | 0.016 |
| Capital <--- Religiosity | 0.201 | 0.102 | 2.328 | 0.011 |
| Cultural Capital <--- Religiosity | -0.317 | 0.062 | -3.534 | 0.002 |
| Social Capital <--- Social Inequality | -0.191 | 0.047 | -3.340 | 0.000 |
| Social Capital <--- Social Comparison | 0.176 | 0.051 | 3.131 | 0.001 |
| Capital <--- Economical Capital | 0.854 | 0.555 | 2.002 | 0.000 |
| Religiosity <--- Environmental Knowledge | -0.084 | 0.019 | -2.065 | 0.006 |
| Mass Media <--- Environmental Knowledge | -0.031 | 0.022 | -0.752 | 0.000 |
| Social Inequality <--- Social Comparison | 0.268 | 0.043 | 6.930 | 0.020 |
| Economical Capital <--- Job prestige | 0.774 | 2.376 | 4.408 | 0.000 |
| Social Capital <--- Membership | 0.770 | --- | --- | --- |
| Social Capital <--- Links | 0.561 | 0.146 | 4.434 | 0.000 |
| Cultural Capital <--- Education | 0.422 | 0.054 | 9.107 | 0.000 |
| Cultural Capital <--- Mo. EDU | 0.746 | --- | --- | --- |
| Cultural Capital <--- Fa. EDU | 0.841 | 0.101 | 12.782 | 0.000 |
| Economical Capital <--- Income | 0.380 | --- | --- | --- |
| Social Inequality <--- Energy Consumption | -0.150 | 0.036 | -3.767 | 0.000 |
| Social Comparison <--- Energy Consumption | 0.266 | 0.033 | 6.632 | 0.000 |
| Religiosity <--- Energy Consumption | 0.196 | 0.033 | 5.081 | 0.000 |
| Envir. Knowledge <--- Energy Consumption | -0.093 | 0.072 | -2.445 | 0.014 |
| Capital <--- Energy Consumption | 0.032 | 0.053 | 0.625 | 0.532 |
Table 5: Results of the Values of the Variables in the Structural Equation Model.
The results of the above table show that there is a relationship between energy consumption and the variables of social inequality, social comparison and environmental knowledge consistent with the regression results and correlation coefficients, in other words, these variables directly affect sample's energy consumption.
The variable of media is indirectly more effective in influencing social energy consumption by influencing social inequality than by influencing the increase of environmental knowledge. In other words, it can be claimed that mass media has not taken an effective step to increase environmental knowledge of individuals for optimal energy consumption, but increased the feeling of social inequality.
Religiosity as one of the cultural variables affects the optimal use of energy both directly through religious teachings and indirectly through environmental knowledge.
Conclusion and Discussion
Today, energy consumption is one of the concerns of different countries with influential micro and macro consumption factors. Nowadays, energy consumption increases for a variety of reasons including the increase of population, development of industrial cities, the change of culture towards individualism and according to Veblen theory, people tendency toward showing their class through consumerism. Therefore, environmental sociology is one of the new branches of sociology today that addresses the behaviour of energy consumers along with economic sociology.
The theoretical part of the results of previous and experimental researches showed that the effective variables of social field such as capital (economic, social and cultural) and social comparison, the variables of the cultural field including religiosity and mass media and the variables of the environmental sociology field, namely environmental knowledge affect energy consumption.
According to Bourdieu's theory, types of capital have an effect on people's consumption. The results of the current paper showed that social capital has a positive effect on energy consumption. However, the other two capitals are not related to energy consumption and in other words have no effect on energy consumption. The results of structural equation model showed that social capital has an inverse effect on people's sense of social inequality, meaning that the stronger a person's social capital, the less people feel social inequality, which of course can be due to the strengthening of relationships between people and also there is an inverse relationship between feelings of social inequality and energy consumption, meaning that people with lower feelings of social inequality will not retaliate for more energy consumption, and thus it can be inferred that the impact of links and membership in different groups (more social capital) makes people experience less inequality. In fact, when people do not have an outward view of things but have a realistic view, it will cause energy consumption (as it was revealed in initial interviews that some people consume more simply because of retaliatory behaviour due to social inequality) to reduce energy consumption. And as Giddens well points out, mass media is one of the factors that increase the sense of social inequality among individuals, and the structural equation model confirms this.
According to Baudrillard theory, the mass media today is an effective tool in the hands of the government and can be used to change the behaviour of the consumer culture of individuals and used in the direction of macro-policies. The results of the present study also showed that the impact of the media on people's religiosity is almost zero, but people make choices based on their religiosity. Also consistent with the results of the research of the effect of mass media on consumption, although positive and very small, but this effect is indirect and through the effect on people's sense of social inequality on energy consumption.
The results of the current analysis also showed that the social comparison of individuals has a direct and positive effect on energy consumption of individuals and this research is consistent with the results of which shows that individuals through social comparison and in fact through the comparisons they make among themselves and others are able to manage and modify their consumption as well.
Previous research emphasized the effect of people's income on people's energy consumption behaviour, so that with increasing income, people's energy consumption will also increase, while the results of the current paper did not confirm this result, and showed that there is no relationship between people's energy consumption and people's income [35].
The results of the current paper, consistent with the results of show that religiosity is effective on energy consumption with a positive effect, meaning that the more people show commitment to their values, the more will show appropriate energy consumption behaviour. It also showed that there is a weak relationship between religiosity of individuals and their environmental knowledge and considering that they were questioned in relatively religious communities, it seems that the effects and religious teachings affect their environmental behaviour and this research is consistent with that showed the relationship between people's religiosity and their environmental behaviour and confirm it [36].
According to the results, it seems that if the government wants more proportionate consumption by the people, it should first try to reduce the feeling of social inequality and the mass media should avoid emphasizing this inequality and sometimes exaggeration as much as possible. And at the same time take steps to increase public confidence in organizations (for example, by increasing the transparency of measures and formulas for calculating bills), which can be done by comparing the two that arise between people in a neighbourhood in which people are aware of which consumption groups are relative to those around them [37-41]. Also, the increase in social capital of individuals shows that in different provinces, the amount of this social capital is different, so it is possible to increase social capital in different provinces with low amounts.
References
- Christophorou, L. G. (2018). Emerging Dynamics: Science, Energy, Society and Values. Springer International Publishing.
- Brunner, K. M., Mandl, S. (2014). Energy Consumption and Social Inequality: The Problem of Fuel Poverty, editor: Sigrid Reiter, Energy consumption: impacts of human activity, current and future challenges, environmental and socio-economic effects, New York: Nova.
- Bakhtiari, S., & Yazdani, M. (2012). Strategic Importance of Natural Gas and Necessity of Management and Reform on its Consumption Pattern.
- Dietz, T., Shwom, R. L., & Whitley, C. T. (2020). Climate change and society. Annual Review of Sociology, 46, 135- 158.
- Goldblatt, D. L. (2007). Sustainable energy consumption and society: personal, technological, or social change? (Vol. 7). Springer Science & Business Media.
- Inglis, D. (2005). Culture and everyday life, London:Psychology Press.
- Slater, D. and Tonix, F. (2015). Bazaar Society (Modern Bazaar and Social Theory), Translator: Hossein Ghazian, Tehran: Ney Publishing.
- Janjan, M.R., Abbasiyan, E. and Moridian Pirdosti, A. (2009). A Study of Economic Factors Affecting Domestic Gas Demand in Iran, Quarterly Journal of Fiscal and Economic Policies, 7(27), fall, pp. 43-69.
- Deputy of Infrastructure Research and Production Affairs (2009). Outlook for the situation of electricity and natural gas in Iran in 2040, Subject Code: 310, Serial Number: 16404, Office of Energy, Industry and Mining Studies.
- Mozaffari, Z. and Motefaker Azad, M.A. (2018). The Impact of Social Capital on Household Electricity Consumption in the Provinces of Iran, Quality and Productivity of the Iranian Electricity Industry, Year 7, No. 14, Fall and Winter, pp. 47-60.
- Zare Shahabadi, A., Hajizadeh Meymandi, M., Lotfaliani Aberandabadi, A. M., Soleimani, Z. (2013). Investigating the Impact of Socio-Cultural Factors on Energy Consumption Pattern in Households in Yazd. Energy Planning and Policy Research, 1 (3), Fall, pp. 17-50.
- McClaren, M. S. (2015). Energy efficiency and conservation attitudes: An exploration of a landscape of choices (Doctoral dissertation, Portland State University).
- DeWaters, J. E., & Powers, S. E. (2011). Energy literacy of secondary students in New York State (USA): A measure of knowledge, affect, and behavior. Energy policy, 39(3), 1699-1710.
- Grevet, C., & Mankoff, J. (2009, July). Motivating sustainable behavior through social comparison on online social visualization. In HCI conference (pp. 1-5).
- Ritzer, G. (2008). Sociological Theories in Contemporary Times, Translator: Mohsen Solasi, Tehran: Scientific Publications.
- Norgaard, R.B. (2000). A co-evolutionary environmental sociology, The International Yearbook of Environmental and Resource Economics 2000/2001, edited by: Redclift, Michael; Woodgate, Graham, USA: Edward Elgar.
- Zokaei, M. S. (2012). Consumption and Lifestyle. The Pathology, approach and issues, Rassaneh (Mass media Scientific Quarterly), 23 (88), pp. 5-33.
- Veblen, T. (2003). The theory of the leisure class, USA: Pennsylvania State University.
- Fadaei, M. (2017). Thorstein Veblen (1857-1929), CulturalSocial Quarterly, Taste of Life, 2(4), Spring, pp. 107-111. /li>
- Veblen, T. (2004). The Leisure Class, translated by Farhang Ershad, Tehran: Ney. World Map Data Site (2020). Iran's ranking in electricity generation among 219 countries.
- Bourdieu, P. (1986). The Forms of Capital, in Handbook of Theory and Research for the Sociology of Education ed JG Richardson, New York: Greenwood Press, Pp. 231-258.
- Sullivan, A. (2002). Bourdieu and education: How useful is Bourdieu's theory for researchers? Netherlands Journal of Social Sciences, 38(2), 144-166.
- Swedenberg, R. (2012). Utilitarianism and Social Structure (Discussions in Economic Sociology), Translator: Ali Asghar Saeedi, Tehran: Loh-e-Fekr.
- Bourdieu, P. (2018). Distinction (Social Critique of Taste Judgments). Translated by Hassan Chavoshian, Tehran: Sales.
- Giddens, A. (2009). Consequences of Modernity, Translator: Mohsen Solasi, Tehran: Markaz Publishing.
- Zahedi, M. J. and Noorani, N. (2010). Critique of Baudrillard's view on the role of the media in shaping the social problem and reality. Iranian Journal of Sociology, 18 (1), Spring, pp. 3-31.
- Reyshahri, H., Nazeri, A. and Shayganehfar, N. (2009). Representation of Media-Influenced Cultural Simulation in Contemporary Visual Arts Based on Jean Baudrillard Theory (Case Study of Cartina Fritz), Journal of Fine Arts - Visual Arts, 22 (4), Winter, p. 5-14.
- Payende, Hossein (2013). Media Reflection: Baudrillard's Postmodern Approach to Media Analysis, QuarterlyJournal of the Iranian Association for Cultural Studies and Communication, 9 (33), Winter, pp. 11-30.
- Sarmad, Z., Bazargan, A. and Hejazi, E. (2001). Research Methods in Behavioral Sciences, Iran: Ageh.
- Rafiepor, F. (2010). Explorations and Thoughts: An Introduction to Methods of Community Cognition and Social Research, Tehran: Publication.
- Sarukhani, B. (2008). Research Methods in Social Sciences (Principles and Foundations), Tehran: Institute of Humanities and Cultural Studies, Volume One.
- De Vaus, D. A. )2002). Survey in Social Research, translated by Houshang Naebi, Tehran, Ney Publishing.
- Shojaeezand, A. (2005). A Model for Measuring Religisity in Iran. Iranian Sociological Association, 6 (1), pp. 34-66.
- Ghasemi, V. (2009). Structural Equation Modeling in Social Research Using Amos Graphics, Tehran: Sociologists.
- Hansen, A. R. (2016). The social structure of heat consumption in Denmark: New interpretations from quantitative analysis. Energy Research & Social Science, 11, 109-118.
- Funk, C., & Alper, B. (2015). Religion and Science, Pew Research Center.
- Beheshti Nejad, M. (2016). Critique of Anthony Giddens' Cultural Theory. Studies in the Evolution of the Humanities, Volume 4, Number 6, Spring and Summer, pp. 82-102.
- Bukharaei, A., and Shanati Sharghi, N., and Rostami, Sh., and Sharbatian, M. (2018). Spatial analysis of social vitality in urban areas of Mashhad, Physical Planning and Development, 3 (3 (11 in a row)), 134-153.
- Hatami Nejad, H., Zarei, M., Hajiloo, M., Tabei, N. and Valizadeh, Z. (2017). Leveling of Mashhad city areas based on the level of urban services using Vickor technique, geographical space, 17(57), spring, pp. 1-17.
- Schobert, H. H. (2002). Energy and society: An introduction, CRC Press.
- Schor, J. (2008). The overworked American: The unexpected decline of leisure, Basic books.
Copyright:
Copyright: ©2023 Batoul Mahmoud Molaei Kermani, et al. This is an open-access article distributed under the terms of the Creative Commons Attribution License, which permits unrestricted use, distribution, and reproduction in any medium, provided the original author and source are credited.