Research Article - (2024) Volume 6, Issue 3
Predicting Student Achievement: Exploring Non-Cognitive Feature Interactions Using Machine Learning Models
2Department of Management, College of Administrative Science, University of Science and Technology, K, Sudan
3Quality Assurance Unit, University of Science and Technology, Khartoum, Sudan
4College of Engineering and Architecture, National University, Khartoum, Sudan
Received Date: Nov 11, 2024 / Accepted Date: Dec 13, 2024 / Published Date: Dec 30, 2024
Copyright: ©2024 Khalid Abd El Mageed Elamin, et al. This is an open-access article distributed under the terms of the Creative Commons Attribution License, which permits unrestricted use, distribution, and reproduction in any medium, provided the original author and source are credited.
Citation: Elamin, K. A. E. M., Musa, B. A., Elnasry, N., Al Mekawi, S. (2024). Predicting Student Achievement: Exploring Non- Cognitive Feature Interactions Using Machine Learning Models. J Edu Psyc Res, 6(3), 01-14.
Abstract
This research investigates how non-cognitive skills can predict student achievement, as measured by GPA. Non-cognitive traits like self-control, goal attainment, interpersonal connections, and leadership skills develop in students at various stages and are influenced, whether positively or negatively, by their environment and social circle. Because non-cognitive features alone are complex and intertwined, feature engineering is needed to create new features that combine these non-cognitive traits with each other or with cognitive features, in order to better predict student success by Analyzing their impact on academic performance at the end of the year. Various machine learning models including linear regression, gradient boosted regression model, random forest and XGBoost were employed and developed to assess the impact of these features. An important part of our approach includes feature engineering, which entails developing new features that incorporate the effects of both noncognitive features and, at times, cognitive and noncognitive features on student performance. Our findings show that the linear regression model performs the best while The Gradient Boosting and XGBoost models also have strong scores of 0.796 and 0.826, indicating a good fit to the data. These findings underline the significance of thoroughly studying non-cognitive factors on a large scale to establish connections between non-cognitive traits and cognitive traits, enabling the prediction of students' academic performance and early intervention for struggling students to encourage increased effort.
Keywords
Student Achievement Prediction, Non-Cognitive Features, Machine Learning Models, Feature Interaction Analysis, Educational Data Mining
Introduction
While cognitive talents sincerely preserve enormous importance, there's an increasing acknowledgment of the cost of non-cognitive elements in education, as a result of their capacity to definitely impact students' instructional performance and fulfilment in later lifestyles [1-3]. By identifying multiple theoretical frameworks that emphasize the significance of utilizing non-cognitive skills knowledge in learning for the achievement of academic success, the authors of examine the theoretical framework of non-cognitive components [4]. First, the self-empowerment theory put forth by emphasizes the importance of exchange skills, motivation, and perceived self-control in academic performance, especially for African students with a focus on young Americans [5]. Second, resilience theory suggests that environmental protective factors such as family and community support can outweigh risk factors, enabling a student to enhancing relative capacity to succeed. Last but not least, the logic model looks at a variety of cognitive and noncognitive elements that contribute to academic success, such as motivation and emotional intelligence, and demonstrates how these elements are connected and have a combined impact on student progress. For instance, research indicates that students who have a strong feeling of self-efficacy and ownership are more likely to persevere through difficulties and achieve academic success, which supports the desire for independence and strengthens the internal factors that foster these traits. However, despite a growing body of literature, there are notable differences in how these non- cognitive factors interact with specific demographic variables such as socioeconomic status and cultural context. Integrated machine learning approaches present new opportunities for understanding student success [6].
The application of machine learning (ML) to educational data mining (EDM) represents a growing area of research aimed at improving educational outcomes [6]. In the authors present a framework that uses machine learning algorithms to investigate noncognitive variables that affect student performance [7]. This is consistent with, who highlighted the growing interest in data analysis methods to reveal patterns of student behavior and performance [8]. The use of extraction techniques such as principal component analysis (PCA) is a common thread in studies, which facilitates the identification of key success determinants [7]. To understand more about the best algorithms for various student demographics, more study is necessary to examine how well machine learning models work in various educational contexts.
Using multiple linear regression (MLR) models, the study emphasizes the significance of noncognitive talents in predicting academic performance [9]. The results of a number of research that have looked into how cognitive and noncognitive elements interact in schooling are in line with this [10-13]. Integrating features such as artificial fish and cuckoo search optimization for feature selection represents a new approach in the literature, reflecting a shift towards more sophisticated approaches in predictive analytics [14].
However, there is currently insufficient research on the potential bias introduced by these models, particularly among underrepresented student groups, which calls for a thorough investigation of the lack of bias in predictive assessment. Numerous techniques for forecasting student performance have been highlighted in the literature. With differing degrees of effectiveness, research has employed ensemble approaches, logistic regression, and decision trees [15-17]. A comparison of these approaches reveals that, although machine learning frequently produces better predictions, particularly in difficult educational environments, classic statistical methods are still sufficient. Despite this, there are gaps in systematic reviews that integrate findings from different approaches, which can help identify best practices and inform future research directions. The importance of noncognitive factors in predicting academic success has gained momentum in educational research.
The emphasize factors such as academic mindsets, perseverance, and social skills, which have been established that they are important determinants of student performance and retention [18-21]. This is in line with earlier research that also found the importance of noncognitive knowledge in teaching outcomes [1,4,22-25]. According to study, student who have a strong sense of self-efficacy and ownership, for example, are more likely to overcome obstacles and succeed academically. This reinforces the internal characteristics that encourage the desire for independence.
However, despite a growing body of literature, there are notable differences in how these noncognitive factors interact with specific demographic variables such as socioeconomic status and cultural context. This paper used linear regression, random forest, and gradient boosting regression models to predict student achievement and addresses the need to incorporate feature engineering and interaction effects into these noncognitive analyzes. By systematically examining how various noncognitive factors interact with each other and with demographic variables, we can gain deeper insights into their collective effects on academic success. This approach not only enhances predictive modelling but also provides a more nuanced understanding of the playful dynamics of students’ learning experiences. Further research in this area could therefore greatly contribute to the development of targeted interventions that better support different student populations.
This paper has three major contributions to answering the following research questions.
1. How do cognitive and non-cognitive features independently impact student achievement (GPA) whilst analyzed one at a time in comparison to whilst they're mixed with feature engineering terms?
2. How do raw cognitive and noncognitive features versus engineered noncognitive features and interaction terms impact predictive power for student achievement between linear regression, random forest, and gradient boosting regression models?
3. Which feature-engineering interaction terms provide the most significant improvement when predicting student achievement (GPA) over various machine learning models?
To put it briefly, this paper is structured as follows. Section 2 describes the research methodology, including data collection, exploratory data analysis and feature engineering, data preprocessing, and model validation techniques. Section 3 illustrates how machine learning models are utilised to predict student's performance outcomes and provides a comparison of both engineering characteristics and errors between multiple models. Section 4 discusses the implications of the findings for education policy and practice, the role of abstract variables, the comparison of modelling approaches, directions for future research, and the limitations of the analysis. A summary of the key conclusions and contributions of this study is given in Section 5, which concludes the paper.
Methods
Data Collection
To gather data for this study, a questionnaire was distributed to 380 university students, aiming to capture a comprehensive range of cognitive and non-cognitive factors influencing academic achievement. The questionnaire included items designed to assess various dimensions of non-cognitive features based on the work done, such as [26]:
1. Academic Perseverance (Self-Control):
- I have a hard time breaking bad habit.
- I get distracted easily.
- I refuse things that are bad for me, even if they are fun.
- People would say that I have very strong self-discipline.
- Pleasure and fun sometimes keep me from getting work done.
2. Learning Strategies (Goal Setting):
- I set short-term goals.
- I set long-term goals.
- I set challenging goals.
- I set timelines for my goals.
- I regularly think about my progress toward goals to see how I can do better.
3. Perseverance of Effort:
- Setbacks don't discourage me.
- I am a hard worker.
- I finish whatever I begin.
- I am attentive and persistent in my activities.
4. Growth Mindset:
- I don't think I personally can do much to increase my abilities.
- My abilities are something about me that I can't change very much.
- I can learn new things, but I can't change how capable I am.
5. Leadership Competence:
- I am often a leader in groups.
- I would prefer to be a leader rather than a follower.
- I can usually organize people to get things done.
6. Community Involvement (Prosocial Behavior):
- I take an active role in my community.
- I care about contributing to making my community a better place for everyone.
- I want to go to college to benefit my community.
This questionnaire was designed online for ease, and to encourage participation. This research incorporated several non-cognitive variables, as indicated in Table 1, to analyze the impact of non- cognitive variables on the students' GPA and holistic academic performance. Later, these responses will be analyzed with various machine learning models to investigate the association among these non-cognitive factors with learning outcomes. Abstract items delivered through the questionnaires were presented to the students, and this was according to the work, as shown in Table 1 below [6].
|
Academic Perseverance (The Self-control) |
Learning strategies-Goal Setting |
||
|
I have a hard time breaking bad habit |
AcadPersSel-1 |
I set short-term goals |
LSGSe-1 |
|
I get distracted easily |
AcadPersSel-2 |
I set long-term goals |
LSGSe-2 |
|
I refuse things that are bad for me, even if they are fun |
AcadPersSel-3 |
I set challenging goals |
LSGSe-3 |
|
People would say that I have very strong self-discipline |
AcadPersSel-4 |
I set timelines for my goals |
LSGSe-4 |
|
Pleasure and fun sometimes keep me from getting work done |
AcadPersSel-5 |
I regularly think about my progress toward goals to see how I can do better |
LSGSe-5 |
|
I often act without thinking through all the alternatives |
AcadPersSel-6 |
I figure out how to overcome potential obstacles before setting out to accomplish goals |
LSGSe-6 |
|
Perseverance of Effort |
I give up on goals when I don’t make progress as expected |
LSGSe-7 |
|
|
Setbacks don't discourage me |
PersEff-1 |
I reflect on my progress and adjust my goals |
LSGSe-8 |
|
I am a hard worker |
PersEff-2 |
I don't bother trying to pursue goals that are very difficult |
LSGSe-9 |
|
I finish whatever I begin |
PersEff-3 |
I seek help when I’m having difficulty achieving a goal |
LSGSe-10 |
|
I am attentive and persistent in my activities |
PersEff-4 |
When I set goals; I do whatever it takes to achieve them |
LSGSe-11 |
|
Academic Mindsets (Growth Mindset) |
I create new goals after I successfully complete old goals |
LSGSe-12 |
|
|
I don’t think I personally can do much to increase my abilities |
Groth-1 |
Leadership Competence |
|
|
My abilities are something about me that I personally can’t change very much |
Groth-2 |
I am often a leader in groups |
Lead-1 |
|
I can learn new things; but I can't change how capable I am |
Groth-3 |
I would prefer to be a leader rather than a follower |
Lead-2 |
|
Prochirality |
I would rather have a leadership role when I am involved in a group project |
Lead-3 |
|
|
I take an active role in my community |
Proch-1 |
I can usually organize people to get things done |
Lead-4 |
|
I give my time to do things that benefit the community |
Proch-2 |
Other people usually follow my ideas |
Lead-5 |
|
I care about contributing to make my community a better place for everyone |
Proch-3 |
I find it very easy to talk in front of a group |
Lead-6 |
|
I give my time to do things that benefit my family |
Proch-4 |
I like to work on solving a problem myself rather than wait and see if someone else will deal with it |
Lead-7 |
|
I care about giving back to my family |
Proch-5 |
I like trying new things that are challenging to me |
Lead-8 |
|
I want to go to college in order to benefit my community |
Proch-6 |
|
|
|
My community's successes are my successes |
Proch-7 |
||
|
When someone praises my community; it feels like a personal compliment |
Proch-8 |
||
Table 1: Sets of Non-Cognitive Student Features Attributes Used
Data Preprocessing
Data cleaning and preparation for analysis was the first phase of this study. Several noncognitive measures of student performance generated raw data, which were first examined for quality and completeness. Identification of missing variants and careful handling by imputation or deletion made the data set reliable for further analysis.
To ensure that each feature is on the same scale, an important feature for many machine learning algorithms, the data set was then standardized. To enable an unbiased comparison of intangible attributes, this includes normalizing the scores of the individual components using a minimum scale approach on. After preprocessing, we organized the data in a structured format suitable for both feature engineering, where we focused on additional integration and interaction characteristics that would enhance the predictive power of our models’ improved effectiveness.
Feature Engineering
Feature transformation is one type of feature engineering, it is about constructing new features from existing features; this is often achieved using mathematical mappings [27]. To increase the predictive power of our model, we engaged in an extensive feature engineering process, which involves creating additional variables through the attribute a there are already non-cognitive
links each word to put together carefully capture dimensions specific to students’ behaviors and intentions Constructed [28,29]. For example, the factor ‘Self-Discipline_Persistence’ combines items for self-discipline and mindset, which together reflect a student’s ability to concentrate on academic tasks. Similarly, the ‘Growth_Mindset_Effort’ dimension combines growth mindset indicators with persistence scores to highlight students’ resilience in the face of academic challenges. Further understanding of the statistical process and the rationale behind each interaction term chosen will provide additional exposure, leading to reproducibility and better understanding between researchers and practitioners. The following new features were created based on existing non- cognitive traits:
Self-Discipline_Perseverance
Formula: data['Self-Discipline_Perseverance'] = data['Acad- PersSel-1'] + data['AcadPersSel-4'] + data['PersEff-1'] + data['PersEff-4']. Explanation: This feature aggregates indicators of self-control and perseverance, capturing a student's overall ability to maintain focus and commitment to tasks. Higher values are expected to correlate with improved academic performance see Figure (1).

Figure 1: The Self-Discipline_Perseverance feature, its forming independent features, and their correlation to the student's cumulative GPA. (Self-Discipline_Perseverance = AcadPersSel-1+ AcadPersSel-4 + PersEff-1+ PersEff-4).
Goal_Setting_Progress_Reflection
Formula: data['Goal_Setting_Progress_Reflection'] = data['LSGSe-1'] + 1/b*data['LSGSe-2'] + c*data['LSGSe-3'] - data['LSGSe-7']
Explanation: This feature emphasizes the importance of setting and reflecting on goals, weighed up to prioritize challenging and short-term goals while penalizing tendencies to give up. This approach may enhance motivation and accountability, resulting in better goal achievement see Figure (2).
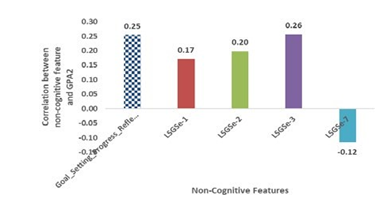
Figure 2: The Goal_Setting_Progress_Reflection feature, its forming independent features, and their correlation to the student's cumulative GPA. (Goal_Setting_Progress_Reflection = LSGSe-1 + 1/a* LSGSe-2 + b* LSGSe-3 - LSGSe-7).
Leadership_Qualities_Community
Formula: data['Leadership_Qualities_Community'] = data['Lead-4'] + data['Proch-1'] + data['Proch-2'] + data['Lead-3']
Explanation: This feature combines leadership qualities with community involvement, reflecting a student's ability to mobilize others and contribute positively to community projects, potentially leading to higher academic and social performance see Figure (3).
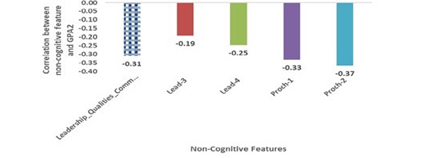
Figure 3: The Leadership_Qualities_Community feature, its forming independent features, and their correlation to the student's cumulative GPA. (Leadership_Qualities_Community = Lead-4 + Proch-1+ Proch-2 + Lead-3).
Growth_Mindset_Effort
Formula: data['Growth_Mindset_Effort'] = data['Groth-1'] * d + data['PersEff-2'] + data['Groth-2'] * e + data['LSGSe-1']
Explanation: This feature integrates growth mindset beliefs with perseverance, highlighting that effort can lead to improvement. A strong growth mindset can foster resilience, resulting in better performance in challenging academic environments see Figure (4).
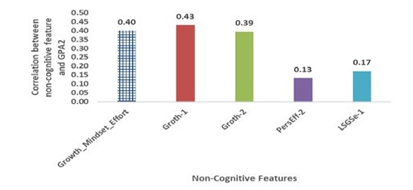
Figure 4: The Growth_Mindset_Effort feature, its forming independent features, and their correlation to the student's cumulative GPA. (Growth_Mindset_Effort = c*Groth-1+ PersEff-2 + d*Groth-2+ LSGSe-1).
Remark 1: All constants a, b, c, d, and e are real numbers representing appropriate weights chosen based on the importance of each feature.
Multiplied Feature
AcadPersSel-2 Adjustments
Adjustment: data['AcadPersSel-2'] = 1/a * data['AcadPersSel-2']
Effect: This reduction suggests that distraction is less impactful than other factors.
AcadPersSel-3 Adjustments
Adjustment: data['AcadPersSel-3'] = b * data['AcadPersSel-3']
Effect: Emphasizes the importance of resisting bad influences.
AcadPersSel-4 Adjustments
Adjustment: data['AcadPersSel-4'] = c * data['AcadPersSel-4']
Effect: Reinforces the role of self-discipline in academic performance.
After multiplying the features by an appropriate factor based on the selected important features, the mean of the specified features such as AcadPersSel, Goal Achievement, Growth Mindset and Leadership Effectiveness will be obtained as follows.
Academic Perseverance (Self-control)
Formula: data ['AcadPersSel] = data [' AcadPersSel -1', ' AcadPersSel -2', ..., ' AcadPersSel -6']. mean(axis=1)
Explanation: This feature gives the ability to stay focused and maintain effort on academic tasks despite challenges or distractions. A higher average may correlate with improved academic success see Figure (5).
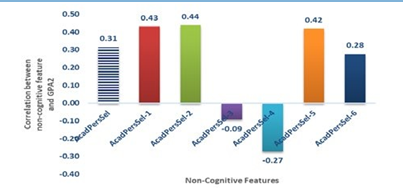
Figure 5: The AcadPersSel feature, its forming independent features, and their correlation to the student's cumulative GPA (AcadPersSel= mean ['AcadPersSel-1', 'AcadPersSel-2', 'AcadPersSel-3', 'AcadPersSel-4','AcadPersSel-5', 'AcadPersSel-6]).
XGoal_achievement
Formula: data['Goal_achievement'] = data ['LSGSe-1', 'LSGSe-2'].., 'LSGSe-12']. mean(axis=1)
Explanation: This feature averages various goal-setting indicators, providing a comprehensive view of a student's goal- oriented behavior. A higher average may correlate with improved academic success see Figure (6).

Figure 6: The Goal_achievement feature, its forming independent features, and their correlation to the student's cumulative GPA (Goal_achievement = mean ['LSGSe-1', 'LSGSe-2', 'LSGSe-3', 'LSGSe-4', 'LSGSe-5', 'LSGSe-6', 'LSGSe-7', 'LSGSe-8', 'LSGSe-9', 'LSGSe-10', 'LSGSe-11', 'LSGSe-12').
Growth_Mindset
Formula: data['Growth_Mindset'] = data ['Groth-1', 'Groth-2', 'Groth-3']. mean(axis=1)
Effect: Captures average mindset beliefs that influence how students approach challenges see Figure (7).
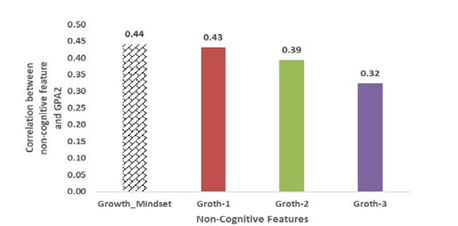
Figure 7: The Growth_Mindset feature, its forming independent features, and their correlation to the student's cumulative GPA (Growth_ Mindset = mean ['Groth-1', 'Groth-2', 'Groth-3']).
leadership_effectiveness
Formula: data['leadership_effectiveness'] = data ['Lead-1', ...,'Lead-8']. mean(axis=1)
Effect: Identifies students likely to succeed in collaborative environments see Figure (8).
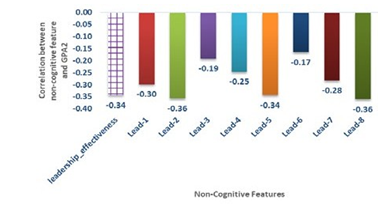
Figure 8: The leadership_effectiveness feature, its forming independent features, and their correlation to the student's cumulative GPA (leadership_effectiveness = mean ['Lead-1', 'Lead-2', 'Lead-3', 'Lead-4', 'Lead-5', 'Lead-6', 'Lead-7', 'Lead-8']).
Perseverance of Effort and Prosocial Behavior
Resilience
Formula: data['Resilience'] = data['PersEff-1'] + data['PersEff-2'] + data['PersEff-3'] + data['PersEff-4']
Effect: High resilience scores indicate a strong capacity to overcome challenges see Figure (9).
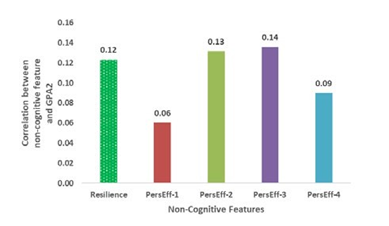
Figure 9: The Resilience feature, its forming independent features, and their correlation to the student's cumulative GPA (Resilience = PersEff-1 + PersEff-2 + PersEff-3 + PersEff-4).
prosocial_Behavior
Formula: data['prosocial_Behavior'] = data['Proch-1'] + ... + data['Proch-8']
Effect: High scores may correlate with positive peer relationships and engagement see Figure (10).
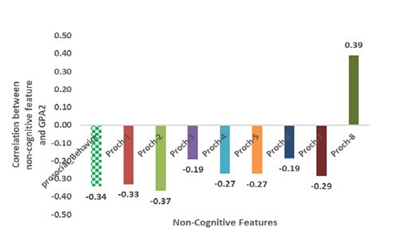
Figure 10: The prosocial_Behavior feature, its forming independent features, and their correlation to the student's cumulative GPA (prosocial_Behavior = Proch-1 + Proch-2 + Proch-3 + Proch-4 + Proch-5 + Proch-6 + Proch-7 + Proch-8).
Interaction Features
self_discipline_reflection
Formula: data['self_discipline_reflection'] = data['AcadPersSel']
* data['Growth_Mindset']
Explanation: Captures the interplay between self-discipline and growth mindset, enhancing predictive power see Figure (11).
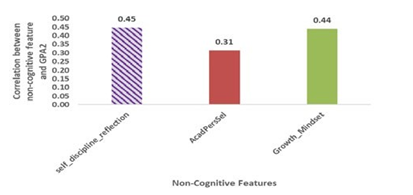
Figure 11: The self_discipline_reflection feature, its forming independent features, and their correlation to the student's cumulative GPA (self_discipline_reflection = AcadPersSel * Growth_Mindset).
community_discipline_reflection
Formula: data['community_discipline_reflection'] =
data['activities'] * data['prosocial_Behavior']
Effect: Highlights the importance of community involvement alongside discipline.
"Activities" feature in this formulation is regarded as a cognitive skill, reflecting students' involvement in extracurricular activities see Figure (12).
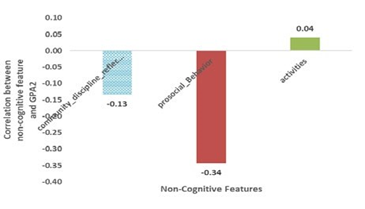
Figure 12: The community_discipline_reflection feature, its forming independent features, and their correlation to the student's cumulative GPA (community_discipline_reflection = activities * prosocial_Behavior).
Resilient Self-Discipline
Formula: data ['Resilient Self-Discipline'] = data['Resilience'] * data['AcadPersSel']
Effect: Combines resilience with self-discipline to predict a student's ability to persist in studies see Figure (13).
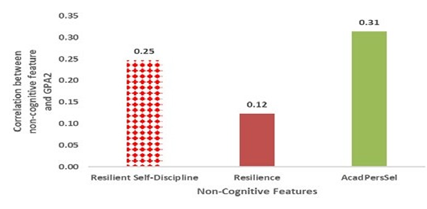
Figure 13: The Resilient Self-Discipline feature, its forming independent features, and their correlation to the student's cumulative GPA (Resilient Self-Discipline = Resilience * AcadPersSel).
Growth-Oriented Achievement
Formula: data ['Growth-Oriented Achievement'] = data['Growth_ Mindset'] * data['Goal_achievement']
Effect: Emphasizes the importance of having a growth mindset in achieving set goals see Figure (14).
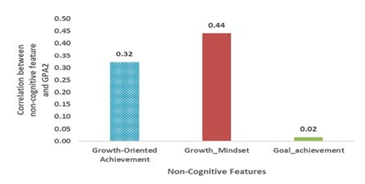
Figure 14: The Growth-Oriented Achievement feature, its forming independent features, and their correlation to the student's cumulative GPA (Growth-Oriented Achievement = Growth_Mindset * Goal_achievement).
Figures (1-14) illustrate the effect of features engineering and features interactions which reflect the correlation between student achievements (student GPA) and the generated features.
Dropping Individual Features
This was done to reduce noise and multicollinearity, allowing the model to focus more on the newly developed features, which had more complex relationships, as shown in Figure 15 below. This smoothing of the feature space is expected to improve the overall performance of the model
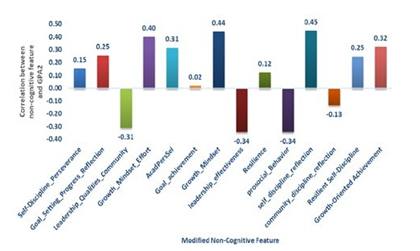
Figure 15: The new generated dependent features, and their correlation to the student's cumulative GPA.
In the analytical phase, Figures 1 to 15 displays a set of designed and interaction-based non-cognitive traits and their correlation with student GPA, exhibiting the strength and direction of these relationships through correlation coefficients. These characteristics were created to highlight the intricate relationships between non-cognitive qualities that each have a distinct impact on academic performance, such as self-discipline, perseverance, growth mindset, and community involvement. Each generated feature's relationship to both GPA and its developing independent features is shown by the correlation coefficients that accompany these figures, which offer a thorough analysis of the ways in which distinct non-cognitive traits influence academic results. High positive correlation coefficients, for example, for traits like "Self-Discipline_Perseverance" highlight how perseverance and self-control work together to foster prolonged academic focus. Additionally, interaction features, such as "Growth-Oriented Achievement," show substantial correlations, indicating that integrating growth mindset with goal-setting enhances the predictive relationship with GPA. These values underscore the importance of feature interactions and allow a nuanced understanding of each non-cognitive factor’s influence on academic success.
Model Validation
We performed 6-fold cross-validation to verify the performance of our models, computing several measures such as Mean Squared Error (MSE), Root Mean Squared Error (RMSE), Mean Absolute Error (MAE), and R-squared (R²) [30,31]. According to our findings, feature engineering enhanced model accuracy in all measures, particularly through interaction terms. When given well-constructed features, simpler models can perform on par with complicated models, as seen by the Linear Regression model's greatest R2 score of 0.849 with feature interaction terms. Additional interaction patterns in the data were captured by ensemble models such as Gradient Boosting and XGBoost, which also demonstrated competitive performance. Table 2 below summarizes the cross- validated performance metrics for each model:
|
Model |
Performance Metrics with feature engineering and interaction |
|||
|
MSE2 |
RMSE2 |
MAE2 |
R2 score2 |
|
|
Linear Regression |
0.052 |
0.228 |
0.171 |
0.849 |
|
Gradient Boosting Regressor |
0.058 |
0.239 |
0.165 |
0.833 |
|
Random Forest |
0.053 |
0.227 |
0.153 |
0.847 |
|
XGBoost |
0.059 |
0.240 |
0.156 |
0.831 |
Table 2: The Cross-Validated Performance Metrics for Each Model
Results
The performance of various machine learning models was assessed in predicting student GPA based on both cognitive and non- cognitive features, including engineered features and interaction terms. R-squared (R²) values, which measure the proportion of variance in GPA explained by each model, were used to evaluate model performance. Results indicated that feature engineering and the inclusion of interaction terms notably improved model accuracy across all tested models.
Linear Regression Model
• R² with Feature Engineering and Interaction Terms: 0.826
• R² without Feature Engineering and Interaction Terms: Lower than 0.798
The Linear Regression model achieved the highest R² of 0.826 when incorporating feature interactions, showing a strong fit to the data [32]. This indicates that adding interaction terms between non-cognitive features such as self-discipline with perseverance, or growth mindset with leadership competence significantly enhanced the predictive capability of the model. In contrast, models that used only raw features (without feature engineering or interactions) demonstrated a noticeably lower R², underscoring the contribution of feature engineering in capturing complex relationships.
Gradient Boosting Regressor Model
• R² with Feature Engineering and Interaction Terms: 0.798
• R² without Feature Engineering and Interaction Terms: 0.754 The Gradient Boosting Regressor model performed higher R² of 0.798 when feature engineering and interaction terms were included [33]. This value suggests that the interactions between non-cognitive factors add valuable insights, likely capturing nuanced patterns in student performance that individual features alone could not fully explain.
XGBoost Model
• R² with Feature Engineering and Interaction Terms: 0.796
• R² without Feature Engineering and Interaction Terms: 0.736 The XGBoost model performed higher R² of 0.796 when feature engineering and interaction terms were included [34]. This value suggests that the interactions between non-cognitive factors add valuable insights, likely capturing nuanced patterns in student performance that individual features alone could not fully explain.
Random Forest Model
• R² with Feature Engineering and Interaction Terms: 0.765
• R² without Feature Engineering and Interaction Terms: Lower than 0.764
The Random Forest model achieved an R² of 0.765 when incorporating interaction terms, showing a slight performance improvement compared to its performance without these enhancements [35]. Although this model’s R² was lower than that of Linear Regression, it still indicates that engineered features and interactions contribute meaningfully to GPA prediction accuracy.
Feature Importance Analysis Results
In the present analysis, permutation importance is one of the useful techniques to apply when one wants to understand how important each feature has been to a regression model.
Permutation importance works by measuring the reduction in a model's performance-in this case, negative mean squared error- when the values of a feature are randomly shuffled or "permuted." Features that have a larger impact on the model's predictive power will exhibit a greater drop in performance when permuted, indicating their higher importance.
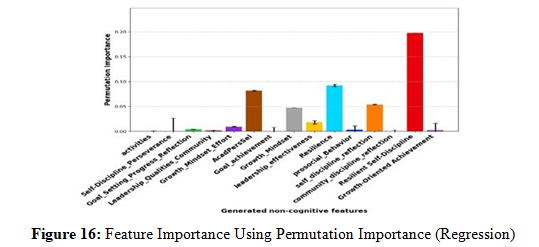
Figure (16) above shows the features relative importance from the permutation-based analysis [36]. The most striking feature is "Self-Discipline" whose importance score is far the highest, reaching about 0.20. This means that self-discipline was ranked most important in boosting the model's predictive capability as it considerably reduced the prediction error.
Other features that are notably important include "Perserverance", "Goal-Setting/Progress Reflection", and "Grit", all of which show a relatively high importance score, though not as strongly dominant as self-discipline. These features are very influential in this model with high predictive ability.
In contrast, the following features are less important: "Community- Self-Discipline", "Growth Mindset-Effort", and "Goal Achievement" are much lower in magnitude; hence, they play a less important role when it comes to this model's predictions.
Error bars are included in the plot and add information that is useful, representing the variability of the importance measures resulting from many permutations. Accordingly, features with larger error bars, such as "Resilience Self-Discipline" and "Proactive Social Behavior," are more uncertain with respect to their importance, while for other features the error bars are small, which indicates a rather robust ranking of the importance scores.
Impact of Feature Engineering and Interaction Terms on Model Performance
These findings support the hypothesis that non-cognitive features, when combined through feature engineering and interaction terms, provide a richer, more predictive understanding of student performance. The interaction terms, in particular, revealed how combinations of non-cognitive attributes—such as resilience coupled with community involvement—are associated with higher academic achievement, likely due to their combined influence on student motivation, engagement, and persistence.
Comparison between performance metrics, Mean Squared Error (MSE), Root Mean Squared Error (RMSE), Mean Absolute Error (MAE) and R-squared (R2 score) of Linear Regression model, Random Forest Model, Gradient Boosting Regressor and XGBoost Models with and without feature engineering and interaction terms are shown in Table 3 and Figure 17 below [37].
|
Model |
Performance Metrics without feature modified |
Performance Metrics with feature modified |
||||||
|
MSE1 |
RMSE1 |
MAE1 |
R2 score1 |
MSE2 |
RMSE2 |
MAE2 |
R2 score2 |
|
|
Linear Regression |
0.065 |
0.255 |
0.179 |
0.798 |
0.056 |
0.236 |
0.162 |
0.826 |
|
Gradient Boosting Regressor |
0.079 |
0.281 |
0.182 |
0.754 |
0.065 |
0.255 |
0.163 |
0.798 |
|
Random Forest |
0.077 |
0.276 |
0.176 |
0.764 |
0.076 |
0.275 |
0.169 |
0.765 |
|
XGBoost |
0.085 |
0.291 |
0.174 |
0.736 |
0.066 |
0.256 |
0.156 |
0.796 |
Table 3: Mean Squared Error (MSE), Root Mean Squared Error (RMSE), Mean Absolute Error (MAE) and R-squared (R2 score) for Linear Regression, Gradient Boosting Regressor, Random Forest, and XGBoost Models
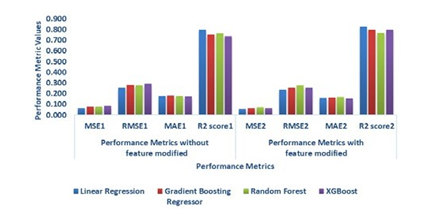
Figure 17: Mean Squared Error (MSE), Root Mean Squared Error (RMSE), Mean Absolute Error (MAE) and R-squared (R2 score) for linear regression, gradient boosting regressor, random forest, and XGBoost models
Discussion
The results of this study highlight the relevance of both cognitive and non-cognitive attributes in predicting student outcomes, which caused the Linear Regression model to yield a performance of 0.826 mean R² (R²) score. This indicates that these features, together with their designed interaction terms, are sufficient for variance in student GPA.
Significance of Non-Cognitive Features
What We Found: Non-Cognitive Skills (Self-Discipline, Perseverance, Growth-Mindset, etc.) are Critical to Achieving Academic Success While not ideal in the setting of academia, the aforementioned factors can provide insight into a specific student's ability to cope with challenges, and their perseverance to continue their education. It is possible that interaction terms are effective because that is how non-cognitive characteristics interact when contributing to academic performance. Certain attributes, such as self-control, persistence, and leadership ability seem to correlate multiply, for example leadership and community service is probably a measure of the student’s capability to rally other students to serve the community. These behaviors can lead to climates that are conducive to learning, and this finding emphasizes the notion that non-cognitive skills are interdependent and should be linked together in educational approaches.
Model Comparisons
The better performance of the Linear Regression model over much more complex models such as Gradient Boosting Regressor and XGBoost suggests that the feature-GPA relationship is well-suited to a linear model. This is an especially interesting result because it highlights the importance of feature engineering, where even simple models can produce strong predictions. However, the close performance of ensemble methods such as Gradient Boosting and XGBoost with R² scores of 0.798 and 0.796 respectively suggests their ability to learn complex interactions within the data.
Although we applied some of the most common ML models, such as Linear Regression and Gradient Boosting, future work could explore more complex models, including neural networks, during our research and tune them using hyperparameter search and/or statistical methods. This may allow for even higher-order interactions between cognitive and non-cognitive features, which may further improve predictive accuracy. Another comparison with such models can provide insights into what is the best modelling strategy for predicting academic success in various student populations.
Educational Implications
Important messages for both education practice and education policy, the findings of the study signal the contribution made by non-cognitive skills to academic success. However, with an awareness of the influence exerted by the skills, educators can more properly design focused interventions that build resilience, self-discipline, and goal-setting capabilities that may enhance academic performance. This analysis corroborates recent research in educational data mining that states that non-cognitive factors do not operate in isolation but in interaction in ways that form student outcomes.
One of the promising strategies in educational settings is to encourage students to combine various skills, such as setting goals and building resilience, toward meaningful academic and personal growth. The pragmatic translation of these findings includes resiliency workshops, goal-setting programs, and peer-led sessions that emphasize community involvement and leadership. These activities in non-cognitive skill building can be inculcated into the school curricula so that more students acquire the necessary skills that will help them all their lives.
These findings provide important lessons that can be used to inform educational practice and policy underlining the role non-cognitive skills might play in academic success. Appreciation of such influence allows educators to design specific interventions aimed at building resilience, self-discipline, and goal-setting-skills that may improve academic outcomes.
This analysis reflects findings on non-cognitive factors from recent work in educational data mining that suggests multiple non- cognitive factors do not operate independently but interact to drive student outcomes [6]. One exciting possibility for educational programs would be to facilitate student-led combinations of skills that could result in credible growth over time in not only the academic but also personal aspects of their lives [38]. Such a combination could be, for example, setting goals coupled with resilience-building. The findings might be used in designing workshops on building resilience, setting goals, and holding sessions led by peers to ensure more community involvement and leadership. Building activities into the curriculum that develop these non-cognitive skills helps the educational institutions develop the real building blocks of success-in school and out.
Limitations and Future Research
The unique strengths of the dataset available for this study are also noteworthy, including the availability of a reliable and valid questionnaire; however, limits associated with generalizability, specifically the single university population studied, should be noted. Future research should include a more diverse set of educational environments (e.g. high school or community college) and student populations of different socioeconomic statuses. Such expansion may be useful in ascertaining the degree to which relationships between non-cognitive features are stable across diverse academic settings, and thereby enhancing the generalisability of our model to educational institutions worldwide. A second consideration is the possibility of model bias, especially regarding underrepresented or disadvantaged student populations.
Machine learning models can unintentionally propagate biases found in the training data, resulting in a lack of equity in predictions for different student demographics. Fairness should be a major focus for future work to ensure models are inclusive and equitable. This can make use of methods such as fairness- aware machine learning, and post-modelling audits, for addressing biases, especially in interventions which may impact educational decisions and distributions of resources.
Conclusion
This present research underlines that non-cognitive characteristics are crucial in predicting the achievements of students, given the increasing performance of various machine learning models when feature engineering and interaction terms were added. The best R-squared score obtained for the Linear Regression model outlines once again the fact that even simpler models may become relevant if supported by well-engineered features. In this respect, the results of this study underpin the utility of some educational policies aimed at enhancing students' non-cognitive skills related to self-discipline, perseverance, and the community engagement in service activities that concurrently enhances academic performance also deserves consideration. Hopefully, future studies will extend this analysis into larger demographics to make such findings more generalizable and hence ensure the equity of educational interventions across different groups of students.
References
- XGarcia, E. (2016). The need to address non-cognitive skills in the education policy agenda. In Non-cognitive skills and factors in educational attainment (pp. 31-64). Brill.
- Gutman, L. M., & Schoon, I. (2013). The impact of non- cognitive skills on outcomes for young people. A literature review.
- Weissberg, R. P., Durlak, J. A., Domitrovich, C. E., & Gullotta, T. P. (2015). Social and emotional learning: Past, present, and future.
- Agarwal, A., & Arya, B. (2021). Role of Non Cognitive Skills in Academic Performance. PalArch's Journal of Archaeology of Egypt/Egyptology, 18(4), 5825-5837.
- Tucker, K. L., Hannan, M. T., Chen, H., Cupples, L. A., Wilson,P. W., & Kiel, D. P. (1999). Potassium, magnesium, and fruit and vegetable intakes are associated with greater bone mineral density in elderly men and women. The American journal of clinical nutrition, 69(4), 727-736.
- Iatrellis, O., Savvas, I. Κ., Fitsilis, P., & Gerogiannis, V.C. (2021). A two-phase machine learning approach for predicting student outcomes. Education and Information Technologies, 26, 69-88.
- Josephine, O. Y., Ayobami, A. J., & Abidemi, G. A. (2023). Framework for the Development of an Enhanced Machine Learning Algorithm for Non-Cognitive Variables Influencing Students’ Performance using Feature Extraction. Applied Science and Biotechnology Journal for Advanced Research, 2(4), 26-33.
- Scheuer, O., & McLaren, B. M. (2012). Educational Data Mining. In Encyclopedia of the Sciences of Learning (pp. 1075–1079). Springer US.
- Regha, R. S., & Rani, R. U. (2016). Optimization feature selection for classifying student in educational data mining. Int. J. Innov. Eng. Technol, 7(4), 490-496.
- Al-Sheeb, B. A., Hamouda, A. M., & Abdella, G. M. (2019). Modeling of student academic achievement in engineering education using cognitive and non-cognitive factors. Journal of Applied Research in Higher Education, 11(2), 178-198.
- Chiesi, F., & Primi, C. (2010). COGNITIVE AND NON-COGNITIVE FACTORS RELATED TO STUDENTS’STATISTICS ACHIEVEMENT. StatisticsEducation Research Journal, 9(1), 6-26.
- Kortteinen, H., Eklund, K., Eloranta, A. K., & Aro, T. (2021). Cognitive and nonâ?cognitive factors in educational and occupational outcomes—Specific to reading disability?. Dyslexia, 27(2), 204-223.
- Lee, K., Ning, F., & Goh, H. C. (2014). Interaction between cognitive and non-cognitive factors: the influences of academic goal orientation and working memory on mathematical performance. Educational Psychology, 34(1), 73-91.
- Sitjar, R. (2024). The Non-cognitive Skills and English Reading Competencies of Grade Two Students. Nexus International Journal of Science and Education, 1(1).
- Kour, S., Kumar, R., & Gupta, M. (2021, September). Analysis of student performance using Machine learning Algorithms. In 2021 Third International Conference on Inventive Research in Computing Applications (ICIRCA) (pp. 1395-1403). IEEE.
- Mengash, H. A. (2020). Using data mining techniques to predict student performance to support decision making in university admission systems. IEEE Access, 8, 55462-55470.
- Sokkhey, P., & Okazaki, T. (2020). Developing web-based support systems for predicting poor-performing students using educational data mining techniques. International Journal of Advanced Computer Science and Applications, 11(7).
- Cavanagh, A. J., Chen, X., Bathgate, M., Frederick, J., Hanauer,D. I., & Graham, M. J. (2018). Trust, growth mindset, and student commitment to active learning in a college science course. CBE—Life Sciences Education, 17(1), ar10.
- Farruggia, S. P., Han, C. W., Watson, L., Moss, T. P., & Bottoms, B. L. (2018). Noncognitive factors and college student success. Journal of College Student Retention: Research, Theory & Practice, 20(3), 308-327.
- Hudig, J., Scheepers, A. W., Schippers, M. C., & Smeets, G. (2023). Motivational mindsets, mindset churn and academic performance: The role of a goal-setting intervention and purpose in life. Current Psychology, 42(27), 23349-23368.
- McMahon, B. M., & Sembiante, S. F. (2020). Reâ?envisioning the purpose of early warning systems: Shifting the mindset from student identification to meaningful prediction and intervention. Review of Education, 8(1), 266-301.
- Cordero, J. M., Muñiz, M., & Polo, C. (2016). The determinants of cognitive and non-cognitive educational outcomes: empirical evidence in Spain using a Bayesian approach. Applied Economics, 48(35), 3355-3372.
- Duckworth, A. L., Peterson, C., Matthews, M. D., & Kelly,D. R. (2007). Grit: perseverance and passion for long-term goals. Journal of personality and social psychology, 92(6), 1087-1101.
- Humphries, J. E., & Kosse, F. (2017). On the interpretation of non-cognitive skills–What is being measured and why it matters. Journal of Economic Behavior & Organization, 136, 174-185.
- Vittadini, G., Sturaro, C., & Folloni, G. (2022). Non- Cognitive Skills and Cognitive Skills to measure school efficiency. Socio-Economic Planning Sciences, 81, 101058.
- Wanzer, D., Postlewaite, E., & Zargarpour, N. (2019). Relationships among noncognitive factors and academic performance: Testing the University of Chicago Consortium on School Research model. AERA Open, 5(4).
- Dong, G., & Liu, H. (Eds.). (2018). Feature engineering for machine learning and data analytics. CRC press.
- Khurana, U., Samulowitz, H., & Turaga, D. (2018, April). Feature engineering for predictive modeling using reinforcement learning. In Proceedings of the AAAI Conference on Artificial Intelligence, 32(1).
- Wang, Z., Xia, L., Yuan, H., Srinivasan, R. S., & Song, X. (2022). Principles, research status, and prospects of feature engineering for data-driven building energy prediction: A comprehensive review. Journal of Building Engineering, 58, 105028.
- Arlot, S., & Celisse, A. (2010). A survey of cross-validation procedures for model selection. Statist. Surv. 4, 40-79.
- Wong, T. T., & Yeh, P. Y. (2019). Reliable accuracy estimates from k-fold cross validation. IEEE Transactions on Knowledge and Data Engineering, 32(8), 1586-1594.
- Lynch, S. M. (2007). The Linear Regression Model. In Introduction to Applied Bayesian Statistics and Estimation for Social Scientists (pp. 165-192). New York, NY: Springer New York.
- Natekin, A., & Knoll, A. (2013). Gradient boosting machines, a tutorial. Frontiers in neurorobotics, 7, 21.
- Dhaliwal, S. S., Nahid, A. A., & Abbas, R. (2018). Effective intrusion detection system using XGBoost. Information, 9(7), 149.
- Xu, W., Zhang, J., Zhang, Q., & Wei, X. (2017, February). Risk prediction of type II diabetes based on random forest model. In 2017 third international conference on advances in electrical, electronics, information, communication and bio- informatics (AEEICB) (pp. 382-386). IEEE.
- Mi, X., Zou, B., Zou, F., & Hu, J. (2021). Permutation-based identification of important biomarkers for complex diseases via machine learning models. Nature communications, 12(1), 3008.
- Jain, P., Chhabra, H., Chauhan, U., Prakash, K., Samant, P., Singh, D. K., ... & Islam, M. T. (2023). Machine learning techniques for predicting metamaterial microwave absorption performance: a comparison. IEEE Access, 11, 128774-128783.
- Elamin, Khalid Abd El Mageed Hag. (2024). From Program Goals to Student Achievement: A Framework for Mapping and Weighting Course Learning Outcomes in Electrical Engineering Program. J Edu Psyc Res, 6(2), 01-10.


