
Journal of Electrical Electronics Engineering(JEEE)
ISSN: 2834-4928 | DOI: 10.33140/JEEE
Impact Factor: 1.2


Research Article - (2023) Volume 2, Issue 3
Physical Aspects of Chemical Carcinogenesis
Research Article J Electrical Electron Eng, 2023 Volume 2 | Issue 3 | 294-301; DOI: 10.33140/JEEE.02.03.11
Batyanov A.P*
Institute of General Pathology and Pathophysiology, Russia
*Corresponding Author : Batyanov A.P, Institute of General Pathology and Pathophysiology, Russia.
Submitted: 2023, July 03; Accepted: 2023, July 25; Published: 2023, August 22
Citation: Batyanov, A.P. (2023). Physical Aspects of Chemical Carcinogenesis. J Electrical Electron Eng, 2(3), 282-293.
Keywords:Chemical Carcinogenesis, 7,12-Dimethylbenz(α)anthracene, DMBA, Non-Chemical Carcinogen, Mitochondrial Phosphorylation, Mitochondrial Respiration.
Abstract
This study investigated the effects of chemical carcinogenesis induced by 7, 12-dimethylbenz (α) anthracene (DMBA) in mice. The respiratory activity of isolated mitochondria in mouse livers was investigated at various times after the subcutaneous administration of DMBA. Our findings indicated that DMBA derivatives did not exhibit damaging effects on mitochondrial membranes. On the contrary, they showed a stimulating effect on the phosphorylation process compared with the control. This paper discusses the possible role of coherent electromagnetic radiation in biological systems. Additionally, data on the non-chemical interactions between isolated mitochondria and the material (plexiglass and quartz) of the incubation cells were considered. Carcinogenesis was previously considered an exclusive process of biochemical and genetic disorders. However, recent studies have increasingly focused on the physical aspects of carcinogenesis, such as the influence of various wavelengths of electromagnetic radiation on biological systems, the special energy organization of the intracellular space associated with the architectonics of mitochondria and microtubules, and the generation of coherent electromagnetic waves. It was assumed that the biological features of the malignant cells were due to the violation of the electrodynamic parameters of the intracellular space, and the initiating factor was the intrinsic emission of carcinogenic substances. The results of this study indicated that non-chemical factors influenced the mitochondrial poly-enzyme system and confirmed the importance of the non-chemical effect of a carcinogen on bio-objects by examining respiration and phosphorylation of isolated mouse liver mitochondria at various times after the subcutaneous injection of DMBA.
1. Method
Outbred male mice weighing 220 ± 25–30 g were used in the experiments. One hundred and twenty mice were divided into three groups: control (untreated), subcutaneous sunflower oil (active control), and 0.5-0.7 mg 7,12-dimethylbenz(α)anthracene (DMBA) dissolved in sunflower oil. Liver mitochondria were isolated 1-4, 10-18, and 35 d after the administration of DMBA. The homogenate was centrifuged at 600 × g for 10 min and the supernatant at 14000 for 10 min. The mitochondrial precipitates were first resuspended in the isolation medium, then in 0.25 M sucrose and centrifuged twice at 14000 × g for 10 min. The isolation medium contained 0.5 M sucrose and 0.001 EDTA, pH 7.4. Mouse cells (1 ml) were incubated in plexiglass and fused quartz cells in an incubator. The rate of O2 consumption was measured using a Clarke oxygen electrode [3]. The incubation medium contained 0.15 M sucrose, 0.015 M KCl, 5ml M KH2PO4, and 2.5 M MgCl2, pH 7.4.
The dynamics of the optical density of the suspension (2 ml incubation medium, 3.5 mg mitochondrial protein, 0.2 μmol methylene blue, and 10 mM succinate) were determined using 620 nm wavelength, continuous transmission, monochromatic light. The spontaneous luminescence of empty incubation cells was determined using a photomultiplier PM-106 [1]. Low luminescence of the incubation cells was achieved by wrapping in photo paper and storing them in complete darkness for at least 14 d. Quartz cells were warmed at 120°С for 24 h.
The results did not indicate the inhibition of metabolic processes in mouse liver mitochondria due to the carcinogen. The rate of endogenous respiration in the mouse liver mitochondria exposed to DMBA was 42% higher than in the control.
Succinate substrate increased mitochondrial respiration in carcinogenic mice by 23% and glutamate by 26%. The phosphorylation rate increased by 15% after exposure to the carcinogen, and oxygen consumption during the phosphorylation period decreased by 8.5%. The rate of dissociated mitochondrial respiration under 2,4-dinitrophenol in the DMBA group increased by 34% compared with that in the control. The respiratory control ratio (RCR) differed significantly between the DMBA and control group with succinate or glutamate substrates; 3.2, 3.4, and 3.3 with succinate and 3.6, 3.8, and 3.4 with glutamate. When using glutamate + malate as a substrate, the RCR of the DMBA group increased by 20%.
Thus, the increased metabolism and stimulation due to the conjugating factors (high RCR, oxygen consumption during reduction of phosphorylation, and decreased ATPase activity) in the early stages of carcinogenesis indicate the involvement of carcinogenic molecules in regulating the level of interaction between the molecular substrate and cell organelles, suggesting a unified mechanism of activation associated with the general characteristics of mitochondrial membranes. As a result of this interaction, the generalized characteristics of the membranes may acquire new values. For example, increasing Δ μ̃ Η+increases the degree of deviation of the system from the equilibrium between the redox potential of the pair in the proton transferring portion of the chain\, i.e., there is an impact on the main factor in the regulation of respiration [2].
ADMBA metabolites are electrophilic reactive radicals. The addition of such substances to the mitochondrial membrane could ultimately increase the permeability of the membrane and decrease the number of protons transferred by ATP synthetase. The value of Δμ̃H+ decreases with an increase in the CmΗ+ membrane conductivity; therefore, the thermodynamic ability to synthesize ATP should decrease. However, this was not observed in our study. The non-chemiosmotic parameters of energized mitochondrial RCR, p/o, the magnitude of endogenous respiration) can be reduced to the value CmΗ+ [3]. Thus, the energization of mitochondrial metabolism is not determined by a local effect of the membrane they are attached to due to their donor-acceptor properties and electrophilic DMBA metabolites. This is a more rational interpretation of data on the stimulating effect of DMBA within the framework of the general theory developed in studies on “distant interactions” between spatially separated, non-equilibrium, excited electronic levels of certain chemical elements involved in the reaction [4]. Thus, the non-chemical interaction of DMBA molecules and mitochondria can be viewed as the interaction of two spatially separated electronically excited systems (outer electron shells of enzyme molecules of the electron transfer chain of mitochondria and zones K and L of DMBA molecules).
In the presence of high physical organization of the intracellular space (mitochondria and microtubule system of hollow waveguide resonators with zones of high charge density), the interaction occurs due to coherent electromagnetic radiation arising during electronic transitions in the valence zone. In the early stages, DMBA molecules may act as “catalysts” to create anomalous electronically excited states in poly-enzyme systems without forming strong chemical bonds, causing a polyfunctional carcinogenic activity [5].
| Substrate and condition Breath rate ng atoms O2/min/mg.mitochondrial protein | Control group | Active control group | DMBA group | % difference between DMBA and active control | P-value |
|---|---|---|---|---|---|
| 1 | 2 | 3 | 4 | 5 | 6 |
| Endogenous respiration | 3.6±0.2, n=66 | 4.6±0.3, n=46 | 5.2 ± 0.25, n=49 | 13 | 0.05 |
| Succinate 5mMV-0 | 11, 03±0.5, n=36 | 14.26±0.7, n=23 | 14.06±0.6, n=34 | -1.4 | 0.05 |
| Glutamate 5mM-V- | 3.7±0.5, n=16 | 4.2±0.5, n=10 | 6.0±0.35, n=12 | 42 | ≤ 0.01* |
| Glutamate 5mM+malate 5mMV-0 | 5.4±0.4, n=14 | 3.17±0.4, n=4 | 5.5±0.5, n=10 | 75 | ≤0.01* |
| Succinate 5mM+DF 0,2 μMV-3/1 | 38.4±1.6, n=36 | 48.91±2.1, n=23 | 47.6±1.15, n=33 | -2.7 | 0.05 |
| Glutamate 5 mM + ADP 0,2 µ MV-3/1 | 20.01±1.05, n=16 | 20.9±1,2, n=10 | 24.2±1.1, n=9 | 15.8 | 0.05 |
| Glutamate 5mM + malate 5mM + ADF 0,2µMV-3/1 | 27.1±2.4, n=14 | 22.3±1.2, n=5 | 24.9±1.7, n=8 | 11.7 | 0.05 |
| Succinate 5mMV- 4/1 | 12.9±0.5, n=36 | 14.1±0.6, n=23 | 16.2±0.7, n=33 | 14.9 | 0.05 |
| Glutamate 5mMV- 4/1 | 5.8±0.4, n=16 | 4.6±0.2, n=10 | 17.5±0.5, n=9 | 63 | ≤0,001* |
| 5mMGlutamate+malate5mMV-4/1 | 7.1±0.5, n=14 | 5.7±0.3, n=5 | 6.4±0.5, n=8 | 12 | 0.05 |
| Succinat5mM+ ADP 0,2µ MV-3/2 | 42.2±1.6, n=31 | 47.4±1.1, n=32 | 52.1±1.7, n=10 | 9.9 | ≤0.05* |
| Glutamate 5mM + ADP 0,2µMV-3/2 | 22.4±0.9, n=16 | 22.1±1.0, n=10 | 29.2±1.2, n=12 | 32.1 | ≤0.001* |
| Glutamate5mM+malate5mM+ADP 0,2µMV-3/2 | 27.4±1.7, n=14 | 23.7±1,5, n=5 | 26.2±1.9, n=10 | 10.5 | 0.05 |
| Succinate 5mMV-4/2 | 12.2±0.5, n=25 | 13,95 ±0.4, n=31 | 14.1±0.5, n=24 | 1.1 | 0.05 |
| Glutamate 5 mMV-4/2 | 6,9±0.6, n=16 | 6.2±0.4, 4n=10 | 8.8±0.4, n=11 | 41.9 | ≤0.001* |
| Glutamate 5mM+malate 5mMV-4/2 | 7.94±0.5, n=14 | 6.1±0.2, n=5 | 6.7±0.5, n=10 | 9.8 | 0.05 |
| Succinate 5 mm+DNF 0.1µ M | 47.7±3.3, n=12 | 53.6±2.3, n=18 | 73.1±3.3, n=20 | 36.4 | ≤0.001* |
| Glutamate 5 mM+DNF 0.1 µM | 25.7±1.9, n=11 | 25.7±1.7,n=9 | 31.5±1.2, n=9 | 22.6 | ≤0.05* |
| Glutamate 5mM+malate5mM+DNF 0.1 µM | 22.4±1.8, n=9 | 19,04±1.7, n=5 | 21.6±2.0, n=10 | 13.4 | 0.05 |
| Rate of phosphorylation of nmol ADP/min/mg.mitochondrial protein | |||||
| 1 | 2 | 3 | 4 | 5 | 6 |
| Succinate 5 mm+ADF 0.2.µM-3/1 | 87.4±3.2, n=36 | 87.8±3.0, n=31 | 98.06±2.5, n=36 | 11.6 | ≤0.01* |
| Glutamate 5mM+ADF 0.2µ MV-3/1 | 61.6±1.9, n=16 | 63.4±3.9, n=10 | 65.2±6.2, n=12 | 2.8 | 0.05 |
| Glutamate 5mM+malate 5mM+ADF 0.2µMV-3/1 | 88.96±9.3, n=14 | 66.3±6.0, n=5 | 76.2±7.0, n=10 | 14.9 | 0.05 |
| succinate 5mM +ADP0,0.2 µMV-3/2 | 94.4±2.5, n=30 | 93.3±3.3,n=31 | 112.6±4.8, n=24 | 20.7 | ≤0.01* |
| Glutamate 5mM+ADF 0.2µM V-3/2 | 69.2±3.2, n=16 | 65.8±3.9, n=9 | 71.99±3.6, n=12 | 9.4 | 0.05 |
| Glutamate 5 mM+malate 5 mM+ADF 0.2 μMV-3/2 | 81.4±5.4, n=14 | 67.4±4.0, n=5 | 80.6±6.0, n=10 | 19.6 | 0.05 |
| P/OSuccinate 5mM+ADP 0.2µM, V-3/1 | 2.3±0.1, n=36 | 1.96±0.04, n=31 | 2.1±0.1, n=36 | 7.1 | 0.05 |
| P/O Glutamate 5 mM+ADP 0.2 μM, V-3/1 | 3.2±0.1, n=16 | 3.04±0.1, n=10 | 2.5±0.15, n=12 | -17.8 | ≤0.01* |
| P/O Glutamate 5mM+malate 5mM+ADF 0.2 µMV-3/1 | 3.3±0.2, n=14 | 2.98±01, n=5 | 3.0±0.2, n=10 | 0.67 | 0.05 |
| P/O Succinate 5 mM+ADP 0.2 µMV-3/2 | 2.3±01, n=30 | 2.0±0.1, n=31 | 2.34±0.1, n=24 | 17 | ≤0.01* |
| P/O Glutamate 5mM+ADF 0.2 µMV-3/2 | 3.12±0.14, n=16 | 2.95±0.2, n=9 | 2.46±1.0, n=12 | 16 | 0.05 |
| P/O Glutamate 5 mM+malate 5 mM+ADF 0.2 μMV-3/2 | 2.99±0.14, n=14 | 2.84±0.1, n=5 | 3.044±0.1, n=10 | 7.2 | 0.05 |
| ATPase (by Lardy) | |||||
| 1 | 2 | 3 | 4 | 5 | 6 |
| Succinate ADP V-3/1 | 1.18±0.02, n=36 | 1.12±0.03, n=31 | 1.12+0.03, n=35 | --- | 0.05 |
| Succinat ADP V-3/2 | 1.02±0.04, n=25 | 1.04±0.04, n=41 | 1.06±0.03, n=25 | 1.9 | 0.05 |
| Glutamate ADP V-3/1 | 1.9±0.2, n=16 | 1.2±0.1, n=10 | 1.33±0.06, n=12 | 10.8 | 0.05 |
| Glutamate ADP V-3/2 | 1.2±0.06, n=16 | 1.4±0.1, n=10 | 1.16±0.1 | -17 | ≤0.05* |
| Glutamate+malateADP V-3/1 | 1.4±0.1, n=14 | 1.9±0.02, n=5 | 1.1±0.1, n=10 | -42 | ≤0.01* |
| Glutamate+malate ADP-V3/2 | 1.14±0.06 n=14 | 1.1±0.06, n=5 | 1.15±0.05, n=10 | -4.4 | 0.05 |
Table 1: Metabolic changes in mouse liver mitochondria after subcutaneous injection of DMBA.
Note. (V3/1): First addition of ADP; (V3/2): second addition of AD; DNF:addition of dinitrophenol, (V-4/1): relaxation after the first addition of ADP; (V-4/2): relaxation after second addition of ADP; (V-0): rest before first addition of ADP; n:number of experiments; *: P-value ≤ 0.0.
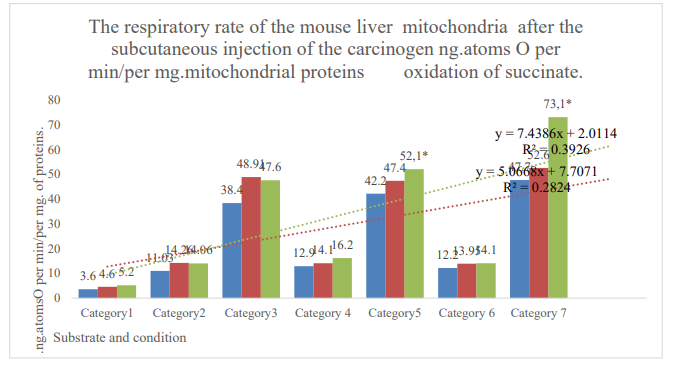
Figure 1: Categories 1: endogenous respiration; 2: substrate respiration (V-0); 3: first addition of ADP (V-3/1); 4: relaxation after first addition of ADP (V-4/1); 5: second addition of ADP (V-3/2); 6: relaxation after the second addition ADP (V-4/2); 7: addition of dinitrophenol (DNF). Blue column: control; orange column: active control; gray column: DMBA. *: zone of reliable difference between active control and DMBA. P≤0,05.
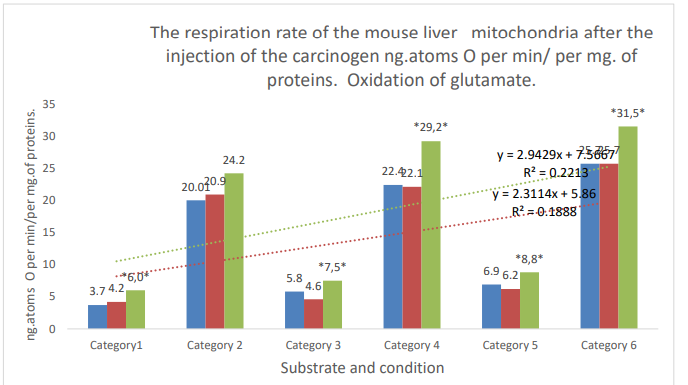
Figure 2: Categories. 1: substrate respiration (V-0); 2: first addition of ADP (V3/1); 3: relaxation after first addition of ADP (V-4/1); 4: second addition of ADP (V3/2); 5: (V-4/2) relaxation after second addition of ADP; 6: addition of DNF. Blue column: control; orange column: active control; gray column: DMBA; *: zone of significant difference between active control and DMBA. P ≤ 0,05.
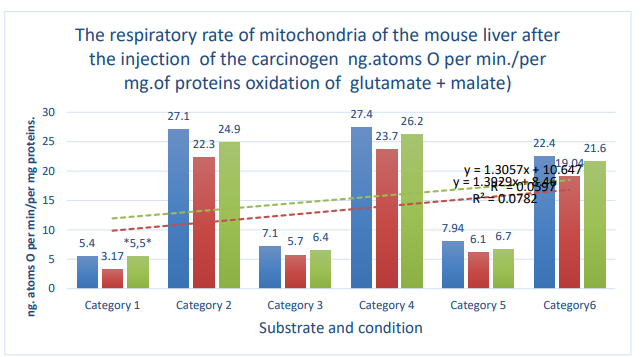
Figure 3: Column 1 (blue): control; column 2 (orange): active control; column 3 (gray):DMBA. Categories. 1: substrate respiration (V-0); 2: first addition of ADP (V-3/1); 3: relaxation after first addition of ADP (V-4/1); 4: second addition of ADP (V-3/2); 5: relaxation after second addition of ADP (V- 4/2); 6: addition of DNF; *: zone of significant difference between active control and DMBA. P ≤ 0.05 .
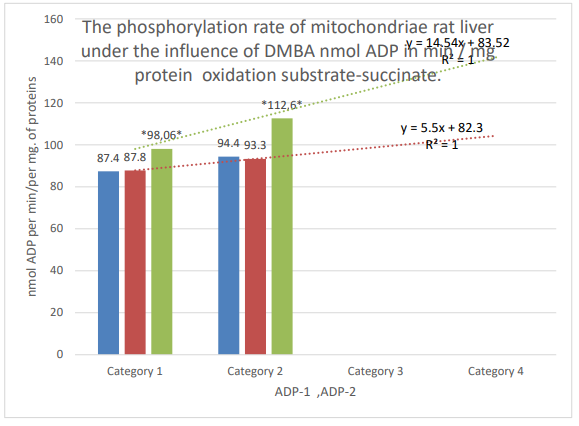
Figure 4: Column 1 (blue): control; column 2 (orange): active control; column 3 (gray): DMBA. Categories. 1: the first addition of ADP; 2: second addition of ADP; * the zone of significant difference between active control and DMBA, P ≤ 0.05.
The "distant" interaction non-equilibrium, excited electronic systems, consider the effect on mitochondria of fused quartz and polymethyl methacrylate (plexiglass), substances used in experimental oncology for inducing tumors.
Determined the respiration rate of rat liver mitochondria at 6 h after isolation in 15 16 from a single mouse liver mitochondrial preparation using both quartz and plexiglass incubation cells and found that they exhibited opposite tendencies in the rate of oxygen absorption during the period of phosphorylation and substrate respiration. The mitochondrial respiration rate in quartz cells after the first addition of 0.2 ?mol ADP was determined at 6 h. Storage of the drug, the regression coefficient for the linear approximation was ?=0.004, A=29.98 with the number of samples n=94 from various mitochondrial preparations and average speed (V-3/1)=29.5±0.6. With a second addition of 0.2? mol ADP in a quartz cell, ?=0.002. A=27.8, n=86 and average speed (V-3/2)=27.5±0.7. For similar indicators in plexiglass cells, the regression coefficients were.=0.021, A=37.12 with n=256, and average speed (V-3/1)=39.9±0.9 and?=0.0006. A=37.1 with n=244 and average speed (V-3/2)=37.2±0.5. With successive registrations of the rate of substrate respiration for 6 h of storage of the preparation of mitochondria when using incubation cells from quartz, the regression coefficient was.=0.0043, A=11.3, n=148 and average speed (V-0)=10.01±0.8. Using plexiglass cells?=0.00 73, A=11.1, n=285, and average speed V-0 (rest)=12,1 ± 0,3. During the incubation of mitochondria (3.5 mg protein+5 mmol succinate+0.2 µmol ADP) in plexiglass cells, the aerobic phase was 8.3±0.2 min, and in quartz cells, 9.8±0.4 min. For dissociated mitochondrial respiration (3.5 mg protein+5 mmol of succinate + 0.1 ?mol DNF), the values were 6.3 ± 0.4 min, and 8.03 ± 06 min for plexiglass and quartz, respectively.
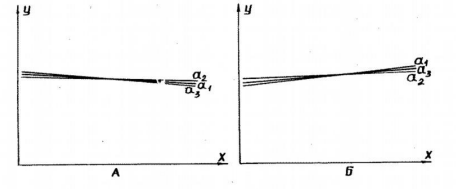
Figure 5: Dependence of respiration rate of rat liver mitochondria on time (the duration of storage of mitochondrial preparation), presented as regression lines.
A: quartz cells; B: plexiglass cells.
a1: dependence of respiration rate of mitochondria in V-3/1 state (first addition of ADP);a2: dependence of respiration rate of mitochondria in V-3/2 state (second addition of ADP);
a3: dependence mitochondrial respiration rate in state V-0 (rest, for first addition of ADP). Regression formula Y = A + ß X. X-axis: time; Y-axis: mitochondrial respiration rate.
Table 2 shows mitochondrial metabolism data measured during the first 3 h of storage of the drug. The time interval between comparing samples from a single mitochondrial drug was not more than 15 min. In Table 2, a mandatory condition was uniform daylight during the mitochondrial incubation process. The metabolism indicators in mitochondria incubated in quartz cells, exhibit characteristic features (Table 2).
•Linear reduction oxygen consumption rate during incubation; V-4/1 (relaxation after first addition of ADP) ≤ V-0 (rest before the first addition of ADP); V-4/2 (relaxation after second addition of ADP) ≤ V-4/1. Similar values during incubation of mitochondria in plexiglass cells did not change significantly.
•Reduced response to stimulation supplements of substrates compared to similar values using plexiglass cells.
•Reduced volume of O2 to phosphorylation at the same rate in plexiglass and quartz cells.
•Increased aerobic phase.
| Substrate and condition | Respiration rate in mitochondria ng.atom O2 per min/mg protein | % Difference | P-value | |
|---|---|---|---|---|
| Quartz | Plexiglass | |||
| Endogenous respiration | 4.3±0.2, n=77 | 4.3±0.3, n=40 | --- | --- |
| Oxidation of succinate 5 mM (V-4/0) | 11.4±0.5, n=100 | 10.3±0.6, n=38 | 9.6 | ≥0.05 |
| ADP 0.2 µM (V-3/1) | 28.9±1.1, n=52 | 32.9±0.2, n=32 | 13.8 | ≥0.01 |
| relaxation (V4/1) | 8.4±0.6, n=51 | 9.8±0.4, n=32 | 16.7 | ≤0.05* |
| ADP-0.2 μM (V3/2) | 28.3±0.1, n=48 | 35.8±0.5, n=29 | 26.5 | ≤0.001* |
| relaxation (V4/2) | 6.5±0.3, n=45 | 8.6±0 6, n=22 | 32.3 | ≤0.01>* |
| DNF 0.1 µM (dinitrophenol) | 31.9±0.5, n=31 | 51.9±0.8, n=38 | 62.7 | ≤0.05* |
| The phosphorylation rate ofnmolADP/min/mg protein | ||||
| ADP 0,2 μM (V3/1) | 58.4±2.5, n=54 | 59.9±2.5, n=47 | 1.5 | ≥0.1 |
| ADP 0.2 μM (V3/2) | 52.2±4.0, n=49 | 52.2±2.4, n=32 | --- | --- |
| P/O (V3/1) | 2.06±0.08, n=54 | 1.7±0.08, n=47 | 17.5 | ≤0.01* |
| P/O(V3/2) | 1.9±0.1, n=49 | 1.3±0.1, n=32 | 31 | ≤0.001* |
Table 2: Metabolism indicators of rat liver mitochondria incubated in quartz and plexiglass cells.
Note.(V3/1): Rest before first addition of ADP ;( V3/1): first addition of ADP; (V3/2): second addition of ADP; (V-4/1): relaxation after first addition of ADP; (V- 4/2): relaxation after second addition of ADP; n: number of experiments; *: P-values ≤ 0.05.
In addition to the correlation of the metabolism of isolated mitochondria on the material of incubation cells, we considered the effect on the metabolic indices of factors such as the level of spontaneous luminescence of the material of the incubation cells (i.e., their photoexcitation level from uniform daylight, determined before is placing mitochondrial suspension) [6].
As shown in Figs. 6,7,8,9, there is a significant correlation between mitochondrial metabolism and the luminescence intensities of empty incubation cells. Thus, during the incubation of mitochondria in plexiglass cells with a low level of luminescence, changes in the metabolism of mitochondria were observed, with a general tendency toward a decrease in the rates of oxygen consumption and phosphorylation. The duration of the aerobic phase was increased to 10.7 min. Variations in mitochondrial metabolism, correlated with the luminescence levels of the incubation quartz and plexiglass cells, were oppositely directed. The duration of the aerobic phase in quartz cells with a low level of luminescence remained unchanged-indicators of mitochondrial metabolism in plexiglass cells with a high level of luminescence corresponded to the control.
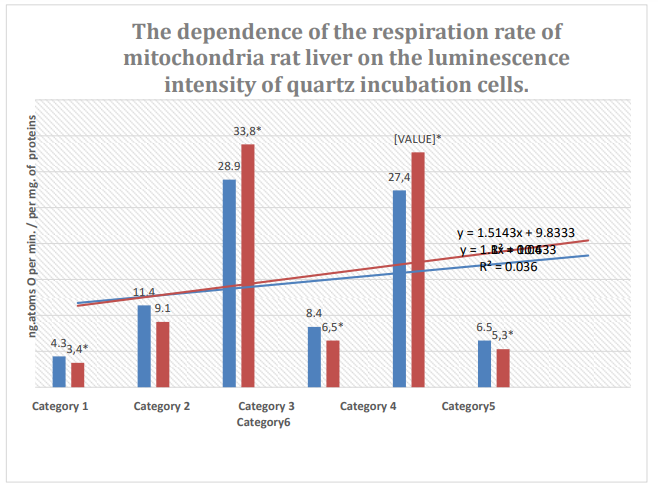
Figure 6: Column 1: Respiration rate of mitochondria during incubation in quartz cells with 61% spontaneous background luminescence.
Column 2: Respiration rate of mitochondria during incubation in quartz cells with 12% spontaneous background luminescence.
Categories: endogenous respiration; 2: substrate respiration (V-0); 3: first addition of
ADP (V-3/1); 4:relaxation after first addition of ADP (V-4/1); 5: second addition of ADP (V-3/2); 6: relaxation after second addition of ADP (V-4/2); substrate: succinate oxidation; *: zones of confidence between columns 1 and 2, P ≤ 0.05.
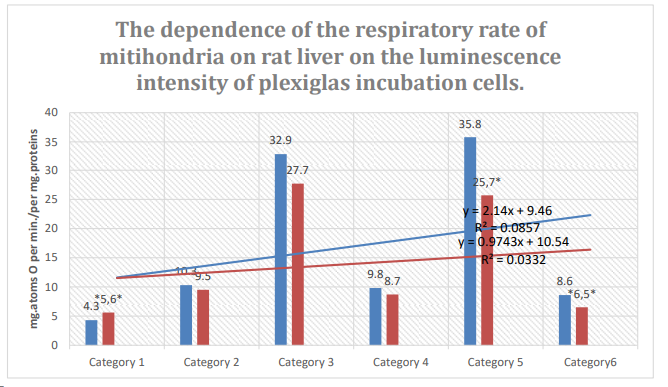
Figure 7: Column 1: Respiration rate of mitochondria incubated in pexiglass shows 63% spontaneous background luminescence.
Column 2: Respiration rate of mitochondria incubated in plexiglass cells with 18% spontaneous background luminescence.
Categories. 1: endogenous respiration; 2: substrate respiration (V-0); 3: first addition of ADP (V-3/1); 4: relaxation after first addition of ADP (V-4/1);. 5-:second addition of ADP (V-3/2); relaxation after second addition of ADP (V-4/2); substrate: succinate oxidation; *: zones of confidence between columns 1 and 2, P ≤ 0.05.
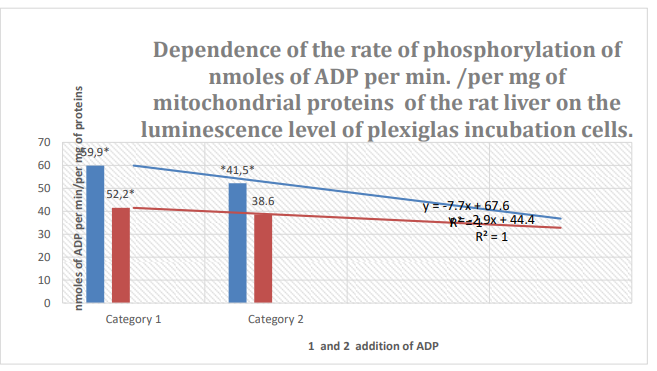
Figure 8: Column 1: Rate of phosphorylation of nm ADP/min/mg mitochondrial protein in mouse liver during incubation in plexiglass cells with63% spontaneous background luminescence.
Column 2: Rate of phosphorylation of nm ADP/min/mg mitochondrial protein in mouse liver during incubation in plexiglass cells with18% spontaneous background luminescence.
Categories 1-2: 1 and 2 addition of ADP; substrate: succinate oxidation; *: zones of confidence between columns 1 and 2, P ≤ 0.05.
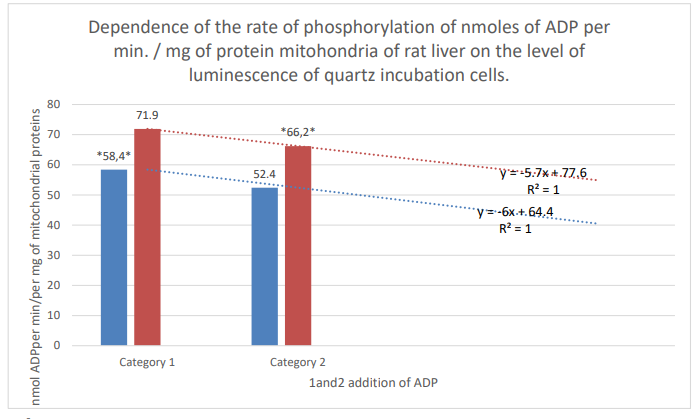
Figure 9: Column 1: Rate of phosphorylation of nm ADP per min/mg of mitochondrial proteins of mouse liver during incubation in quartz cells with 61% spontaneous background luminescence.
Column 2: Rate of phosphorylation of nm ADP/min/per mg mitochondrial proteins of rat liver during incubation in quartz cells with 12% spontaneous background luminescence.
Categories 1-2: additions of ADP; substrate: succinate oxidation; *: zones of confidence between rows 1 and 2, P ≤ 0.05.
Additionally, there was a significant difference in the optical density of the suspension of mitochondria in the anaerobic phase, incubated in energetically different cells of the same material (Figs. 10, 11). The dynamics of the optical density of a suspension of mitochondria incubated in plexiglass cells with a low level of intrinsic luminescence differed significantly during the incubation of mitochondria under the same conditions in the same cell with a higher level of luminescence. The ?T in the anaerobic phase reached 30%. A comparison of curves 1 and 2 in Fig. 10 shows the inconsistency of the rate of mitochondrial "swelling" and respiration rates in cells with low luminescence. Similar to the cases presented in Table 2, the reactions of mitochondria incubated in quartz and plexiglass cells with low intrinsic luminescence are oppositely directed.
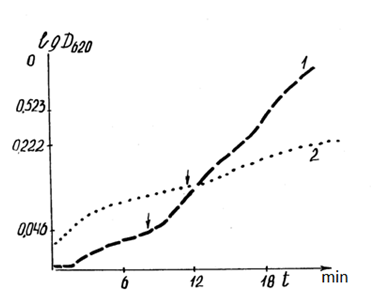
Figure 10: Correlation of dynamics of optical density (DOP) of mitochondrial suspension (2 ml of the incubation medium + 3.5 mg of mitochondrial protein + 0.2 μmol of methylene blue + 10 mM succinate) with the energy parameters (luminescence level) of the incubation cells.
1: DOP mitochondrial suspension in quartz cells with 12% background luminescence before incubation; 2: DOP mitochondrial suspension in plexiglass cells with 5% background luminescence before incubation. The ordinate axis is the optical density. The abscissa is time in min. The arrow marks the beginning of the anaerobic phase during the incubation process.
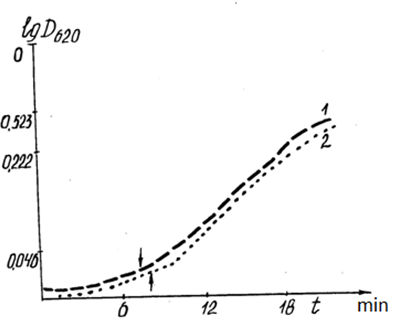
Figure 11: Correlation of the dynamics of optical density (DOP) of the mitochondrial suspension with the energy parameters (luminescence level) of the incubation cells.
1: DOP mitochondrial suspension in quartz cells with 60% background luminescence before incubation; 2:DOP mitochondrial suspension in plexiglass cells with 63% background luminescence before incubation.
Results
Thus, the results indicated the dependence of mitochondrial metabolism on the material and the luminescence level of the incubation cells [7]. Functional changes in mitochondrial metabolism may be modified by non-thermal coherent electromagnetic radiation in the system (quartz or plexiglass structure + incubation medium with oxidation substrates and molecular O2 + mitochondria), consistent with the previously expressed considerations on the fundamental possibility of such a regulation mechanism in biosystems [8,9]. The data also indicated the possibility of non-chemical interactions between the carcinogen and the enzyme regulators of the mitochondrial cycle of the "distant interaction" of non-equilibrium-excited electronic systems, that is, the interaction of the system of -electrons of the active zones of the carcinogen molecule and enzymes due to coherent radiation [10-12].
Declarations
Ethical Approval
Institutional Review Board Statement: The study was conducted according to the guidelines of the (DIRECTIVE 2010/63/EU OF THE EUROPEAN PARLIAMENT AND OF THE COUNCIL on the protection of animals used for scientific purposes of 22.09.2010.), and approved by the Institutional Ethics Committee of the Institute of General Pathology and Pathophysiology (final protocol # 1 of 01.02.2023.)
Competing Interests
Informed Consent Statement: Informed consent was obtained from all subjects involved in the study.
Authors Contributions
Inadaptability.
Funding
This research received no external funding.
Availability of Data and Materials
Data Availability Statement
The data presented in this study are available on request from the corresponding author
References
- Batyanov, A., P. (1988). T.33.-Vol Correlation of mitochondrial metabolism and spontaneous luminescence of incubation cells. Biophysics 6 1029.
- Ilnitsky A P, Mishchenko B G A, Vinnikova V S and Butenko N V R. G. (1984). Carcinogenic Hydrocarbons as Growth Promoters. Reports of the Academy of Sciences of the USSR t 274 , №1 pp 216-21.
- Kondrashova, M., N. and Ananenko, A., A. (1973). Inspection of the state of isolated mitochondria. Guidelines for the study of biological oxidation by the polarographic method. -M. (Nauka) p 93-105.
- Frohlich, H. (1977). T .22 Coherent excitation antibiological systems. Biophysics.(vol 4) p743-746
- Frohlich, H. (1983). Coherent excitations in biology Coherence in biology. Berlin-Heidelberg-New (York: Springer).
- Frezza Gande, E. and Defectc, C., Jack, Kruse. (1982). Time #19: Is Time Told by Biophoton Emission 11.08.2016 mitochondrial metabolism and cancer Cancer Metab. 2014. Jul.17 2 8. D.G Nicholls Bioenergetics an introduction to the chemiosmotic theory Academic Press.
- Penta, J. S., Johnson, F. M., Wachsman, J. T., & Copeland, W. C. (2001). Mitochondrial DNA in human malignancy. Mutation Research/Reviews in Mutation Research, 488(2), 119-133.
- Popp, F. A. (1989). Photon storage in biological systems. Electromagnetic bio-information, 123-149
- Pokorný, J., Vedruccio, C., Cifra, M., & Kučera, O. (2011). Cancer physics: diagnostics based on damped cellular elastoelectrical vibrations in microtubules. European Biophysics Journal, 40, 747-759.
- Pokorný, J. (2011, December). Electrodynamic activity of healthy and cancer cells. In Journal of Physics: Conference Series (Vol. 329, No. 1, p. 012007). IOP Publishing.
- Rahnama, M., Tuszynski, J. A., Bokkon, I., Cifra, M., Sardar, P., & Salari, V. (2011). Emission of mitochondrial biophotons and their effect on electrical activity of membrane via microtubules. Journal of integrative neuroscience, 10(01), 65-88.
- Sung, S. S. (1989). A possible Bio-photochemical Mechanism for Cell Communication. Electromagnetic Bio-Information, Urban & Schwarzenberg, Berlin, 168-181.
Copyright:
Copyright: ©2023 Batyanov A.P. This is an open-access article distributed under the terms of the Creative Commons Attribution License, which permits unrestricted use, distribution, and reproduction in any medium, provided the original author and source are credited.