
Journal of Investment, Banking and Finance(JIBF)
ISSN: 2997-2256 | DOI: 10.33140/JIBF
Impact Factor: 0.92

Research Article - (2025) Volume 3, Issue 1
Factors Affecting Mobile Money Usage in Ghana
Received Date: Nov 13, 2024 / Accepted Date: Apr 17, 2025 / Published Date: Apr 25, 2025
Copyright: ©Â©2025 Charles Aaron Adams Ekuban, et al. This is an open-access article distributed under the terms of the Creative Commons Attribution License, which permits unrestricted use, distribution, and reproduction in any medium, provided the original author and source are credited.
Citation: Ekuban, C. A. A., Omar, F. S. (2025). Factors Affecting Mobile Money Usage in Ghana. J Invest Bank Finance, 3(1), 01-12.
Abstract
This study delves into the factors that influence the utilization of mobile money services and their impact on human livelihoods in Ghana. The theoretical framework employed was the Technology Acceptance Model (TAM), and the data used were validated through factor and regression analyses. A structured questionnaire was used to collect data from 385 mobile money users in Ghana, selected through purposive and Simple Random sampling approaches from the central and western belts of the country. The study found that consumers' likelihood of using mobile money services was significantly influenced by their perceived usefulness (PU), ease of learning (PEOU), and ease of use (PEOU), with PUF having a less significant impact on usage. The study concluded that the usage of mobile money services was significantly affected by perceived usefulness (PU), ease of learning (PEOL), and ease of use (PEOU), but PEOU had a less significant effect on usage. The study also found that mobile money usage has greatly impacted human subsistence by promoting financial inclusion for the unbanked, increasing remittance flows, and providing access to other financial services.
Keywords
Mobile Money, Human Subsistence, Unbanked, Remittances, TAM
Abbreviations
TAM: Technology Acceptance Model
PEOU: Perceived Ease of use
PU: Perceived Usefulness
PS: Perceived Satisfaction
PEOL: Perceived ease of learning.
RAMMU: Rate of Acceptance of Mobile Money Usage
KMO: Kaiser-Olkin-Measure
ITU: International Telecommunication Union
GSMA: Groupe Speciale Mobile Association
MNO: Mobile Network Operators
MMS: Mobile Money Service
Introduction
The evolution of technology has resulted in a substantial transition from landline telephones to mobile phones, boasting over 3.6 billion unique subscribers by the conclusion of 2014. The advent of mobile money services holds the promise of aiding developing nations in shifting towards more streamlined economic systems. Traditionally, the transfer of money has presented challenges, particularly in rural areas [1]. The proliferation of mobile money services is evident, with 299 million registered accounts globally spanning Africa, Asia, Latin America, Europe, and the Middle East, as reported by the Groupe Speciale Mobile Association.
Again, the Global System for Mobile Communications Association (GSMA), 2022 report indicates that in threequarters of the markets where mobile money is available, agent outlets surpass the number of bank branches. As outlined by (Chauhan, 2015), the primary goal of mobile money is to facilitate person-to-person and person-to-merchant transactions through mobile phones, thereby eliminating the need for traditional bank accounts. In Ghana, the telecommunications industry has capitalized on this by expanding services beyond mere money transfers to include linking networks with bank accounts for utility bill payments, airtime or data bundle top-ups, international money transfers, microloans, savings products, and bank deposits and withdrawals. Mobile money is a financial service that enables customers to store, transmit, and receive money using their mobile phones, avoiding the need for conventional banking infrastructure. It offers various financial services such as money transfers, payment of utility bills, and mobile credit top-ups. Mobile money services are provided by mobile network operators and are a convenient, secure, and cost-effective way to manage money. The ubiquity of mobile phones has created opportunities to enhance the lives of millions of unbanked people. Studies have shown that mobile money services can help households receive more remittances, manage consumption during economic shocks, and improve their lives. [2,3]. The IFC released a report on the potential of mobile money services to reduce poverty. The report stresses the role of mobile money services in promoting financial inclusion, offering access to financial services for individuals who would otherwise lack such opportunities However, the success of mobile money services hinges on widespread acceptance and usage by citizens, as the lack of acceptance may render such services futile [4]. Hitherto, people have had some negative sentiments regarding the use of mobile money services. Many people still complain of losing money through theft and other unwholesome means, which would not have happened if they had resorted to the use of mobile money services to keep their money.
With the rising use of mobile money services, it is imperative to investigate the factors influencing the acceptance of the use of mobile money services, which shows this trend.
A recent study focused on applying a technology acceptance model to identify the variables impacting Ghanaian consumers' decision to continue using mobile money services for transactions. This study examines how perceived risk, cost, social influence, usefulness, and ease of use affect consumers' decisions to continue using mobile money services in Ghana. These attitudes included perceptions of danger, cost, social impact, perceived utility, and simplicity of use. [5]. Conversely, this study examines the variables that influence mobile money usage, and how they impact people's ability to survive in Ghana.
This study explores the factors that impact the acceptance of mobile money services with an emphasis on enhancing individuals' livelihoods. "What factors influence the usage of mobile money services, and to what extent do perceived usefulness, perceived ease of use, perceived ease of learning, and perceived satisfaction contribute to the adoption and utilization of mobile money services?" To answer these questions, we formulated the following hypothesis:
a. H0 : Perceived usefulness does not positively affect mobile money service usage.
H1 : Perceived usefulness positively affects mobile money service usage.
b. H0 : Perceived ease of use does not positively affect mobile money service usage.
H1 : Perceived ease of use positively affects mobile money service usage.
c. H0 : Perceived ease of learning does not positively affect mobile money service usage.
H1 : Perceived ease of learning positively affects mobile money service usage.
d. H0 : Perceived satisfaction does not positively affect mobile money service usage.
H1 : Perceived satisfaction positively affects mobile money service usage.
Motivation and Purpose
Mobile money services have seen a significant increase in many developing countries worldwide, but the situation in Ghana is not different. People still complain of losing money through theft and other unwholesome means, which would not have happened if they had resorted to using mobile money services to keep their money. The presence of mobile money services provides opportunities and possibilities for improving the lives of millions, especially those who are unbanked; however, its success can be achieved only if it is accepted by citizens, as a lack of acceptance may render such services fruitless [2,3].
Mobile money services are still a rapidly emerging area of research in developing countries and have the potential to improve subsistence. To this end, we focus on the following: (a) To determine the factors affecting the wide usage of mobile money service Specifically, we hypothesized that perceived usefulness, perceived ease of use, ease of learning, and satisfaction positively affect mobile money service usage.
Literature Review
Mobile money services in Ghana, introduced by the MTN in 2009, are expected to grow rapidly, as more resources are channelled to educate subscribers to adopt electronic payments instead of traditional cash transactions. The value of mobile money transactions has increased significantly, accounting for over one-third of the total deposit liabilities of the 28 banks. The Bank of Ghana is ready to implement new regulations for mobile money payment systems in order to grow the sector and increase mobile transactions. the International Telecommunication Union telecommunication standardization sector report showed that 16 % of adults used mobile media for more than 12 months to receive or send money or pay bills in 2011. The central bank's strategic payments roadmap aims to promote a cashless economy and enhance existing payment systems in Ghana.
Dennehy and Sammon's research focuses on the contingency theory of technology adoption, highlighting the significance of the extrinsic variables of cultural, social, and economic factors in determining the rate at which consumers adopt mobile payment. They use contingency theory, which helps explain why mobile payment services are available in various nations. For example, in Kenya, mobile payments are made through SMS technology, whereas in other countries, QR codes or NFC technology are used. This variation can be attributed to disparities in the payment technology infrastructure, regulations, laws, or societal customs of the respective countries. The fundamental premise of this theory is that there is no singular optimal approach or technique that can be equally effective in all circumstances.
Jaradat and Mashaqba conducted a study titled "Understanding the adoption and usage of mobile payment services using (TAM 3)” to examine the main elements that influence customers' motivation to learn and transition to mobile payments. To ascertain the level of receptiveness to adoption, we gathered data from 475 undergraduate students in Jordan. The findings indicate that the rate at which individuals adopt something is influenced by various aspects including perceived usefulness, perceived ease of use, image, output quality, subjective norms, perception of external control, self-efficacy, and playfulness.
The study found that mobile service provider characteristics and mobile technology environment features are two factors that contribute to trust in mobile payments when analyzing customer trust. According to these findings, the significance of customer trust in mobile payments surpasses that of other criteria related to technology adoption. A study conducted in Singapore on the adoption of m-payment systems revealed that consumer trust plays a paramount role compared to other aspects that influence technology adoption. Park et al. (2018) conducted a study of 457 participants to investigate how perceived risk, rewards, and trust influence customers' inclination to utilize mobile payments. Furthermore, the researchers analyzed the impact of various demographic variables, such as age, income, and education, in addition to the parameters listed above. The findings of this study demonstrate that trust plays a mediating role in influencing consumers' desire to use payment services. Furthermore, the findings also indicated that education played a role in shaping the connection between perceived risk and intention as well as trust and intention to utilize mobile payments. Shen and Yazdanifard noted that obstacles to the advancement of mobile payments include expenses, network effects, intricacy, and security concerns. A qualitative study investigating consumer uptake of mobile payments revealed that the adoption of mobile payments is influenced by various situational factors such as the absence of alternative payment methods or time sensitivity. Additionally, obstacles to adoption include high pricing, complexity, insufficient user base, and perceived risks.
A recent study examined consumer perceptions and the uptake of mobile payments in India. Over the past decade, studies have endeavored to investigate aspects that could potentially influence Indians’ intentions to adopt mobile payments. However, further research is necessary in the Indian context to generalize these findings.
According to (Lai, 2016), the struggle between rapid technological change and inherent barriers to the acceptance of new goods or services affects the development of payment systems. [6]. Theories such as the diffusion of innovations, tasktechnology fit, reasonable action, planned behavior, and the Technology Acceptance Model (TAM) have been proposed to explain why consumers accept new technologies. [7,8].
In 1989, Davis used the TAM to explain computer usage behavior, as shown in Figure 1. Davis’ (1989) TAM aimed to explain the general determinants of computer acceptance that lead to explaining user behavior across a broad range of end-user computing technologies and user populations [9]. The basic TAM included and tested two specific beliefs: perceived usefulness (PU) and perceived ease of use (PEOU). Perceived usefulness is defined as the potential user’s subjective likelihood that the use of a certain system (e.g., a single-platform e-payment system) will improve his or her action. Perceived ease of use refers to the degree to which the potential user expects the target system to be effortless [5,9]. A person's belief in a system may be influenced by other factors referred to as exogenous variables in the TAM.

The primary finding that both perceived usefulness and perceived ease of use directly affect intention to use, eliminating the need for the attitude construct, prompted Venkatesh and Davis (1996) to develop a final version of the TAM [10,11]. (Dorcas Tandoh, 2016) investigated the variables influencing mobile money adoption in Ghana using structural equation modelling. According to the findings, 64% of respondents were male and 36% were female. Most of them were between the ages of 18 and 24. The study discovered that behavioral intention supported consumer usage behavior, whereas performance expectancy effort expectancy, social influence, hedonic incentives, and price value strongly influenced consumers' behavioral intention to embrace mobile money.
Mobile money usage has significantly impacted subsistence, especially in developing countries where traditional banking services are limited. This has enabled financial inclusion, improved remittances, and enhanced entrepreneurial and agricultural activities. It has also facilitated the growth of small businesses, provided secure transactions, and provided savings and insurance products to people. Mobile money services also offer access to credit, reduced corruption, and job opportunities in areas such as customer service, mobile money agent networks, and software development. However, challenges such as limited network coverage, lack of digital literacy, and concerns about security and fraud must be addressed to fully realize its potential for improving livelihoods.
X1: Perceived usefulness is the degree to which an individual believes that using a specific system will improve performance. In a broader sense, PU refers to how well users believe that mobile money services can be integrated into their daily activities to improve transactions. Consumers' intention to use mobile money services increases when this belief is internalized. Its construction was evaluated using eight criteria: it has improved my daily performance; it makes the tasks I want to complete easier to complete; it meets my needs; it does everything I expect it to do; it helps me be more productive; and it saves me time when I use it. It improves my effectiveness and efficiency in my daily life and it is beneficial.
he concept of perceived usefulness (PU) has been extensively studied in consumer behavior research as a key factor influencing consumers’ intention to adopt mobile services. When consumers believe that the inherent mobility and enhanced accessibility features of mobile services outperform traditional transaction methods in terms of efficiency and convenience, they have a significant impact on their perception of their usefulness. Finally, the perception that mobile money services provide tangible utility is the primary driving force behind their widespread adoption.
X2: Perceived ease of use is the belief that using a particular system is effortless. The degree to which a person thinks utilizing a specific system would be effortless is known as perceived ease of use, which comprises registration processes, user-friendly payment processes, simple access to customer service, a few steps needed to complete a payment, adequate screen size, and input capabilities in mobile money services. The availability of mobile service agents makes them easier to use. Additionally, they must be usable on mobile devices with fundamental hardware and software. Ten criteria, including ease of use, simplicity, userfriendliness, efficiency, adaptability, effortless usage, intuitive operation without written directions, ease of error recovery, and a success rate that is consistent for both infrequent and frequent users, constitute the PEOU assessment.
X3: Perceived ease of learning is the degree to which a person thinks that a certain system is simple to understand in terms of how to utilize it and the processes and procedures involved in operating the system. When a technology is simple to learn and comprehend, consumers will use it. Four factors make up PEOL: I picked up how to use it immediately, and I was able to remember it with ease. It was simple to learn how to operate and I quickly became proficient.
X4: Perceived satisfaction refers to how a person perceives a certain system as being more advantageous and, as a result, becomes content to utilize it. Five factors comprised the PS score: I would recommend it to a friend, I need it, I am happy with how it works, and it is fantastic and enjoyable to use
Research Methodology
This study utilized primary data sources to address this research problem. Purposive sampling was employed to capture the study areas, and simple random sampling was used to sample 385 mobile money service users. Microsoft Excel was used to organize and store the data, and JASP and SPSS (version 26) were used for analysis. Our methodology and analysis involved a questionnaire comprising 57 items, including 35 testing variables, LIKERT scale variables, and 12 items related to demographic variables. Cronbach's alpha test was conducted on 27 items. This paper is an extract of my MSc thesis, which used a Google sheet survey method of collecting data and did not have direct contact with respondents.
Our study focused on mobile money users in Sekondi-Takoradi and Cape Coast in Ghana's Western Belt and Central regions, respectively. We selected these areas based on factors such as demographics, accessibility, cost-effectiveness, and the availability of field data collection personnel. The intended audience was assured that the research findings would be precise, trustworthy, and applicable. Currently, there are 20.4 million active mobile money users are spread across 16 regions in Ghana [5]. Using an equal distribution of users, the number of users per region can be calculated as follows:
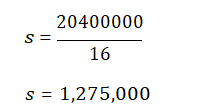
The total population of the study was 2,550,000 because it spans two areas.
Cochran’s equation was used. According to Cochran ( 1977), the following sample size calculation accurately represents the user population [12]:
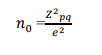
where:
• where e denotes the desired precision level.
We used e = 5% (i.e., the margin of error)
• p is the (estimated) proportion of the population with attribute in question. Here, we assume that 50% of users are using mobile money services. (p = 0.5)
• q is 1–p. Here, q was 1–0.5.
• The z value is listed in the Z table. z = 1.96, 95% confidence

We concluded that a random sample of at least 385 users is required to achieve a 95% confidence level.
Data Collection Methods
A survey was conducted to randomly collect data from mobile money users in the study area. The data were tested to test the hypotheses and examine the factors affecting the use of mobile money services and their impact on human subsistence.
Data Analysis
The data analysis provides comprehensive insight into the survey data and shows the approach of analysis undertaken through Factor Analysis and Regression Analysis. This research endorses inferential analysis to reinforce the significance of data on mobile money services. The study concluded from the data, including assessments of significant differences between constructs, and employed visualization techniques to create a pictorial overview for a more intuitive understanding of the data and study outcomes.
Reliability and Validity of Study Data Measurement
Reliability analysis was carried out on the identified 27 constructs from the variables of mobile money service usage.
|
Cronbach's Alpha |
N of Items |
|
.983 |
27 |
Source: By Authors
Table 1: Reliability Statistics
Cronbach’s alpha showed the questionnaire to reach reliability, ∝=0.983 which meant that all four variables of measurement correlate with mobile money service usage with individual values as follows: perceived usefulness ∝=0.946, perceived user friendliness ∝=0.962, perceived ease of learning ∝=0.972, and perceived satisfaction ∝=0.966.
Results and Discussion
Demography
According to the study, there were more male participants than female, with males representing 63.7% and females representing 36.4%. The age group that was most involved in the study was between 30 and 40 years (40.8 %). In addition, 71.9% of the respondents were employed. From a demographic standpoint, this suggests that mobile money services are strongly integrated into the social class, particularly among educated communities. This can be attributed to social influence and network dynamics, which influence the use of mobile money services. The results are shown in Table 3.
|
Variable(n=385) |
Frequency |
Percentage (%) |
|
|
Gender |
Male |
245 |
63.6 |
|
|
Female |
140 |
36.4 |
|
Age |
< 30 yrs |
110 |
28.6 |
|
|
30 - 40yrs |
157 |
40.8 |
|
|
40 - 50 yrs |
65 |
16.9 |
|
|
> 50 yrs |
53 |
13.8 |
|
Employment |
Employed Government |
103 |
26.8 |
|
|
Employed Private |
88 |
22.9 |
|
|
Not employed |
106 |
27.5 |
|
|
Self Employed |
86 |
22.3 |
|
|
Retired |
2 |
.5 |
|
Educational Level |
None |
48 |
12.5 |
|
|
Primary |
9 |
2.3 |
|
|
Secondary |
81 |
21.0 |
|
|
Diploma |
74 |
19.2 |
|
|
Degree |
136 |
35.3 |
|
|
Masters |
37 |
9.6 |
Source: By authors
Table 3: Study Demography
Factor Analysis
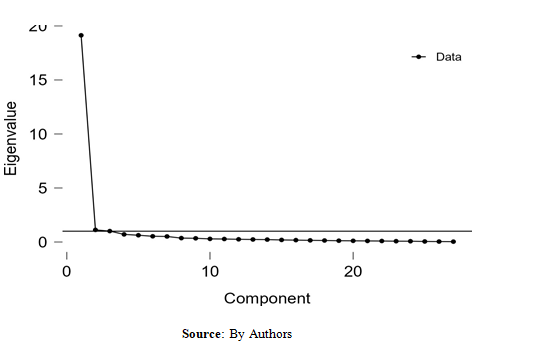
The reliability of the study had a positive impact on users’ acceptance and use of mobile money services. The study construct was confirmed to converge successfully, as the factor loadings on latent values exceeded 0.70, indicating its reliability among users who regularly utilized mobile money services. To effectively conduct a factor analysis, several prerequisites must be met, including finding the Kaiser-Olkin-Measure (KMO) and Bartlett’s test and Three criteria were used to determine the number of factors to be retained for interpretation: the eigenvalue greater than one rule, examination of the scree plot, and consideration of the percentage of variance explained.
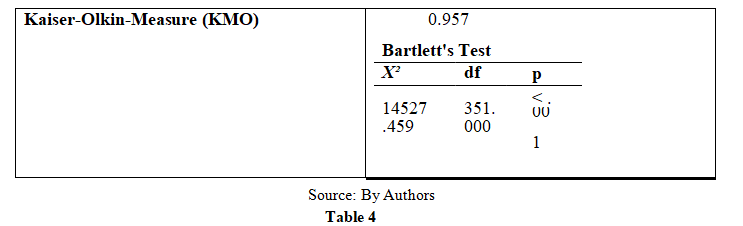
The KMO value, 0.957, exceeds the minimum threshold of 0.50, indicating the adequacy of the sample size. Additionally, Bartlett’s test yielded a value of 0.001, suggesting that, at the very least, some variables within the dataset were intercorrelated, thus affirming the appropriateness of the data for factor analysis.
|
|
|
PC1 |
PC2 |
PC3 |
|
It is simple to use |
|
0.813 |
|
|
|
It is user-friendly user friendly |
|
0.784 |
|
|
|
It is flexible |
|
0.771 |
|
|
|
it is easy to use |
|
0.765 |
|
|
|
It has improved my performance in my daily activities |
|
|
0.783 |
|
|
It meets my needs |
|
|
0.744 |
|
|
I can recover from mistakes |
|
|
|
0.821 |
Source: By authors
Table 5: Component Loadings
Table 5 presents the component loadings after extraction. Only seven variables were included in the final factor solution of the original twenty-seven (27) variables. The rest were excluded from the analysis because their loadings were below 0.70 or showed cross-loadings, meaning they loaded onto more than one factor during the initial examination. The table clearly shows that all final communalities were 0.70 or higher. Importantly, the final factor solution accounted for at least 50% of the initial commonality of each variable. Therefore, the factor solution can be considered to be satisfactory.
|
|
Unrotated solution |
Rotated solution |
||||
|
Eigenvalue |
Proportion var. |
Cumulative |
SumSq. Loadings |
Proportion var. |
Cumulative |
|
|
Component 1 |
19.131 |
0.709 |
0.709 |
5.032 |
0.186 |
0.186 |
|
Component 2 |
1.122 |
0.042 |
0.750 |
5.005 |
0.185 |
0.372 |
|
Component 3 |
1.012 |
0.037 |
0.788 |
4.814 |
0.178 |
0.550 |
|
Component 4 |
0.707 |
0.026 |
0.814 |
4.240 |
0.157 |
0.707 |
|
Component 5 |
0.628 |
0.023 |
0.837 |
3.508 |
0.130 |
0.837 |
Source: By authors
Table 6: Component Characteristics
According to the eigenvalue-higher-than-one criteria, table two (2) components (19.131, 1.122) have eigenvalues larger than one; hence, two factors can be retained for interpretation. Since the first two factors account for 70.0 percent of the variance in the data, they account for more than the specified 60 percent of the variance.
Regression Analysis
The findings in Table 7 indicate that the intercorrelations among variables/items are strong and, as such, would fit the regression analysis.
An equation is given in the general form to study the variables influencing the acceptance of mobile money usage in Ghana:
Y = β0 + β1 X1 + β2 X2 +……….βn Xn + â??i 1
RAMMS = f (PU, PEOU, PEOL, PS) 2
RAMMS = β0 + β1 PU + β2 PEOU + β3 PEOL + β4 PS + εt 3
RAMMU: Rate of acceptance of mobile money service
PU: perceived usefulness
PEOU: perceived ease of use
PEOL: perceived ease of learning
PS: Perceived satisfaction
|
Model |
Sum of Squares |
df |
Mean Square |
F |
P |
|
|
Ha |
Regression |
136.427 |
4 |
34.107 |
89.037 |
< .001 |
|
Residual |
145.563 |
380 |
0.383 |
|
|
|
|
Total |
281.990 |
384 |
|
|
|
|
Source: By authors
Table 8: ANOVA
|
Model |
Unstandardized |
Standard Error |
Standardized |
t |
p |
|
|
Ha |
(Intercept) |
0.377 |
0.069 |
|
5.484 |
< .001 |
|
Usefulness |
0.309 |
0.080 |
0.308 |
3.836 |
< .001 |
|
|
Ease of Use |
-0.242 |
0.112 |
-0.231 |
-2.150 |
0.032 |
|
|
Ease of Learning |
0.455 |
0.091 |
0.481 |
5.015 |
< .001 |
|
|
Satisfaction |
0.162 |
0.101 |
0.156 |
1.605 |
0.109 |
|
Source: By authors
Table 9: Coefficients
RAMMS = 0.377+0.309PU - 0.242PEOU + 0.455PEOL 4
The ANOVA findings show that the regression model predicts the dependent variable significantly. The R2 = 48.4 F (4,380) = 86.322, p value = 0.000, which is less than 0.05, shows that the overall regression model statistically and significantly predicts the outcome variable, showing a good fit for the data.
The equation above shows the regression coefficients. From the table, the dependent variable is (RAMMS), and the remaining variables are independent variables.
a. H1: Perceived usefulness positively affects mobile money service acceptance and usage.
(β = 0.309, t = 3.836, p < 0.001).
b. H2: Perceived ease of use positively affects mobile money service usage.
(β = -2.242, t = 5.015, p < 0.032).
c. H3: Perceived ease of learning positively affects mobile money service usage.
(β = 0.455, t = -2.150, p < 0.001).
d. H0: Perceived satisfaction positively affects mobile money service usage.
(β = 0.162, t = 1.605, p < 0.109).
The above equation shows that the coefficient of perceived usefulness (PU) is 0.377. This indicates that, for additional perceived usefulness, one can expect the rate of acceptance of mobile money services to increase by an average of 0.377, or 40%, and for perceived ease of use, you can expect the rate
of mobile money usage to decrease by 0.242, or 24%. Again, from the table, perceived ease of learning is 0.455, meaning it is almost five times larger than perceived usefulness, meaning that it has a greater role in explaining the rate of acceptance of mobile money services than perceived usefulness.
From the above analysis, three of the variables are significant, which suggests that two of them greatly affect the acceptance of mobile money usage, except for perceived ease of use. Therefore, from Hypotheses 1 and 3, we reject H0 and accept H1 to conclude that they positively affect the acceptance of mobile money service usage, but in the case of hypotheses 2 and 4, we fail to reject H0 to say that in the case of hypothesis 2, the PEOU effect on RMMU was negative. The unique feature of this study is that it employed two strong analytical tools that contribute widely to the field of technology acceptance, especially when it comes to mobile money service usage.
The Influence of Mobile Money Service on Human Subsistence
To examine the influence of mobile money on respondents’ subsistence, the following questions were assessed: How many times do you use mobile money? In which ways do you use mobile money most? What types of transactions do you typically perform using mobile money? How confident are you in the security of mobile money transactions? How frequently do you use mobile money services for financial transactions?
The output of these statements is shown in the figures below.
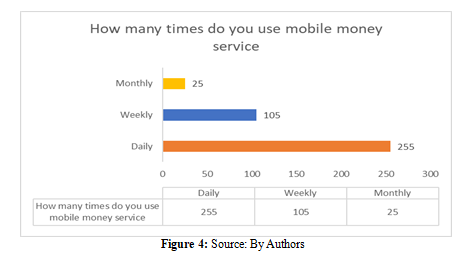
Based on the information presented above, it is evident that a significant proportion of respondents utilize mobile money services daily, indicating a robust inclination to employ it for their daily transactions and other purposes.
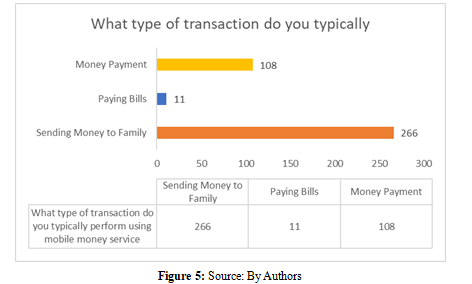
The data depicted in Figure 4 reveal that a considerable number of respondents evince a marked preference for utilizing mobile money services, primarily to send remittances to their families. This trend is indicative of a strong inclination towards augmenting remittance flows, thereby enhancing recipients’ subsistence. As a result, we reject the null hypothesis and accept the proposition that mobile money utilization positively influences mobile money usage.
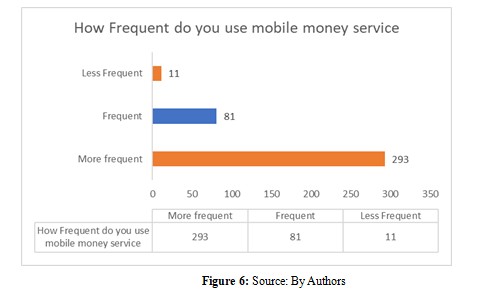
The chart depicted above illustrates that a significant majority of the survey participants frequently utilized mobile money services. This frequent usage is noteworthy, as it directl contributes to its influence on livelihoods, particularly in the context of remittances.
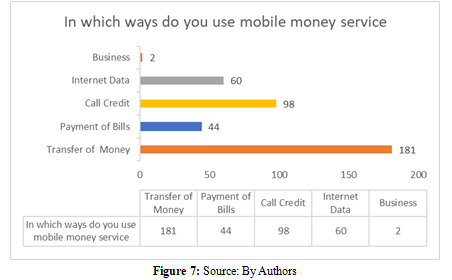
Figure 7 reveals that a substantial proportion of respondents exhibit a pronounced preference for mobile money services for transactions related to remittances, payments for goods and services, and money transfers to family members. This pattern suggests a marked inclination towards increasing remittance activities, which in turn enhances the well-being of the recipients.
The data presented in the figure signify a significant proportion of respondents who use mobile money services regularly, particularly for remittance purposes. This frequent usage highlights the substantial impact of mobile money services on people's lives, particularly in terms of remittance flows and enhancing recipients’ well-being. Mobile money services have significantly impacted livelihoods by enabling the financial inclusion of unbanked, increasing remittance flows, and providing access to other financial services. It has facilitated the growth of small businesses, ensured secure transactions, and secured savings for respondents.
In summary, the findings demonstrate the importance of mobile money services as an enabler of financial inclusion and for improving people’s lives. These results suggest that mobile money services have the potential to spur economic growth, particularly in the context of small businesses. This study underscores the need for policymakers, regulators, and industry players to continue to support and promote mobile money services as a means of enhancing financial inclusion and improving the well-being of people.
Conclusion
Based on the results of the data analysis, it is evident that the rate of mobile money usage is significantly influenced by perceived usefulness (PU), perceived ease of learning (PEOL), and perceived ease of use (PEOU). However, PEOU had a comparatively lower impact on the usage of mobile money services than the other two variables. The coefficients of the two variables had a positive effect on the acceptance of mobile money usage. Therefore, it can be concluded that three measurement
variables are significant factors affecting the usage of mobile money services, which ultimately leads to an increase in mobile money usage. The study also revealed that perceived usefulness and ease of learning are important predictors of whether mobile money services will be used. However, the impact of perceived user friendliness is relatively less substantial. It is noteworthy that the respondents' perceptions of satisfaction had no impact on their likelihood of using mobile money services.
Customers are more likely to adopt and retain mobile money services if they perceive them as easy to learn, useful, and simple to use. A straightforward interface, accurate services, and availability of customer support play a crucial role in achieving this. Furthermore, the study highlights that the use of mobile money has a significant impact on livelihoods, enabling financial inclusion, increasing remittances and access to services, and facilitating the growth of small businesses. It provides secure transactions, savings, and insurance. This study concludes that mobile money is a useful payment mechanism for both customers and merchants. It boosts consumer confidence through perceived user-friendliness, ease of learning, and increased utility. Ultimately, this can contribute to better living standards and meet the demands of the unbanked population. Mobile money can improve financial inclusion by providing access to various services and goods. Its acceptance is essential for promoting economic growth for both individuals and enterprises [13-33].
Acknowledgement
Palm University College Ghana.
Funding
This study received no funding.
Availability of Data and Materials
Yes, upon request.
Author Contributions/Declarations
ECAA – prepared and wrote the manuscript in general, performed all the statistical analyses and all the technical aspects of the paper, and read and approved the manuscript.
FSO – prepared the conclusions and did the editing of the manuscript.
Competing Interests
The authors declare that they have no conflict of interest. The author's details seem to be different from my preprint because this was an extended version where the author mentioned in the preprint preferred I take his name for this new write-up.
Ethical Considerations
This paper is an extract of my MSc thesis, which used a Google sheet survey method of collecting data and did not make use of photos; for that matter, the requirement for ethical clearance was waived.
References
1. Patnam, M., & Yao, W. (2020). The real effects of mobile money: Evidence from a large-scale fintech expansion.
2. Ngila, B. F. (2023). Global mobile money transactions hit a record high in 2022. 1–10.
3. Chafa, A., Gupta, P., & Makadi, Y. C. (2023). A Comparative Analysis of Recent Efforts on Financial Inclusion and the Policy Recommendations of Financial Inclusion in India and Nigeria. Journal of Namibian Studies: History Politics Culture, 34, 6386-6398.
4. Falk, C. (2020). The impact of transaction costs on mobile money usage: Evidence from Tanzania. World Bank Economic Review, 34(2), 324–343.
5. Kelly, A. E., & Palaniappan, S. (2023). Using a technology acceptance model to determine factors influencing continued usage of mobile money service transactions in Ghana. Journal of Innovation and Entrepreneurship, 12(1), 34.
6. Pillai, S. S., Sandhya, G., & Rejikumar, G. (2019). Acceptance of mobile payments and UPI technology-Indian context. International Journal of Business Forecasting and Marketing Intelligence, 5(3), 371-384.
7. Menon, D. G., Ray, S. and Narayan, N. (2017). An Empirical Study on Access and Use of Technology-Based Money Transfer Mechanisms among Migrant Workers in Kerala. International Journal of Applied Business and Economic Research, 15, 173-185.
8. Sujith, T.S., Mohan, S., Jisha, Tp. (2022) The Impact of Self-Efficacy on the Adoption of Mobile Banking with Technology Acceptance Model (TAM).
9. Davis, F. D., Bagozzi, R. P., & Warshaw, P. R. (1989). User acceptance of computer technology: A comparison of two theoretical models. Management science, 35(8), 982-1003.
10. Venkatesh, V., & Davis, F. D. (1996). A model of the antecedents of perceived ease of use: Development and test. Decision sciences, 27(3), 451-481.
11. Zhu, D. H., Lan, L. Y., & Chang, Y. P. (2017). Understanding the Intention to Continue Use of a Mobile Payment Provider: An Examination of Alipay Wallet in China. International Journal of Business & Information, 12(4).
12. Cochran, W. G. (1977). Sampling techniques. John Wiley& Sons.
13. Basri, S. (2018). Determinants of adoption of mobile banking: evidence from rural Karnataka in India. International Journal of Trade and Global Markets, 11(1- 2), 77-86.
14. Bonney, N., Madise, N. J. and Falkingham, J. (2014). Mobile money and poverty reduction: Evidence from Kenya. World Development, 62, 1–19.
15. Bose, R., Lwasa, S. and Nakakeeto, E. (2017). The influence of perceived ease of use on users’ attitude towards mobile money in Uganda. International Journal of Mobile Communications, 15(2), 130–150.
16. Bruhn, M., and Wieser, C. (2019). Does Mobile Money Improve Livelihoods for Households in Poor and Remote Areas?.
17. Casonato, F., Farneti, F., & Dumay, J. (2019). Social capital and integrated reporting: Losing legitimacy when reporting talk is not supported by actions. Journal of Intellectual Capital, 20(1), 144-164.
18. Chaturvedi, A., and Chaturvedi, V. (2018). Impact of perceived costs on consumer attitude: A study of two- wheeler motorcy-cle market in India. International Journal of Research in Business Studies and Management, 5(1), 6–14.
19. Chen, L., & Aklikokou, A. K. (2020). Determinants of E-government adoption: testing the mediating effects of perceived usefulness and perceived ease of use. International Journal of Public Administration, 43(10), 850-865.
20. Dary, S. K., Adams, A., & Abdul-Wahab, S. (2022). Mobile Money, Financial Inclusion and Livelihoods in the Global South. In The Routledge Handbook on Livelihoods in the Global South (pp. 393-402). Routledge.
21. Dupas, P., Karlan, D., Robinson, J., & Ubfal, D. (2018). Banking the unbanked? Evidence from three countries. American Economic Journal: Applied Economics, 10(2), 257-297.
22. Edwards, J. (2020). What is a conceptual framework? A step-by-step guide.
23. Ekow Kelly, A., & Palaniappan, S. (2022). The contribution of government policy and financial security control in Ghana’s mobile money services. Cogent Social Sciences, 8(1), 2138105.
24. Kelly, A. E., & Palaniappan, S. (2022). A conceptual model to determine factors influencing mobile money banking adoption in Ghana. Asian Journal of Economics, Business and Accounting, 22(22), 187-206.
25. Vincent, F. M., & Sengupta, A. (2019). Factors affecting the use of mobile payments among educated urban population: An Indian perspective. International Journal of Innovative Technology and Exploring Engineering, 8(6), 531-537.
26. Foroughi, B., Iranmanesh, M., & Hyun, S. S. (2019). Understanding the determinants of mobile banking continuance usage intention. Journal of Enterprise Information Management, 32(6), 1015-1033.
27. Groupe Speciale Mobile Association (GSMA). (2022). Exploring Women’s Use of Mobile Money in Ghana: The User Journey, Entrepreneurs and the Impact of COVID-19.
28.
28. Islam, A. H., Basher, S. A., & Enamul Haque, A. K. (2022). The impact of mobile money on long-term poverty: evidence from Bangladesh. Journal of Social and Economic Development, 24(2), 436-455.
29. Rishi, R., Aramé, A., Christopher, L., Devyn, H., and Gianluca, S. (2023). the State of the Industry Report on Mobile Money. 5–9.
30. Suárez, S. L. (2016). Poor people׳ s money: The politics of mobile money in Mexico and Kenya. Telecommunications Policy, 40(10-11), 945-955.
31. Wang, T., Bhuiyan, M. Z. A., Wang, G., Qi, L., Wu, J., & Hayajneh, T. (2019). Preserving balance between privacy and data integrity in edge-assisted Internet of Things. IEEE Internet of Things Journal, 7(4), 2679-2689.
32. Zhang, T., Lu, C., & Kizildag, M. (2018). Banking “on-the- go”: examining consumers’ adoption of mobile banking services. International Journal of Quality and Service Sciences, 10(3), 279-295.
33. Zou, Y., Wei, M., and Li, Y. (2018). Investigating user attitudes and acceptance of mobile payment: An empirical study. Inter-national Journal of Information Management, 38(1), 73–82.