
Journal of Electrical Electronics Engineering(JEEE)
ISSN: 2834-4928 | DOI: 10.33140/JEEE
Impact Factor: 1.2


Research Article - (2023) Volume 2, Issue 4
Electrical Resistivity - Tomography Studies In Determining Shallow Aquifer Potential Zones a Case Study in Different Terrains
Research Article J Electrical Electron Eng, 2023 Volume 2 | Issue 4 | 550-558; DOI: 10.33140/JEEE.02.04.20
Sivakumar. A* Mohamed Abdul Kadar Prabhu H and Gowtham. B
Department of Geology, Presidency College (Autonomous), Chennai
*Corresponding Author : Sivakumar. A, Department of Geology, Presidency College (Autonomous), Chennai
Submitted: 2023, October 10; Accepted: 2023, November 08; Published: 2023, November 15
Citation: Sivakumar, A., Mohamed Abdul Kadar Prabhu, H., Gowtham, B. (2023). Electrical Resistivity - Tomography Studies In Determining Shallow Aquifer Potential Zones a Case Study in Different Terrains. J Electrical Electron Eng, 2(4), 550-558.
Abstract
The study documents the effectiveness of 2 D (Two Dimensional Electrical Resistivity Survey (Tomography) to map shallow subsurface geological formations namely recent Alluvium, Gondwana deposits and hard rock deposits. 2 dimensional Electrical Resistivity Survey (or tomography) was conducted at 2 locations at Valarpuram and one location Madurantakam areas. Gondwana deposits mask Valarpuram Thandalam, villages (at Kancheepuram District, Tamilnadu). To the east of Valarpuram alluvium thickness increases at shallow depths. Weathered and hard granitic gneiss and hard charnockite rocks overlie topsoil in Madurantakam areas (Chengalpettu District, Tamilandu). The survey was conducted to 12 m depth to decipher shallow permeable zones. Gondwana formations consisting of clays, siltstones are predominant in Valarpuram Thandalam and surrounding areas. Hard rock formations are found in Madurantakam areas. 2 Dimensional Resistivity Survey results indicate 2-D sections with very low resistivity values in the range of 2 to 4 ohm-m in Valarpuram Thandalam areas indicating predominant clay deposits with poor ground water potential. To the east of Valarpuram Thandalam resistivity data is of moderately higher value indicating sand deposits at shallow depths. These are ideal locations for dug wells. Low to moderate values at shallow depths indicating weathered thickness up to 12 m are observed at Madurantakam location. From 12m depth steep rise in resistivity values are observed in hard indicating presence of massive rock from 12m depth and below areas. Thus, 2 D Resistivity Imaging Technique are helpful in delineating shallow aquifer potential and this in turn helps in deciding the depth of open wells with high precision.
1. Introduction
2D Resistivity Imaging Survey or Tomography was conducted at two locations in Valarpuram Thandalam area and at one location in Madurantakam area.
The study area falls under the Valarpuram Thandalam Villages in Sriperambudhur Taluk of Kancheepuram District and Puliyarankottai Village in Madurantakam Taluk of Kancheepuram District. The study area at Valarpuram Thandalam is masked sedimentary formations belonging to recent alluvium, and Gondwana formations. The location map of two sites in Valarpuram Thandalam and east of Valarpuram Thandalam area is shown in Figure 1 and the location map of site in Madurantakam is shown in Figure 2.
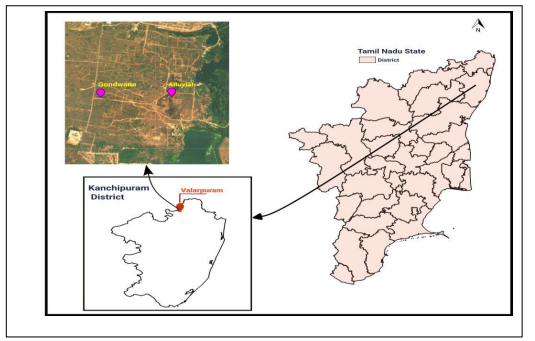
Figure 1: Location Map of Valarpuram Area, Kancheepuram District.
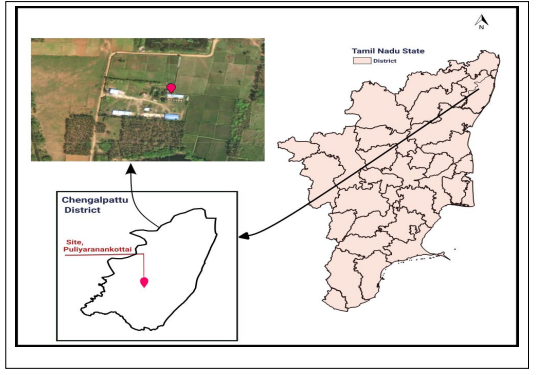
Figure 2: Location Map of Puliyaranankottai Village Madurantakam.
1.1 Objectives
The objective is to map and understand the resistivity of formations at shallow depths belonging to Gondwana, Alluvium and Hard rock formations and interpret presence of shallow aquifer for locating dugwell [1]. Two locations were selected near Valarpuram-Thandalam areas of Kancheepuram District and one location near Madurantakam in Kancheepuram District.
2.0 Geology of Kancheepuram District
The Kancheepuram district is principally made up of hard rocks and sedimentary formations. These are overlained by laterites and alluvium. The study area is underlain by formations of Quarternary, Tertiary and Mesozoic ages followed by the basement complex of crystalline rocks of Archaean age. The literature has been sourced from Central Ground Water Board (CGWB) manual Kancheepuram. The stratigraphical succession is shown in Table 1.
| Age | Formation | Lithography |
|---|---|---|
| Recent | Alluvium and beach sands | Sand, gravel, silt and clay |
| Pleistocene | Laterite, soils, talus | Laterites, sandy clay, silt |
| Pleistocene to upper Miocene | Conjeevaram gravels | Boulders, cobbles pebbles and gravels chiefly of quartzites |
| Unconformity | ||
| Lower Cretaceous to Jurassic | Sandstones & Shales | Fine to medium grained sand stone with clay intercalations of greenish soft shale |
| --- | Boulder bed | Big boulders of granite gneiss with or without Matrix of clay and the sand |
| Unconformity | ||
| Archaean | Crystalline formations | Mixed gneisses, charnockites, granites and associated basic and ultra basic intrusives |
Table 1: Stratigraphic Succession of Geological Formations.
(Source–District Ground Water Brochure, Kancheepuram, CGWB, 2007).
Archaean: Hard Rocks
An Archaen formation is spread over about 60% of this district. These rocks are Granitic gneisses, Ultra basic mphiboli of Archaean age and Charnockites. They mainly comprise of biotite and hornblende and are intrude by mphibolites, dykes of dolorite and occasionally by veins of quartz and pegmites.
Charnockite rock is more prominent in Tambaram, Sriperumbudur and Madurantakam Taluks. Gneissic rocks occur mainly in Thirukkazhukundram and in parts of Kancheepuram Taluks [2,3]. The dolerites, as dykes are observed both in gneisses and in charnockites. The width ranges from 20m to 40m in the strike direction NE-SW. The dykes are predominanty observed in Thiruporur and East of Chengalpattu.
Gondwana
This formation comprises of clays, shales, sandstones and conglomerates. The shale and clay of gondowana age occur on the bank of Palar river and Sriperumbudur Taluk in irregular shape. Oldest of these formations are exposed in parts of Sriperumbudur and Kancheepuram Taluks as clay and shale beds, are of upper Gondwana age. The fine grained sand is observed at Kancheepuram and Uthiramerur Taluks. Gravel bed of 2 to 4m thickness is observed in Abdullapuram Manapakkam Road, and the gravel thickness is ranging from 1.5 cm to 5cm in diameter and the same is over lined by sandstone is called conjeevaram gravels which is equivalent to cuddalore and Rajmundry sand stone of Teritiary age [4,5].
Conglomerates and Laterite
Conglomerates are composed of boulders, Pebbles and mostly of quarzites are observed in uplands of Sriperumbadur Taluk. The maximum sizes of these boulders are found as capping over the upper Gondwanas. The laterites are well developed around Chemberambakkam village. These laterites are porous vermicular, clay like rocks of red, yellow, brown, grey and in mottled colours.
Alluvium
Alluvial deposits are the youngest formation, consisting of sands and clays and are deposited by the cheyyar, Coovam and Palar rivers [6]. The Adayar alluvium consists of silt, fine and coarse grained sands, gravel and pebbles. The Palar alluvium comprises of coarse sands and gravels. The average thickness of alluvium is about 10 to 30m.
Geological Structure
The general trend of the gneiss is NE-SW direction and the regional trend observed is NNE-SSW to NW-SE direction. The deposition of Gondwana rocks, the sedimentary rocks, in faulted troughs and in the rugged topography of crystalline rocks took place during Jurassic period. The insitu soils laterites and alluvial deposits were deposited along the Palar and Cheyyar rivers during the quaternary period.
2.1 Geology of Valarpuram –Thandalam Area
Gondwana deposits are observed in Valarpuram-Thandalam area. This formation comprises of clays, shales intercalated with minor sandstones. The deposits extend to 200m depth at certain pockets in Sriperumbudur, Chembarambakkam area. The shale and clay of gondwana age also occur on the bank of Palar River and Sriperumbudur Taluk in irregular shape.
To the east of Valarpuram Thandalam alluvium formations are observed at shallow depths and the thickness appreciably increases eastwards towards Kuthambakkam.
2.2 Geology of Madurantakam Area
An Archaen formation is spread over about 90% of Madurantakam. These rocks are Granitic gneisses, Ultra basic mphiboli of Archaean age and Charnockites. They mainly comprise of biotite and hornblende and are intrude by mphibolites, dykes of dolerite and occasionally by veins of quartz and pegmatites.
The sites of Valarpuram, Thandalam and Puliyarankottai sites superimposed on Geology Map is shown below in figure 3
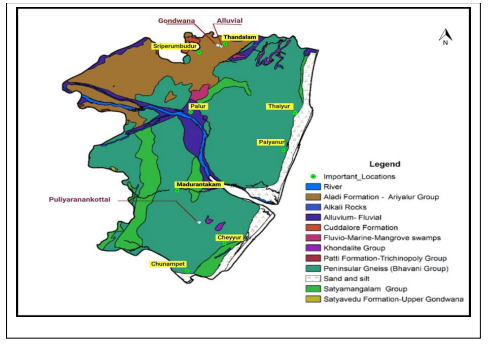
Figure 3: Sites Superimposed in Regional Geological Map.
3. Study Methodology
2-D Resistivity Tomography was conducted at 2 locations in Valarpuram Thandalam where sedimentary deposits exist and Puliyarankottai village at Madurantakam where Hard rock formations exist. 1 D resistivity survey was conducted for correlation purpose.
Electrical Resistivity Imaging (ERI) is a geophysical technique for imaging sub-surfaces structures from electrical measurements made at the surface with multi-electrode system.
2-D Resistivity imaging technique is the latest State-of-the-art available to map the complex geological features. The greatest limitation of 1D resistivity sounding method is that it does not take into account horizontal changes in the subsurface resistivity [7,8]. A more accurate model of the subsurface is a two-dimensional (2-D) model where the resistivity changes in the vertical direction, as well as in the horizontal direction along the survey line. In this case, it is assumed that resistivity does not change in the direction that is perpendicular to the survey line. In many situations, particularly for surveys over elongated geological bodies, this is a reasonable assumption. In theory, a 3-D resistivity survey and interpretation model should be even more accurate. However, 2-D Resistivity survey is one of the most practical and economic compromise between obtaining very accurate results and keeping the survey costs down. Typical 1-D resistivity sounding usually involve about 10 to 50 readings, while 2-D imaging surveys involve about few 100 to 1000 measurements. In many geological situations, 2-D electrical imaging surveys give useful results that are complementary to the information obtained by other geophysical method [9-13].
The Tomography field measurement procedure is shown below in Figure 4.
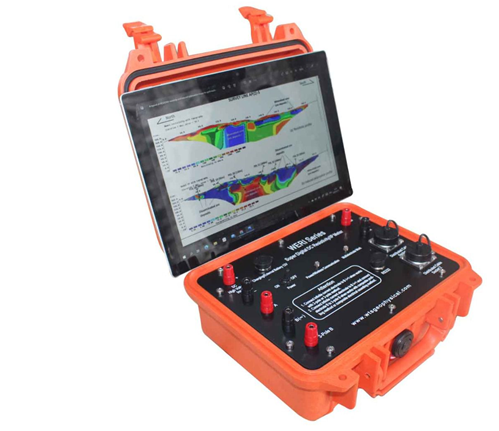
Figure 4: : Resistivity Imaging Equipment’s.
4. Instrumentation and Measurement Procedure
For carrying out 2-D/3-D electrical imaging/tomography surveys large number of electrodes, connected to a multi-core cable. A microcomputer together with an electronic switching unit is used to automatically select the relevant four electrodes for each measurement. WERI Series, Multi-Electrode Resistivity Imaging System is used for automatic data collection with 60 electrodes spaced at 1m intervals. Schlumberger array is used for data acquisition for this project.
This equipment is capable of running self-checks for connectivity of electrodes and generates warnings on bad contacts. Bad contacts were resolved by pouring water on the ground and then electrode where driven subsequently to reduce grounding resistance. Normally a constant spacing between adjacent electrodes is used. The multi-core cable is attached to an electronic switching unit, which is connected to the resistivity imaging system. The sequence of measurements to take, the type of array to use and other survey parameters (choose the voltage for output from D.C Power Source within a range of 9-v to 180v with 2 AH) is normally entered into a text file which can be read and fix in the instrument. After reading the control file, the instrument program then automatically selects the appropriate electrodes for each measurement as per pre-assigned electrode configuration. In a typical survey, most of the time consuming process in the data acquisition is the laying of the multi core imaging cables and electrodes. After that, the entire profile line connection is checked automatically by the instrument for noise and bad connection. Once all the electrode connection is proper, then the equipment is ready to take measurements. Data acquisition for each set of measurement is made automatically with constant current supply and stored in the system. The acquired field data is then down loaded to the computer and then processed by using RES2DINV software with all elevation and terrain correction.
5. Results and Discussions
This equipment is capable of running self-checks for connectivity of electrodes and generates warnings on bad contacts. Bad contacts were resolved by pouring water on the ground and then electrode where driven subsequently to reduce grounding resistance. Normally a constant spacing between adjacent electrodes is used. The multi-core cable is attached to an electronic switching unit, which is connected to the resistivity imaging system. The sequence of measurements to take, the type of array to use and other survey parameters (choose the voltage for output from D.C Power Source within a range of 9-v to 180v with 2 AH) is normally entered into a text file which can be read and fix in the instrument. After reading the control file, the instrument program then automatically selects the appropriate electrodes for each measurement as per pre-assigned electrode configuration. In a typical survey, most of the time consuming process in the data acquisition is the laying of the multi core imaging cables and electrodes. After that, the entire profile line connection is checked automatically by the instrument for noise and bad connection. Once all the electrode connection is proper, then the equipment is ready to take measurements. Data acquisition for each set of measurement is made automatically with constant current supply and stored in the system. The acquired field data is then down loaded to the computer and then processed by using RES2DINV software with all elevation and terrain correction.
2 D Survey Results at Gondwana Terrain
Survey Date: April 5th 2023 The depth of investigation was 12 metres to identify shallow aquifer and to infer the feasibility of dugwell.
2 Imaging outputs conducted on Gondwana terrain revealed low resistivity values in the range of 0.1 to 5 ohms. High resistivity of 30 ohm metres was observed at surface 0m to 4m indicating dry gravelly lateritic deposits. Below 5m depth the resistivity values were low in the range of 0.1 ohm metres to 3 ohm metres indicating plastic clay deposits. Gondwana deposits typically contain clay deposits and extend to 100 metres below ground.
The entire section beyond 4m depth exhibited low resistivity values in the range of 0.1 to 3 ohm-m indicative of fine grained clay deposits and it is inferred that dugwells constructed at this area will have poor yield and hence feasibility of dugwell in the surveyed area is not possible.
1D resistivity survey conducted at the locations exhibited similar resistivity values.
The 2D output of the survey conducted at this location is shown in Figure 5 below.
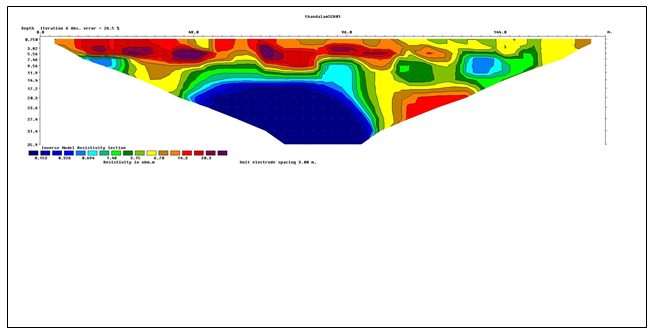
Figure 5: 2D Output Image of the Survey Conducted at this Location.
The 2D output of the survey conducted at this location is shown in Figure 5 below.
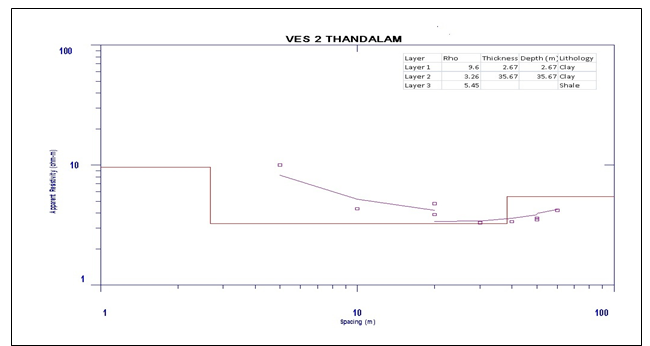
Figure 6: 1 D Resistivity Survey Data (Gondwana Terrain – Valarpuram).
5.2 Results at Alluvium Terrain
Location 2 Alluvium Terrain
Coordinates: UTM ZONE 44 390371 E 1438511 N
Survey Date: April 15th 2023
Similar investigation was conducted east of Valarpuram and Valarpuram Thandalam where alluvium thickness was comparatively high as heard from local people. The depth of investigation was 12 metres to identify shallow aquifer and to infer the feasibility of dug well.
The surface layer with a thickness of 0.5 To 1.5 m exhibits a very high resistivity of 100 to 200 ohm-m indicating dry loam or dry sandy soil.
The location exhibits moderate resistivity values of 7 to 30 ohm-m between 4 to 10m depths from surface to depth of 10m indicating presence of permeable sand. The permeability of sand is better than the permeability of clay and the yield of dug wells is likely to yield very well to meet the domestic requirements of houses and manufacturing industries located in the area. Inventory of few dug wells revealed good quality and good yield from the dug wells. The water level in the dug well close to the survey location was 4 metres below ground. The topsoil exhibits higher resistivity in the range of 100 to 200 ohm-m and at depths of 4 to 10m exhibits a resistivity range of 6 to 35 ohm-m indicating permeable sand and clayey sand. 1D resistivity survey conducted at the locations exhibited similar resistivity values.
The 2 D image of the survey conducted at this location is shown in Figure 7 below.
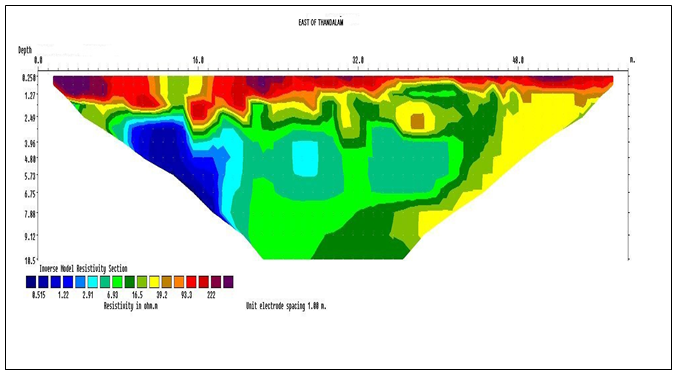
Figure 7: 2 D image of the Survey Conducted at this Location.
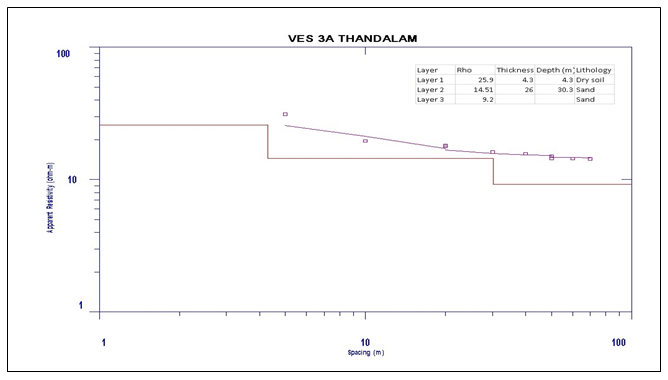
Figure 8: 1 D Resistivity Survey Data (Alluvium Terrain – East of Valarpuram Village).
5.3 Location 3 Hard Rock Terrain
Date of Survey: 6th April 2023
Location 3 – 383335 E, 1379282 N
2D survey conducted at Puliyarankottai Village hard terrain exhibited a contrasting resistivity compared to alluvium and Gondwana terrain. Overall the resistivity values ranged between 30 to 100 ohm-m to about 100m depth. Beyond 10m depth the resistivity values showed a steep increase in the range of 100 to 400m indicating dense rock. The top soil with a thickness of about 2 metres exhibited very low resistivity in the range of 3 to 7 ohm. The second layer consisting of weathered charnockite exhibited resistivity values in the range of 27 to100 ohm-m and is extending to about 10m depth. The maximum thickness of weathered as per the imaging results was 12m below ground. From 12m onwards and below the resistivity values indicate a steep increase in the range of 200 to 400 ohm-m indicating hard rock.
The section of the traverse location that had 12 metres weathering thickness is favourable location for locating a dug well. From 12m depth and below the resistivity values increase steeply indicating very dense bed rock. Drilling of test boreholes correlated with survey results. 1D resistivity survey conducted at the locations exhibited similar resistivity values.
The 2D image of the survey conducted at this location is shown Figure 9 below.
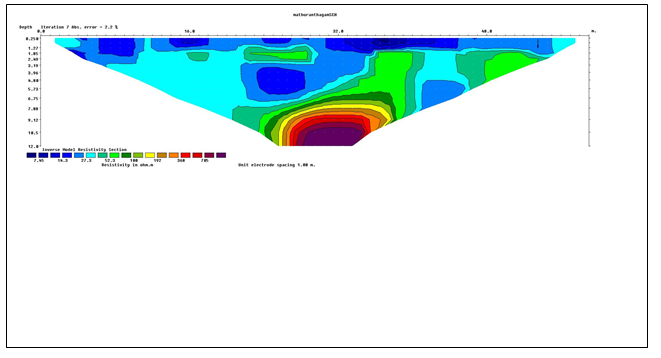
Figure 9: 2D image of the Survey Conducted at this Location.
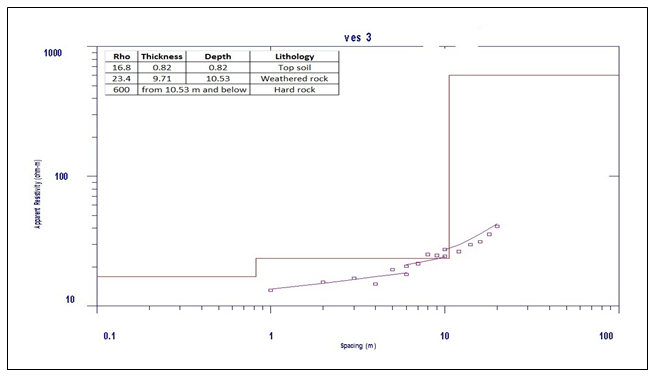
Figure 10: 1 D Resistivity Survey Data (Hard Rock Terrain– Puliarankottai).
6. Conclusions and Recommendations
From the 2D dimensional electrical resistivity it can be concluded the study is very useful in identification as well as delineating of shallow permeable zone. The locations that have adequate permeable zones below the water table are ideal for construction of open well. The study conducted at different terrains mainly the Gondwana (clayey) terrain, the alluvium (permeable sandy terrain) and the hard rock terrain exhibited contrasting resistivity values thereby inferring the depth and extent of permeable zones.
In Valarpuram Thandalam areas masked by Gondwana terrain the surface; layer exhibited high resistivity at the surface due to presence of laterite or dry loam to 4 m depth and very low resistivity values between 4m to 12m indicating clay deposits.
Towards the east of Valarpuram Thandalam, Alluvium terrain exhibited moderate resistivity values between 4 to 10m indicating permeable sand deposits. The survey is useful for locating shallow dug wells Puliyarankottai Village, Madurantakam area is masked by hard rock 2 D imaging has been useful in determining depth to weathered rock and depth to bed rock. The summary of results for easy understanding of resistivity characteristics is shown in Table 2.
table, th, td { border: 1px solid black; border-collapse: collapse; }
| Depth below ground level | Gondwana Terrain | Alluvium Terrain | Hard rock terrain |
|---|---|---|---|
| O to 4m below ground | 30 to 40 ohm-m Laterite/sand | 100 to 200 ohm-msand | 0.25 to 2 0hm-mSandy loam |
| 4 to 10m below ground | 1 to 3 ohm clay | 6 to 40 ohm-mSand/clayey sand | 27 to 100 ohm-m weathered rock |
| 10 to 12m below ground | 3 ohm-m clay | 6 to 16 ohm-m Sand clayey sand | 200 to 400 ohm hard rock |
| Shallow Aquifer Potential and Feasibility of dugwell | Poor Not suitable for dugwell | Good Aquifer Suitable for dugwell | Moderate Aquifer Suitable for Aquifer |
Table 2: Comparison of Resistivity Values in Respective Terrains.
References
- Anbazhagan, P., Sitharam, T. G., & Divya, C. (2007). Site Response Analyses based on Site Specific Soil Properties using Geotechnical and Geophysical tests: Correlations between Vs30, Gmax and N60.
- Braga, A. C., Malagutti F° _, W., Dourado, J. C., & Chang, H. K. (1999). Correlation of electrical resistivity and induced polarization data with geotechnical survey standard penetration test measurements. Journal of Environmental and Engineering Geophysics, 4(2), 123-130.
- Cosenza, P., Marmet, E., Rejiba, F., Cui, Y. J., Tabbagh, A., & Charlery, Y. (2006). Correlations between geotechnical and electrical data: A case study at Garchy in France. Journal of Applied Geophysics, 60(3-4), 165-178.
- Gay, D. A., Morgan, F. D., Vichabian, Y., Sogade, J. A., Reppert, P., & Wharton, A. E. (2006). Investigations of andesitic volcanic debris terrains: Part 2—Geotechnical. Geophysics, 71(1), B9-B15.
- IS 1498, 1970. Indian Standard Classification and Identification of Soils for General Engineering Purposes, First revision, Bureau of Indian Standards, New Delhi.
- IS 1892, 1974. Indian Standard Code of Practice for subsurface investigation for foundations, Bureau of Indian Standards, New Delhi.
- IS 2013, 1981. Indian Standard, Method for Standard Penetration Test for Soils, First Revision, Bureau of Indian Standards, New Delhi.
- IS 2013, 1986. Indian Standard code of Practice for Thin Walled Tube Sampling of Soils, Second Revision, Bureau of Indian Standards, New Delhi.
- Loke, M. H., & Barker, R. D. (1996). Rapid least‐squares inversion of apparent resistivity pseudosections by a quasi‐Newton method1. Geophysical prospecting, 44(1), 131-152.
- Loke, M. H. (1997). RES2DINV ver. 3.3 for Windows 3.1, 95, and NT Advanced Geosciences. Park, C. B., Miller, R. D., & Xia, J. (1999). Multichannel analysis of surface waves. Geophysics, 64(3), 800-808.
- Sudha, K., Israil, M., Mittal, S., & Rai, J. (2009). Soil characterization using electrical resistivity tomography and geotechnical investigations. Journal of Applied Geophysics, 67(1), 74-79.
- Samouëlian, A., Cousin, I., Tabbagh, A., Bruand, A., & Richard, G. (2005). Electrical resistivity survey in soil science: a review. Soil and Tillage research, 83(2), 173-193.
- Destegül, U. (2004, March). Sensitivity Analysis of Soil Site Response Modelling in Seismic Microzonation for Lalitpur, Nepal. ITC.
Copyright:
Copyright: ©2023 Sivakumar. A, et al. This is an open-access article distributed under the terms of the Creative Commons Attribution License, which permits unrestricted use, distribution, and reproduction in any medium, provided the original author and source are credited.