Research Article - (2025) Volume 9, Issue 1
Continuity-of-Care for Substance Misusing Prison Leavers: A Quantitative Analysis of Service Delivery Models Within a Local Setting
2Essex County Council, UK
Received Date: Feb 05, 2025 / Accepted Date: Feb 26, 2025 / Published Date: Mar 05, 2025
Copyright: ©2025 Marc Connor, et al. This is an open-access article distributed under the terms of the Creative Commons Attribution License, which permits unrestricted use, distribution, and reproduction in any medium, provided the original author and source are credited.
Citation: Connor, M., Hughes, B. (2025). Continuity-of-Care for Substance Misusing Prison Leavers: A Quantitative Analysis of Service Delivery Models Within a Local Setting. J Addict Res, 9(1), 01-06.
Abstract
Introduction: This study tests our assumption that prison-to-community continuity-of-care increases drug treatment engagement rates and reduces waiting times, hypothesis one (H1). Engaging with drug treatment services may improve health and crime out- comes for this vulnerable population. The study also aims to determine whether a single service delivery model, spanning both prison and community settings, improves these metrics, hypothesis 2 (H2).
Method: Over a four-year period, the instances of continuity-of-care, prison release, and treatment start dates were recorded for individuals with substance misuse issues released to a local drug recovery partnership (n=808). All participants were monitored for 365 days after their first release (H1). A subset of this group (n=533), released through the local adult male prison to the local drug treatment services, were compared for the two years before (n=255) and the two years after (n=278) the implementation of the single service delivery model (H2). Data were analysed using right-censored Kaplan-Meier Survival Analyses.
Results: There was a significant association between system-level prison-to-community continuity-of-care and higher rates of engagement and reduced waiting times for community drug treatment (p<.00001). The implementation of single service provision enhanced the performance of prison-to-community continuity-of-care. However, whilst treatment engagements through continu- ity-of-care increased from 5.4% to 12.7% and average waiting times decreased from 97 to 67 days, due to the small sample size, there was insufficient statistical evidence to support H2.
Conclusions: This study confirms that, within our local setting, continuity-of-care care from the prison to community drug treat- ment leads to higher rates of treatment engagements and shorter waiting times (H1 - accepted). Additionally, although not statisti- cally proven (H2 - not accepted), our a priori decision to implement a single-service delivery model appears to have been justified given the observed improvements in these performance metrics.
Keywords
Continuity-of-Care, Prison Leavers, Substance Misuse, Community Treatment Engagement, Waiting Times to Treatment, Systems Thinking, Service Configuration, Survival Analysis
Introduction
Continuity of care (CC), also referred to as throughcare and aftercare, is widely recognized as essential for achieving successful treatment outcomes, particularly in drug rehabilitation [1,2]. Entry into drug treatment programs has been linked with reductions in criminal activity [3-7]. Although research on prisoner continuity of care is available there is a paucity of quantitative non-clinical studies that focus exclusively on the transition from prison to community drug recovery services [8-10]. This gap is particularly evident in research conducted from the systems thinking and strategic commissioning perspectives. Based on the Price Waterhouse Coopers review of prison-based drug treatment funding, our Recovery Partnership proposed merging non-clinical prison and community drug treatment services into a single integrated entity [11]. Our successful bid to the UK Government’s Drug Systems Change Pilot initiative led to the launch of the 'InsideOut' service on April 1, 2010 [12,13].
The systematic delivery of CC within the criminal justice context, particularly for drug-affected individuals leaving prison, has long been discussed and yet remains challenging [14-18]. Despite the UK's first national anti-drugs strategy in 1995 emphasizing its importance, progress was sluggish. A fresh impetus was introduced via the Reducing Re-offending National Action Plan [19]. More recent efforts, such as the ‘Through the Gate’ program, have also shown little impact on reducing relapse and recidivism among short-term prisoners [20].
From a systems perspective, this study utilized data from the community-based National Drug Treatment Monitoring System (NDTMS) and the prison-based Drug Intervention Record Web- based (DIRWeb) databases to test the assumptions that continuity of care (CC) is associated with improved rates of and reduced waiting times for community drug treatment engagement [21- 25]. Additionally, we hypothesized that the introduction of an integrated, single-service delivery model, replacing the separate siloed provisions, would result in significant improvements in both measures, as reported by the locally developed and statutory counting mechanisms. Given the UK Government’s recently updated ten-year drug and alcohol strategy with a renewed focus on prisoner continuity-of-care this paper aims to highlight th opportunities available to local drug and alcohol systems wishing to review this key health and justice care pathway [26,27].
Conceptual Framework
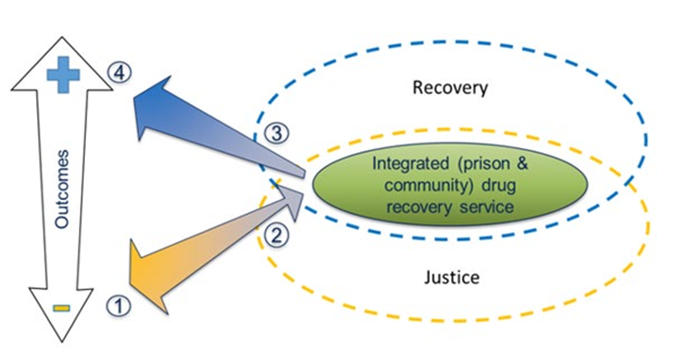
This study examines the prison-to-community continuity-of- care journey at the system and service levels and whether an integrated single service provision model, based on systems and strategic commissioning thinking can improve service delivery. It incorporates systems dynamics and soft systems methodology [28-31]. The model (Figure 1) locates the single service provision at the intersection of recovery (blue) and justice (yellow) systems within the local prison.

Figure 1: Drug Recovery Service Reorganization Located Within a Process-Linked-to-Outcomes Conceptual Framework
People caught up in the criminal justice system often face negative health and crime outcomes due to substance misuse.
1. As they engage with recovery services in prison, their health and criminal behaviour begin to stabilize and improve.
2. Drug treatment includes a continuity-of-care package for release, such as community drug treatment appointments, housing, and employment services, which are managed by integrated service practitioners.
3. Continued engagement with the recovery system after release improves health outcomes and reduces criminal activities.
4. Relapses may lead individuals to repeat this cycle.
Method
We conducted a data quality audit to create a model matching client identifier (initials, date of birth in ABYYYYMMDD format) across the prison and community drug treatment services. Release data came from the DIRWeb database, and community engagement data from the NDTMS. We tracked prison leavers with or without continuity-of-care for twelve months post-release. Data were analysed using a series of Kaplan-Meier Survival Analyses. The study’s reported continuity-of-care performance was compared to the Public Health Outcomes Framework indicator C20 – Adults with substance misuse treatment needs who successfully engage in community-based structured treatment following release from prison [24].
The SQL-coded data cleansing and matching algorithm employed deterministic programming principles. Grouping queries were utilized to compare characters in the client identifier string for similarity. Suspect records underwent manual verification using the in-house prison, DIRWeb, and NDTMS systems. Final corrections were made only after confirming the record's identity through all three systems. The final matched data set included the client identifier, first release date, source of release, continuity of care status (yes/no), prison reception date, and post-release treatment start date. Instances where clients returned to prison before the treatment start date were excluded.
Utilizing right-censored Kaplan-Meier Survival Analyses (Log- rank) whereby individuals not engaging with the community drug treatment service were assigned a waiting time of 365 days, data were processed in three stages [32]. Firstly, a system-level count established the outputs supporting the testing of (H1). Secondly, a service configuration/prison referral source analysis identified the constituent pathways into the local drug recovery system. And lastly, to test H2, a comparative survival analysis of the single and twin types of service configurations was conducted.
Results
A total of 808 individuals were released to the local partnership during the four-year study period. Three groups were identified:
1. 278 people (34.4%) were released from the local prison with single service provision during study years three and four,
2. 255 people (31.6%) were released from the local prison with twin service provision during study years one and two, and
3. 275 people (34.0%) were released from prisons external to the study Recovery Partnership via the single service provision during study years three and four (Table 1).
|
Service Configuration (Referral Source) |
N (%) |
Continuity of Care |
Treatment Engagement (%) |
Kaplan Meier Analyses |
|||
|
Yes |
No |
Average Time in Days to Treatment |
Long Rank X2(p) H1 |
Long Rank X2(p) H2 |
|||
|
Single (local) |
278(34.4) |
Yesa |
35(12.6) |
81 |
67 |
14.1(<.0001) |
2.8(0.09) a |
|
Nob |
21(7.6) |
141 |
130 |
||||
|
Twin (local) |
255(31.6) |
Yesa |
14(5.4) |
56 |
97 |
10.1(<.001) |
|
|
Nob |
12(4.7) |
173 |
157 |
||||
|
Single (other) |
275(34.0) |
Yes |
51(18.5) |
126 |
37 |
4.1(<.05) |
4.1(<.05) b |
|
No |
18 (6.5) |
80 |
84 |
||||
|
System (total) |
808 |
Yes |
100(12.4) |
263 |
57 |
36.2(<.00001) |
|
|
No |
51(6.3) |
394 |
120 |
||||
Table 1: Kaplan Meier Survival Outputs Describing Those Leaving Prison with and without Continuity-of-Care and Engaging or Otherwise with the Community Drug Treatment Services
System Level H1
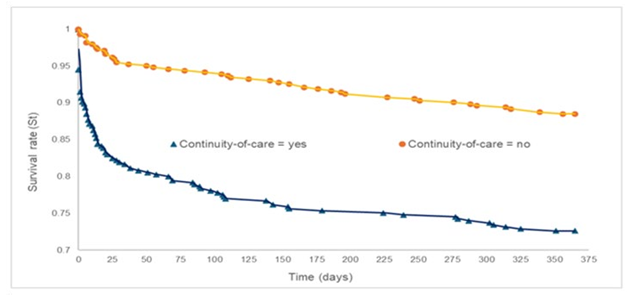
Of the 808 individuals, 151 (18.7%) engaged with community drug treatment services within 365 days of their initial release. Of these, 100 (12.4%) participated in a continuity-of-care intervention, and 51 (6.3%) did not. The average waiting (survival) times were 57 and 120 days, respectively. The observed frequencies and means were statistically significant compared to those expected (X2 = 36.2, p <.00001). Survival curves for both groups are presented in Figure 2.

Figure 2: Kaplan Meier Analysis Describing Incidence and Waiting (Survival) Times to Treatment Engagement, with and Without Continuity-of-Care. In Essence, the Less Area Under the Curve the Fewer Waiting Times for Treatment
Service Level – Single (Local) H2
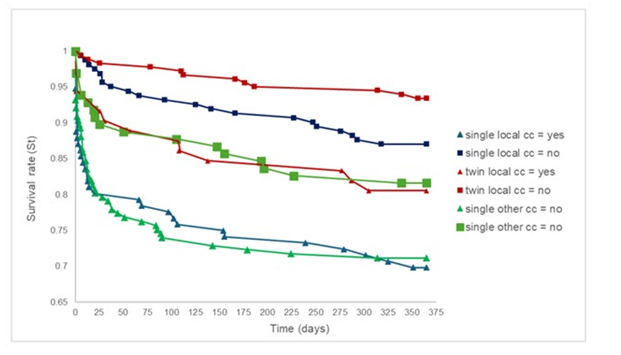
Of the 255 individuals, 56 (20.2%) engaged with community drug treatment services within 365 days of their initial release. Of these, 35 (12.6%) participated in a continuity-of-care intervention, and 21 (7.6%) did not. The average waiting (survival) times were 67 and 130 days, respectively. The observed frequencies and means were statistically significant compared to those expected (X2 = 14.1, p <.0001). Survival curves for this group are presented in Figure 3.
Service level – Twin (local) H2
Of the 278 individuals, 26 (10.1%) engaged with community drug treatment services within 365 days of their initial release. Of these, 14 (5.4%) participated in a continuity-of-care intervention, and 12 (4.7%) did not. The average waiting (survival) times were 97 and 157 days, respectively. The observed frequencies and means were statistically significant compared to those expected (X2 = 10.1, p
<.001). Survival curves for this group are presented in Figure 3.
Service Level – Single (Other)
Of the 275 individuals, 69 (25.0%) engaged with community drug treatment services within 365 days of their initial release. Of these, 51 (18.5%) participated in a continuity-of-care intervention, and 18 (6.5%) did not. The average waiting (survival) times were 37 and 84 days, respectively. The observed frequencies and means were statistically significant compared to those expected (X2 = 4.1, p <.05). Survival curves for this group are presented in Figure 3.

Figure 3: Kaplan Meier Survival Plots Describing Incidence and Waiting (Survival) Times to Treatment Engagement, with and Without Continuity-of-Care for All Three Sub-System Groups
Local System Performance within the National Context
The performance metrics for local, matched area, and national continuity-of-care, as reported through statutory mechanisms, showed consistent improvement over the four-year study period. At the end of year one, the percentage performance returns were 27% for the study, 30% for the matched area, and 24% for the national system. By the end of year four, these figures had increased to 68%, 77%, and 47% respectively (Table 2).
|
Prison type (context) |
Prison-to-Community Drug Treatment Engagements (%) |
|||
|
Year 1 |
Year 2 |
Year 3 |
Year 4 |
|
|
Local (study) |
113 (27%) |
171 (45%) |
238 (59%) |
169 (68%) |
|
Local (matched) |
99 (30%) |
73 (22%) |
161 (60%) |
95 (77%) |
|
National (system) |
6544 (24%) |
7894 (34%) |
10159 (42%) |
6396 (47%) |
Table 2: Local Provision of Prison-To-Community Continuity-of-Care Compared to the National and a Similar Recovery Partnership’s Statutory Performance Returns
Discussion
• H1 Accepted: Within our local context and perhaps not surprisingly, continuity-of-care for prison leavers was significantly associated with increased engagement with the community drug treatment services and shorter waiting times. Nearly twice the number of individuals engaged with the community drug treatment service via continuity of care, in less than half the average waiting time, compared to those who did not receive the intervention. An unexpected and welcome finding was the emergence of the successful route into our recovery partnership from prisons external to our system. This historically difficult-to-manage care pathway appears to have been strengthened with the introduction of the reconfigured service delivery model.
• H2 Rejected: While we noted a doubling in rates of continuity- of-care and treatment engagements, as well as a one-third reduction in average waiting times for community drug treatment, the small sample size prevented us from demonstrating that the introduction of the single service provision had a statistically significant impact on these measures.
Both prison and community treatments are essential for positive health and crime outcomes [33-38]. While there have been continuous improvements in prisoner continuity-of-care, as documented through the PHOF Fingertips reporting system and supported by guidance from the Office for Health Improvement and Disparities ensuring effective continuity of care from prison to community remains a challenge for many recovery partnerships [20,39,40]. The impact of austerity measures has been especially pronounced within the prison system [41,42]. Additionally, focus has been partially diverted to other priorities within the prison service and the NHS [43,44]. As a result, opportunities and incentives to advance and test the described service delivery model have been limited. Nonetheless, with the recent change in the UK's political landscape, there may be potential for national policy strategists and commissioners to re-emphasize integrated commissioning models of this nature [45].
Conclusion
Within our local setting, we have confirmed our assumption that prison-to-community continuity-of-care increases rates of treatment engagements and reduces waiting time. And whilst we were unable to demonstrate statistical evidence to support H2, within the context of service delivery performance, our a priori decision to reorganize the service provision of the prison-to-community continuity-of-care pathway, based on strategic commissioning and systems thinking, appears to have been justified. Importantly, our work led to the introduction of the NDTMS into the English and Welsh prison estates thereby harmonizing prison drug treatment to the community systems [46].
Acknowledgments
Gill Green & David Pevalin, Ethical approval (ref 12/EE/0074) for this study was granted by NHS Research Authority – Eastern Region.
References
1. National Institute for Health and Care Excellence. (2014). Continuity of care.
2. National Treatment Agency. (2009b). Continuity of Care Guidance. In. London: The Department of Health.
3. National Treatment Agency. (2009a). Breaking the Link.
4. National Treatment Agency. (2012a). Crime halved once drug addicts are on the road to recovery.
5. National Treatment Agency. (2012b). Estimating the crime reduction benefits of drug treatment and recovery.
6. National Treatment Agency. (2012c). The impact of drug treatment on reconviction.
7. National Treatment Agency. (2012d). Value for Money Presentation: Treat addiction, cut crime. London: NTA.
8. Grace, S., Page, G., Lloyd, C., Templeton, L., Kougali, Z., McKeganey, N., ... & Russell, C. (2016). Establishing a ‘Corstonian’continuous care pathway for drug using female prisoners: linking Drug Recovery Wings and Women’s Community Services. Criminology & Criminal Justice, 16(5), 602-621.
9. Lloyd, C., & Page, G. (2015). Drug Recovery Wing (DRW) Pilots Evaluation.
10. Scaggs, S., Bales, W. D., Clark, C., Ensley, D., Coltharp, P., & Blomberg, T. G. (2016). An assessment of substance abuse treatment programs in Florida’s prisons using a random assignment experimental design. Report submitted to the National Institute of Justice Office of Justice Programs US Department of Justice. Florida, US: The Florida Department of Corrections and Florida State University College of Criminology and Criminal Justice.
11. Price Waterhouse Coopers. (2008). Government and Public Sector Consulting. Report to the Department of Health and Ministry of Justice: Review of Prison-Based Drug Treatment Funding.
12. National Treatment Agency. (2009d). Seven Partnerships in England have been awarded Drug Systems Change Pilot status.
13. Westminster Drug Project (2010). “New Service to Reduce Drug Related Crime in Essex”.
14. Edwards, B., Gunn, J., Kilgour, J., & Smith, R. (1985). Cooperation between the prison medical service and the NHS: a conversation. British Medical Journal (Clinical research ed.), 291(6510), 1698.
15. Gulland, A. (2010). Continuity of health care for prisoners on release in England is worsening. BMJ, 340.
16. MacDonald, M., Williams, J., & Kane, D. (2012). Barriers to implementing throughcare for problematic drug users in European prisons. International Journal of Prisoner Health, 8(2), 68-84.
17. Dyer, W., & Biddle, P. (2013). Prison Health Discharge Planning- Evidence of an Integrated Care Pathway or the End of the Road. Social Policy and Society, 12(4), 521 532.
18. The All-Party Parliamentary Drugs Misuse Group. (1998). House of Commons - Home Affairs - Appendices to the Minutes of Evidence
19. Home Office. (2004). Reducing Re-offending: National Action Plan. London: Home Office
20. HM Inspectorate of Probation, H. I. o. P. (2016). An Inspection of Through the Gate Resettlement Services for Short-Term Prisoners.
21. National Treatment Agency. (2008). Health care professionals and partners: NDTMS.
22. National Treatment Agency. (2009c). NDTMS.net.
23. North East Public Health Observatory. (2001). About the NDTMS.
24. Public Health England. (2015). National Drug Treatment Monitoring System (NDTMS) Adult drug treatment business definition.
25. Home Office. (2007). Drug Interventions Record: Completion Guidelines & Business Rules for the Drug, Interventions Record suite of forms, Field by Field Guidance. Retrieved from
26. Prisons and Drugs Misuse. Retrieved from London: UK Government. (2021).
27. Black, D. C. (2021). Review of drugs part two: prevention, treatment and recovery: annexes. UK: Report for the Department of Health and Social Care.
28. Forrester, J. (1968). Principles of Systems (2nd ed.). Waltham, MA: Pegasus communications.
29. Forrester, J. (1971). Principles of systems : text and workbook, chapters 1 through 10 (2nd preliminary ed. ed.). Cambridge, Mass.: Wright-Allen Press ; Cambridge.
30. Checkland, P., & Scholes, J. (1999). Soft systems methodology in action. John Wiley & Sons.
31. Checkland, P. (Writer). (2012). On the origins of SSM. In LancasterManagement (Producer), Systems Colloquium in honour of SSM founder Peter Checkland. Lancaster: Lancaster University.
32. Statistics Kingdom. (2025). Kaplan Meier Survival Analysis: Kaplan Meier and Log Rank
33. Aspinall, E. J., Mitchell, W., Schofield, J., Cairns, A., Lamond, S., Bramley, P., ... & Hutchinson, S. J. (2016). A matched comparison study of hepatitis C treatment outcomes in the prison and community setting, and an analysis of the impact of prison release or transfer during therapy. Journal of viral hepatitis, 23(12), 1009-1016.
34. Evans, C., Forrester, A., Jarrett, M., Huddy, V., Campbell, C. A., Byrne, M., ... & Valmaggia, L. (2017). Early detection and early intervention in prison: Improving outcomes and reducing prison returns. The Journal of Forensic Psychiatry & Psychology, 28(1), 91-107.
35. Garnick, D. W., Horgan, C. M., Acevedo, A., Lee, M. T., Panas, L., Ritter, G. A., ... & Wright, D. (2014). Criminal justice outcomes after engagement in outpatient substance abuse treatment. Journal of substance abuse treatment, 46(3), 295-305.
36. Gossop, M., Trakada, K., Stewart, D., & Witton, J. (2005). Reductions in criminal convictions after addiction treatment: 5-year follow-up. Drug and alcohol dependence, 79(3), 295-
302.
37. Strang, J., Finch, E., Hankinson, L., Farrell, M., Taylor, C., & Gossop, M. (1997). Methadone treatment for opiate addiction: benefits in the first month. Addiction Research, 5(1), 71-76.
38. Yang, Y., Knight, K., Joe, G. W., Rowan-Szal, G. A., Lehman, W. E., & Flynn, P. M. (2013). The influence of client risks and treatment engagement on recidivism. Journal of Offender Rehabilitation, 52(8), 544-564.
39. Guidance for improving continuity of care between prison and the community (2018). Retrieved from London: UK Government. (2021) Guidance for improving continuity of care between prison and the community - GOV.UK
40. Public Health Outcomes Framework. (2025). Public Health Outcomes Framework - Data | Fingertips | Department of Health and Social Care.
41. Chief Inspector of Prisons. (2015). HM Chief Inspector of Prisons for England and Wales Annual Report 2014–15.
42. The Full Fact Organisation. (2017). The state of prisons in England and Wales.
43. BBC. (2017). Prison officers in 31 jails set for pay rises of up to £5,000.
44. Cambell, D. (2016). NHS hospitals in England reveal £2.45bn record deficit.
45. Bailie, R., & Elliot, K. (2016). Offender Health: Partnerships for Excellence. London.
46. From Harm to Hope: A 10-year drugs plan to cut crime and save lives.


