


Research Article - (2024) Volume 2, Issue 5
Analysis of the Characteristics of Wind Power and Topography Influence on it, with an Approach to Renewable Energy Generation (Synoptic Meteorological Stations of Mazandaran Province - Northern Iran)
2Department of Geography, Islamic Azad University of Nour, Iran
Received Date: Sep 03, 2024 / Accepted Date: Oct 09, 2024 / Published Date: Dec 20, 2024
Copyright: ©©2024 Khabat Derafshi, et al. This is an open-access article distributed under the terms of the Creative Commons Attribution License, which permits unrestricted use, distribution, and reproduction in any medium, provided the original author and source are credited.
Citation: Derafshi, K., Motevalli, S., Bairamvand, R., Ghobadi, G. R. J. (2024). Analysis of the Characteristics of Wind Power and Topography Influence on it, with an Approach to Renewable Energy Generation (Synoptic Meteorological Stations of Mazandaran Province - Northern Iran). Eng OA, 2(5), 01-21.
Abstract
There has been a growing demand for energy in the province of Mazandaran in recent years. Considering the capabilities of the province to generate new energy, recognizing and consuming wind energy as a source of renewable energy should be a planning priority. In this study, a statistical analysis of daily wind speed and direction at a height of 10 m in 15 synoptic meteorological stations of Mazandaran Province over a 12-year period (2006 to 2017) was conducted to provide a preliminary estimate of the extractable energy and spatial capacity of wind flow. In addition, the characteristics of wind speed and direction, Weibull probability distribution parameters and wind power potential and density of the stations were also determined. ArcGIS interpolation method (IDW) was used to prepare the calculated layers of the average speed, speed continuity, and power density of the wind at 10, 30, and 50 m heights. Furthermore, to examine the influence of topography on the wind variables, the Pearson correlation coefficient was used to evaluate the relationship between altitude, hillslope aspect, and slope indicators with each of the wind variables. A map of wind speed zones at 50 m height reveals that Baladeh station has a maximum wind speed in July. The correlation coefficient between wind speed and altitude above sea level was 0.677, indicating a 95 percent positive correlation (P-value 0.05). Accordingly, as the altitude of the meteorological stations in the province above sea level increases, the wind speed increases at a height of 10 meters above the ground.
Keywords
Renewable Energy, Topography, Wind Power Density, Wind Turbine, Mazandaran Province
Introduction
Energy sources, which supply 70% of the world's needs as fuel and uranium fission models, will run out by the end of this century and could clearly cause numerous concerns for humans [1,2]. The depletion of fossil and nuclear energy sources has long stimulated the scientists and authors interest. As a result, extensive researches are being carried out all over the world to replace new and cleanlysources of energy [3-11]. Moreover, rising carbon dioxide and other greenhouse gases released by the burning of fossil fuels has threateningly caused unprecedented changes in the earth climate [12]. Consequently, there is a widespread agreement to reduce carbon emissions to zero in long-term.
More than a billion people, about 15% of the world's population, still have no access to electricity [13]. The population of the world is expected to double by the end of the twenty-first century, leading to a two-to-fourfold increase in energy consumption. Currently, the challenge is to meet this enormous energy demand with clean, safe, and sustainable energy sources. Governments are spending a lot of resources to generating just one kilowatt of electricity, so the question is how to reduce consumption and provide cheaper energy. Despite the fact that new energy sources are virtually carbon-free and typically more sustainable than fossil and nuclear fuels, not all of their technologies have developed, and some are still prohibitively expensive [11,14-17]. In general, renewable energy sources play an important role in climate change adaptation. Consequently, they contribute to increase the flexibility of current energy systems and ensure the supply of energy services under changing climatic conditions [6,18-22]. One of the most costeffective sources of renewable energy is wind power. In addition to low price fluctuations, it offers minimal environmental impact, abundance, and permanence, among other benefits. The first step in expanding the use of wind energy is to identify areas where wind energy can be optimally exploited and which offer the necessary conditions for the construction of power plant [19,23- 26,21,22]. It is important to pay special attention to all the features and environmental conditions that affect the airflow in wind power generation [18, 27-29].
The behavior of meteorological phenomena under environmental constraints leading to complicated mechanisms has received less attention in the research of Iranian meteorologists and meteorologists, especially in mountainous regions. Environmental characteristics such as altitude, slope, and hillslope aspect have an important influence on the behavior and atmospheric elements. Wind, as the most influential meteorological phenomenon, has an impact on topographic landscapes. This is evident in the different behavior of winds in mountainous and topographic systems, and in the effect of mountain topography on the generation of different types of winds [30,31]. The annual average of net energy achieved and the capacity factor, which have significant variations in the distribution of wind speed, are indicator parameters for indicating wind energy potential in specific geographical locations [20,31-34].
Notwithstanding the economic development of the country and the improvement of public welfare in Iran, the way energy resources are exploited has raised concerns about the level of energy consumption and greenhouse gas emissions. Therefore, it is desirable to promote the use of renewable energy sources for the development process of Iran. Due to wind resources and topographical conditions, wind energy occupies a special place as a form of renewable energy in Iran. Therefore, this study investigated the spatial capacity of wind power in Mazandaran Province as a case study. In this contribution, the aim of the research is to assess the energy and evaluate the wind potential as well as to create zone maps with indicators of speed and energy production in order to find a suitable place for building power plants in the windy regions of Mazandaran Province.
Regional Setting
Mazandaran Province, with an area of 23,756 km2, occupies about 1.46% of Iran, ranking 18th in land area. It lies between latitudes 35° 47′ to 36° 54′ N and longitudes 50° 34′ to 54° 10′ E (Figure 1).
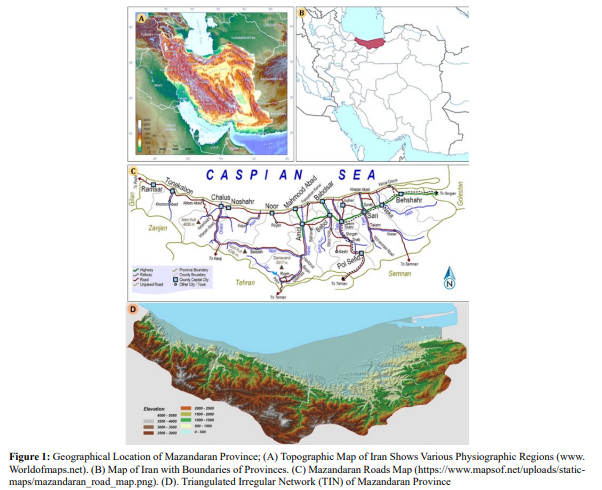
Mazandaran Province has a high potential for extractable energy and spatial capacity of wind flow. This province is characterized by a particular topography (from -26 to over 2500 m altitude), a northern hillslope aspects and prevailing winds from west to northwest to north, all of which provide the conditions for wind energy evaluation and spatial capacity. The increase of population in Mazandaran Province as well as its development as the first tourism hub in Iran have drastically reduced the capacity of the province in terms of environmental resources utilization. Therefore, it is necessary to zone different regions of the province, focus on topographical conditions and identify areas suitable for wind turbine construction in order to exploit the wind power potential and meet the replacement demand for cheap renewable energy instead of expensive fossil fuels.
Local Winds (Sea Breeze/Land)
The southern coasts of Caspian Sea are subjected to synoptic/ mesoscale weather systems ranging from locally enhanced sea breeze formation and small local front systems to synoptic scale cyclones [35]. Due to Caspian Sea less width and depth than the oceans and a little temperature difference compared ocean environment, its daily meteorological characteristics has caused that the maximum advance of the sea breeze toward the land may not extend up in long distances. Temperature difference between shore and sea breeze front determines the depth of the sea breeze and its distance. So that at times when the temperature difference between the shore and the sea breeze front is not observed, the depth of the sea breeze and its progression is less than when the difference becomes more.
Regional winds prevail in the cold season (activity expansion in November, December, January, February and March) and local winds prevail in the warm season (expansion activity in June, July and August). Western waves are the most important atmospheric systems affecting the formation of regional winds on the Mazandaran coast. In the warm season, the spread of the Azores or North African high-pressure tongue over the study area provides favorable conditions for local wind activity. A typical sea breeze cycle in the southern Caspian is characterized by onshore winds (the “sea breeze”) generally starting more than 2 h after sunrise at around 9:00–noon [36-39]. The wind direction changes to offshore (the “land breeze”) around 16:00-21:00. The maximum wind speed of about 4 m/s-1 occurs during the sea breeze between noon and 16:00 after the time of maximum temperature gradient between sea and land. The strongest and most frequent sea breeze days occur in areas around AmirAbad where the Mazandaran coastal plain is widest, and the fewest sea breeze days are observed around Noshahr [36,38]. In the southern Caspian Sea, the sea breeze system, with winds of up to 4 m/s-1 and wind stresses of up to about 0.02 N/m-2 (but on average peaking at 2 m/s-1 and less than 0.01 N/m-2), is the major diurnal-inertial-period process in the atmosphere, explaining about two-thirds of high frequency variance in winds and hence dominating the forcing of coastal processes at high-frequency [39].
Methodology
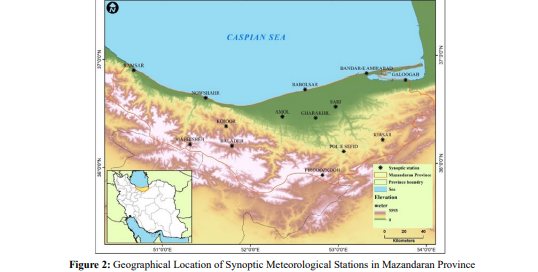
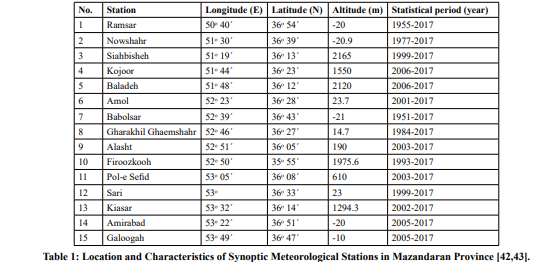
A descriptive, analytical and field approach is used in this study. The spatial capability of wind energy in Mazandaran Province was evaluated using spatial and quantitative data. Wind speed and direction data from 15 synoptic meteorological stations in the province were examined to determine the spatial capability of wind energy. These stations (Table 1; Figure 2) include Ramsar, Nowshahr, Siahbisheh, Kojoor, Baladeh, Amol, Babolsar, Gharakhil-e Ghaemshahr, Pol-e Sefid, Alasht, Firoozkooh, Sari, Kiasar, and Bandar-e Amirabad. Due to vector variable behavior of wind and the influence of local and atmospheric parameters on its direction and speed, reconstruction of wind data is either impossible or fraught with uncertainty.
Since the windy statistical periods were not the same at all stations, the range of years with a common statistical period was considered over the 12 years (2006 to 2017). The wind speed and direction characteristics and Weibull probability distribution function parameters, were evaluated after quantitative and qualitative data control. Then, the wind power potential and density of the studied stations in the province were calculated at different heights. The Weibull probability distribution function: this function is generally used to represent the frequencies of the wind speed. It also represents the most frequent starting point of stochastic analysis, simulation, and forecasting of wind speed. Its general formulation is given as follows (equation 1).

Where the parameters f(v) probability of occurrence of wind speed (m/s) v is the wind speed (m/s), and c and k are the scale (m/s) and shape (unitless), respectively. As the names imply, the k changes the shape of the curve and not the dimensions, whereas c shifts the curve toward high or low wind speeds. These two parameters must be identified for each given location. Their identification can be performed with use of some classic techniques such as the minimum square error, the least squares method, and the standard deviation method that were calculated here using the maximum likelihood method (equations 2 and 3; Akpinar et al. 2005) [40].
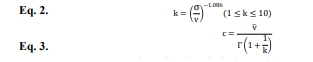
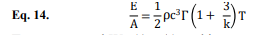
Where k is the Weibull shape factor (unitless), v is the wind speed (m/s) and σ is the standard deviation and is the mean wind speed (in meter per second) and Γ is the Gamma function. The mean wind speed () is (equation 4). It is based on the numerical iteration of mean wind speed () andstandard deviations (σ) of wind speeds are expressed, where:

Calculation of wind power potential: the power of wind energy is directly related to the cube of wind speed (equation 5)

Where ρ\rho is the standard air density (kg/m^3) at sea level with an average temperature of 15°C and a pressure of one atmosphere (1.225), and Av is the average wind speed [41]. According to the International Standard Atmosphere (ISA) values (15° C at sea level) the density of dry air is 1.225 kg/m^3 at 15.55°C and 101,325 Pa. Since the air density is a function of the altitude (and temperature), the temperature deviation from the ISA value at that pressure altitude needs to be corrected, with lower temperatures than standard lowering the density altitude and higher temperatures raising the density altitude which considered in the calculations. Accordingly, the ρ\rho of the synoptic stations was found as the following table (Table 2). This table illustrates ρ\rho of the stations calculated using the measured data (average annual of air temperature, air humidity, biometric pressure and altitude) and following equations (equations 6 and 7):
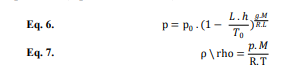
Where p (Pa) is the pressure at altitude, p0 (Pa) is the sea level standard atmospheric pressure, T0 (k) is the sea level standard temperature, g (m/s2) is the Earth-surface gravitational acceleration, L (K/m) is the temperature lapse rate, R (J/(mol.K) is the universal gas constant, M (kg/mol) is the molar mass of dry air and ρ\rho (kg/m^3) is the air density at altitude.

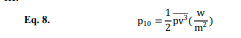
Equation 8 provides the calculated wind energy power at a height of 10 m.
Wind speeds at upper hights are estimated using equations 9 and 10 (a height of 40 m is suitable for building wind turbines, for example).

Where v nad vref are the wind speed at height z above the ground (wind speed at the desired height), the wind reference speed measured at height zref (wind speed at a height of 10 m), respectively, and α is as a function of the degree of unevenness of the earth's surface (calculated using equation 11).

Average Wind Power Potential: is calculated with equation 10 during the windy period

Where i is the measured 3 hours wind speed, ρ\rho is the standard air density (1.225), v is the wind speed (m/s), W is the amount of energy in joules and N is the total data per year, respectively. In addition, based on the measured wind speed, the wind power or energy potential can be calculated by analyzing the Weibull distribution and equation 13.
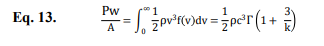
Where Pw refers to the energy obtained, ρv refers to the power curve of wind turbine.
Wind power density: the amount of it can be calculated using equation 12 for a given site
Extractable Energy Estimation: given the threshold of the 660 kW, (4 m/s) turbines and considering the threshold of wind speed at a height upper than 40 m, the amount of extractable energy and its confidence percentage are calculated and estimated.
Wind Variability: since the continuity and stability of wind crucial for electricity power generation, the wind variability is calculated using equation 15.

In this equation, CV, , and Ï are the percentage of variability, data average and standard deviation of the data obtained from equation 16, respectively.
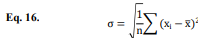
Where, Ï, xi, and n are the standard deviation, individual data, data average and the number of data, respectively.
Results and Discussion
Changes Trend of the Wind Speed and Direction
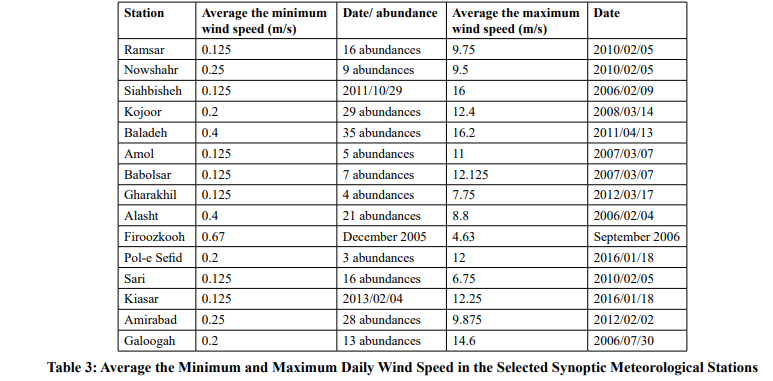
The study examined wind data from 15 synoptic meteorological stations over a 12-years period (2006 to 2017). It was found is 6 stations, February has the highest average daily wind speed. Afterwards, March has the highest value of maximum daily wind speed at the studied stations with 4 frequencies (Table 3).
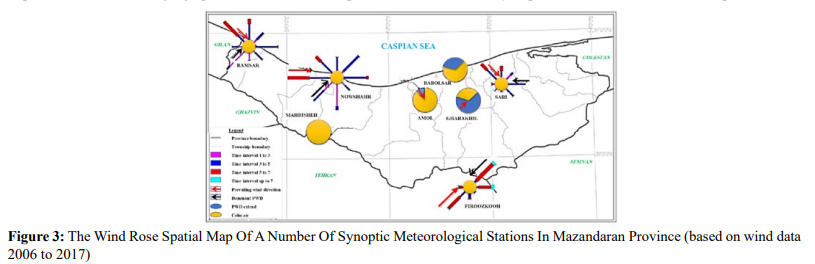
However, west direction is the prevailing wind in Mazandaran plain and its coastal strip and generally in all seasons and even during most months of the year. The main wind direction changes several times due to local pressure center. However, eastern to northeastern winds generally tend to prevail. Meanwhile, the northern wind has the lowest frequency of wind flows (Figure 3). This shows that the impact of lands and other geographical factors due to temperature fluctuations is more than the Caspian Sea. In different seasons, a local and relatively limited low-pressure center is formed in the central areas of the Caspian Sea, which acts as a suction center for wind flows from the surrounding area. Consequently, winds from the north are weak. While the winds flow from the sea to the land, under local conditions, can only be perceived as local winds with a limited intensity of penetration into the Mazandaran plain.
In winter, the pattern of wind flow in Mazandaran coastal plain is mainly influenced by western currents, which account for 17.93% of the total. Moreover, the second prevailing wind flows from the east, accounting for 11.65% of all data. Wind frequency in other geographical aspects is generally insignificant in winter. In the spring, the frequency of calm wind is 29.62%, while the western wind prevails with a frequency of 14.66 %. The second prevailing winds are northeast currents. Also, the strongest and highest winds accompanied by northwest winds direction with speeds between 5 and 7 m/s. In this season, the southeast wind has the lowest frequency of 3.68 %. In summer, the wind flow pattern is such that there is an average of 34.88 % calm air. As to frequency, the western and southern winds are the prevailing and second prevailing winds. Accordingly, the strongest wind flows from the west at a speed of 5 to 7 m/s. In most cases, there is calm wind in autumn, with a frequency of 37.87 % compared to other seasons. In autumn, the prevailing and strongest winds are western, while the second prevailing winds are from the south. Moreover, the autumn is the season with the lowest frequency of northern wind flows, with a frequency of 2.79%. According to the daily wind data, the air condition of coastal plains is calm with a frequency 34.21% of the year and other times winds flow from different directions. Two groups of winds produce a breeze with a weak flow, one with an average speed of 1 to 3 m/s and a frequency of 15.4 %, and the other with an average speed of 3 to 5 m/s and a frequency of 39.8 %. About 10.58 % of the winds have an average speed of 5 to 7 m/s which includes a series of relatively strong winds. Throughout the year, western winds were the prevailing wind direction and southwestern winds were the second prevailing wind direction, with a frequency of 14.48 % and 9.0 %, respectively. Southeast winds, on the other hand, had the lowest flow amount with the frequency of 3.99%.
Figure 4 shows the wind rose of a number of synoptic meteorological stations in Mazandaran Province. The prevailing winds at Amirabad and Galoogah stations, which are located in the coastal and plain regions and are influenced by the general currents of the region, have western and southwestern currents.
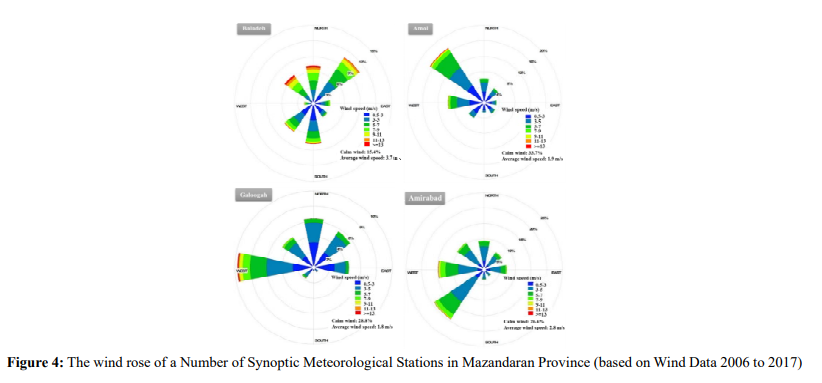
In Amirabad station, there is calm air in 29.8% of the year, while for the rest of the time, there is wind flow. Due to the northern wind currents, Amol station, which is located in coastal plain area, has the northwestern wind prevailing. At Baladeh station, which is located on a high and mountainous area, the northeastern wind direction is prevail. Moreover, the air is calm in 19.83% of the year and the wind does not flow, but 80% of the year the wind flows, which is one of the positive properties of Baladeh region.
Frequency and Continuity of the Wind Speed Values
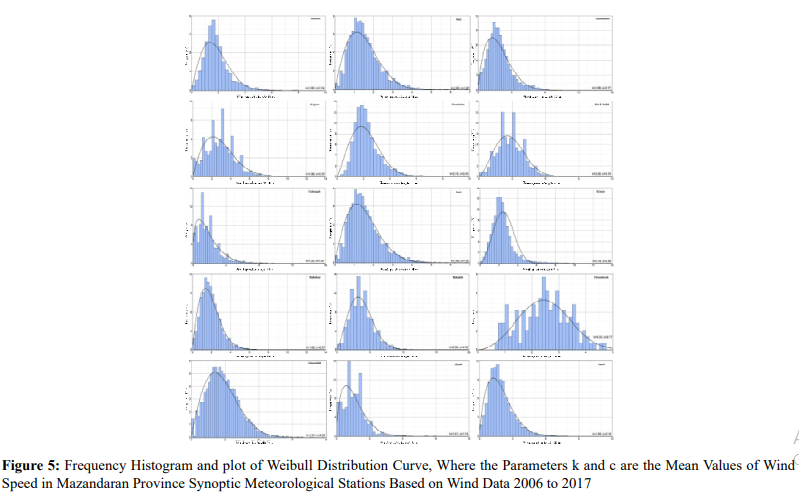
The average hourly continuity values of monthly and annual winds in different speed categories were calculated. It is obvious that the total hours of wind continuity in different speed categories in each year also as an average in each statistical period will be equal to 24×365=8760 hours. The curves and histograms of wind frequency distribution refer to a height of 10 meters above the ground. Figure 5 shows the frequency histogram and plot of Weibull distribution curve with the k and c parameters of wind speed mean values in Mazandaran Province synoptic meteorological stations from 2006 to 2017. Frequency - speed histograms are primarily characterized by their positive skewness. A positive skewness indicates a low frequency of high-speed winds, which is unfavorable for the exploitation of wind energy. Values of skewness that are close to zero or negative indicate a higher frequency of high-speed winds, which can be considered more suitable for wind energy exploitation. Therefore, the highest skewness is calculated for Ramsar, Nowshahr, Kiasar, Amol, and Babolsar stations, and the lowest for Baladeh and Kojoor stations. Baladeh station has the highest frequency of wind values with speeds above 3 m/s and the highest values of parameters k and c among the 15 stations studied in Mazandaran Province. The conditions at Baladeh station are favorable for turbine installation, which makes it an ideal site for the construction of a wind power plant. Accordingly, Kojoor, Pol-e Sefid, Sari, Amirabad, Siahbisheh, and Firoozkooh stations with the abundance of wind speed values in the categories more than 3 m/s are considered as other suitable locations for the construction of small wind turbines that could be used for special activities. However, due to the abundance of low winds and lack of suitable wind conditions, other stations such as Alasht, Amol, Babolsar, Galoogah, Kiasar, Nowshahr, and Ramsar cannot be considered for the construction of a power plant on a priority basis.
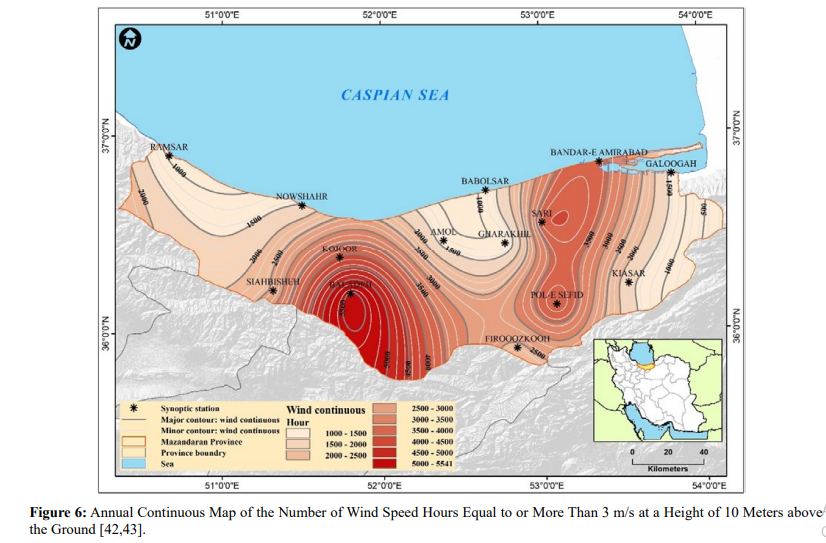
The map was prepared using the total continuous wind hours at a speed of 3 m/s ore more (Table 4), which is considered the minimum threshold speed for wind turbine construction (Figure 6). Accordingly, an optimal condition for wind turbine construction was observed at Baladeh station with wind continuity at a height of 10 m above the ground (5548 hours and a frequency of 63.3%) and a speed equal to or greater than the mentioned threshold. Kojoor, Pol-e Sefid, Sari, and Amirabad stations also have relatively favorable conditions for the construction of some wind turbines, with duration of 4048, 3932, 3868 and 3640 hours, and frequency of 46.2, 44.9, 44.2, and 41.6 %, respectively. On the other hand, Alasht, Gharakhil-e Ghaemshahr, Amol, Babolsar, Firoozkooh, Galoogah, Kiasar, Nowshahr and Ramsar stations have low abundance values of winds continuity of more than 3 m/s, which makes them unsuitable for wind turbine installation and power plant construction [42,43].
Generally, Mazandaran Province can be spatially divided into two parts in terms of suitable conditions for the use of wind energy. One is unsuitable area for wind turbine installation due to constant winds with a minimum threshold, include: the western parts of the province such as Ramsar, Tonekabon, and Chaloos Townships, the east of Behshahr, Neka, and Sari Townships, the coastline strip of the province in the townships of Nowshahr, Noor, Mahmoudabad, Babolsar, and Jooybar and the plain parts of the province in townships of Ghaemshahr, Babol, and Amol. On the other hand, the foothills and highlands of Nowshahr, Noor, and Amol Townships, as well as the nearby areas of Ghaemshahr and Savadkooh and the western parts of Sari, Neka, and Behshahr Townships are in a relatively favorable condition in terms of sustained winds of 3 m/s and more. According to these results, the optimal conditions for installing wind turbines are in the mountainous and highland areas of Noor Townships (especially Baladeh region).

Changing Monthly and Annually Trend of Wind Speed Average with Increasing Height
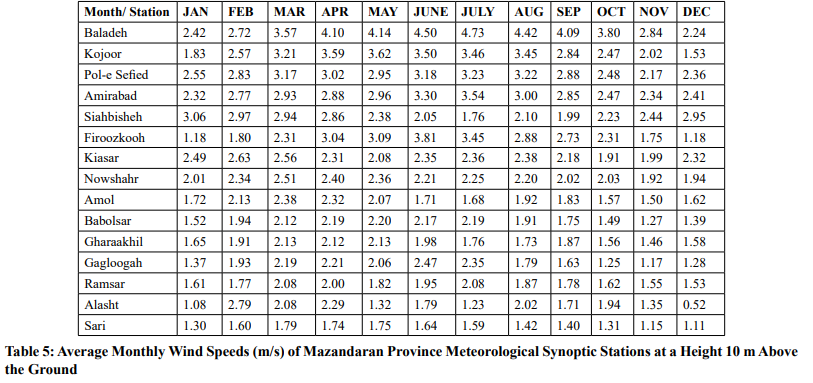
The trend of the increase in wind speed changes with increasing altitude as a function of surface roughness; thus, it is more pronounced on rough surfaces than on smooth ones. Equations 7 and 8 are used to calculate wind speed at heights greater than 10 meters above the ground. Various heights for wind turbine masts are given in scientific publications. Most commercial wind turbines have an axis height of 30 to 80 meters (Mohammadi et al. 2012; Mojarrad and Hemati 2013), and are often 50 meters above the ground. However, heights of 120, 150, and sometimes even 200 meters have also been reported [44,45]. The average monthly and annual speed values of synoptic meteorological stations in the province up to a height of 100 meters above the ground were calculated using wind speed calculations at different heights. These calculations more accurately identified areas with high and low potential for wind power generation. Table 5 shows the average monthly wind speed of the stations at a height of 10 meters above the ground. In most months of the year, the stations studied clearly do not have the wind speeds required for the installation of wind turbines. At the stations of Firoozkooh, Siahbisheh, Kojoor, Baladeh, Amirabad, and Pol-e Sefid, wind speeds of more than 3 m/s as the minimum threshold for turbine movement were measured only in some months of the year. The months number with an average wind speed of 3 m/s or more at the stations of Baladeh Kojoor, Pol-e Sefid, Firoozkooh, Amirabad and Siahbisheh is 8, 6, 5, 4, 3 and 1, respectively. Therefore, Baladeh station has the highest monthly wind speeds. Moreover, the months of March, April, May, June, July, and August have the highest average wind speeds in the study area.
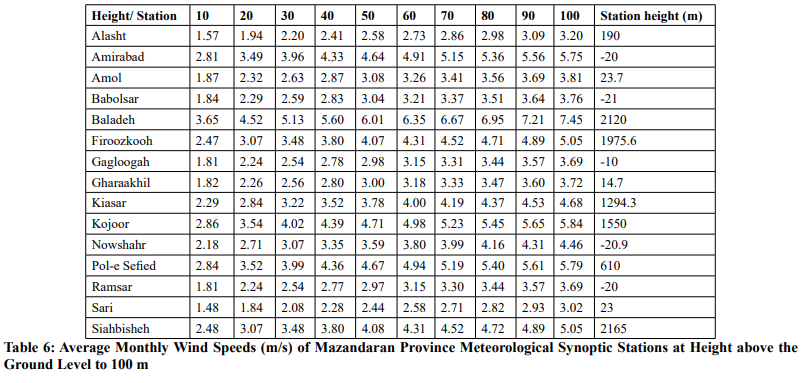
In the following, the variations in wind speed are calculated by increasing the height above the ground level to 100 meters as shown in Table 6. The minimum wind speed to start small turbines, which is usually between 3 and 4 m/s, varies depending on the type and design of turbine. Accordingly, there is only Baladeh station that has a limited possibility of extracting wind power at different heights. Firoozkooh, Siahbisheh, Kojoor, Amirabad and Pol-e Sefid stations from 20 meters above, Nowshahr and Kiasar stations from 30 meters above and Amol, Babolsar and Gharakhil-e Ghaemshahr stations from 40 meters above have limited conditions for using wind energy. Moreover, a minimum wind speed of 6 m/s, corresponding to the category IV in the classification of wind turbines based on the international standard IEC61400-1, should be considered to determine the minimum wind speed. From this point of view, only in Baladeh station, from a height of about 40 meters onwards, there is suitable conditions for the use of wind energy, and in all months of the year, the average wind speed is equal to or greater than the required threshold [42,43].
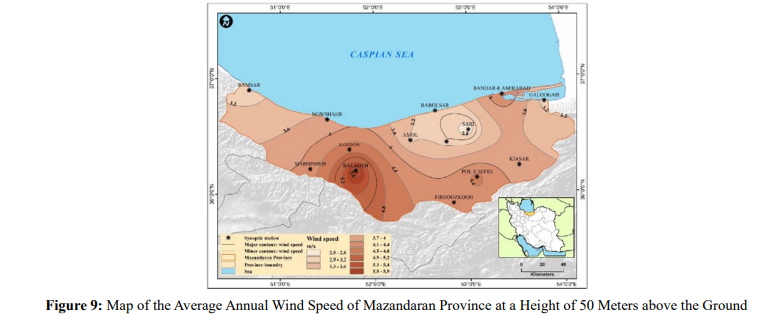
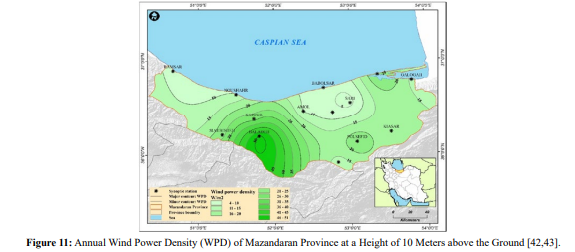
Figures 7, 8 and 9 show maps of average annual wind speed for the study area at heights of 10, 30 and 50 meters. According to the prepared maps, the maximum wind speed at different heights corresponds to the southern and mountainous parts of Noor, Amol, Nowshahr, Savadkooh and to some extent of Chaloos, which the highest amount is in the southern parts of Noor Township. The average annual wind speed is the lowest in the plain and coastal areas of Mazandaran Province, especially in Jooybar, Babolsar, Mahmoudabad, Sari, Gharakhil-e Ghaemshahr Townships, the northern parts of Savadkoohand, Babol and Amol, also the western parts of the province (Ramsar and Tonekabon) as well as the eastern parts of Behshahr and Neka Townships. Based on the map of wind speed zones at a height of 10 m in Mazandaran Province, Baladeh station has the highest wind speed compared to other stations in the province, with an average annual wind speed of 3.65 m/s and an average monthly maximum wind speed of 4.43 m/s in July. Therefore, the wind speed at a height of 10 meters is greater than 4 m/s for about 6 months of the year, indicating a favorable location wind turbine installation. Meanwhile, Firoozkooh and Kojoor stations are in the next phase in June and May with maximum monthly average wind speeds of 3.81 and 3.62 m/s, respectively. In terms of average monthly wind speed, Kojoor, Pol-e Sefid and Amirabad stations are in more favorable situation than other stations in the province after Baladeh station with 2.84, 2.84, and 2.81 m/s, respectively. Sari, Alasht, Ramsar, Galoogah, Gharakhil, Babolsar and Amol stations have the lowest average monthly wind speeds. The lowest average monthly wind speeds were recorded at Alasht station in December with 0.52 m/s and in June with 1.08 m/s. Accordingly, Sari station with 1.11 m/s in December and Galoogah station with 1.17 m/s in November have the lowest average monthly wind speeds (Figure 7).

Zoning of wind speed in Mazandaran Province at height of 30 meters above the ground shows that Baladeh station with an average wind speed 5.13 m/s has the highest average wind speed (6.64 m/s) in July, which is a good reason for windy conditions and turbine site installation. During about 8 months of the year, wind speeds of more than 5 m/s at 30 m are recorded at Baladeh station, especially during the warmer months (June to September). Winds with speeds greater than 4 m/s are measured at Pol-e Sefid and Amirabad stations for about 7 months (March to September), at Kojoor station for about 6 months (March to August), and at Siahbisheh station for about 5 months (January to April and December). During most months of the year, the average wind speed at height of 30 meters is less than 3 m/s in Sari, Alasht, Ramsar, Galoogah, Gharakhil, Babolsar and Amol stations (Figure 8).

The zoning map of wind speed at a height of 50 meters in Mazandaran Province indicates that Baladeh station has a maximum wind speed of 7.78 m/s and an average monthly wind speed of 5.98 m/s in July. Wind speeds of more than 6 m/s are recorded at the station in about 7 months of the year (April to October), especially in the warmer months. Consequently, year-round wind speeds of more than 3 m/s at a height of 50 meters above the ground at Baladeh station could indicate the presence of suitable conditions for power plant installation and power extraction. These results are consistent with previous studies by Janbaz Ghobadi (2017), that Baladeh station has the highest wind power density in Mazandaran Province [30]. After Baladeh, Kojoor, Pol-e Sefid, Amirabad, Siahbisheh, and Firoozkooh stations have better conditions for exploiting wind power potential than other stations with average monthly wind speed of more than 4 m/s. Especially, Kojoor, Pol-e Sefid, and Amirabad have wind speeds of more than 4 m/s in about 9 months of the year (February to October). Siahbisheh and Firoozkooh stations have wind speeds greater than 4 m/s in 6 and 5 months, respectively. The frequency of wind speeds of more than 4 m/s in the cold months of the year is a suitable feature for the construction of wind turbines at the above-mentioned stations. Moreover, the lowest winds with speeds of more than 3 m/s indicate the lack of suitable wind conditions and exploitation of wind power potential at Sari, Alasht, Ramsar, Galoogah, Gharakhil, Babolsar, and Amol stations (Figure 9).
Wind Power Density
Wind power density (WPD) is the quantitative amount of wind energy available at a given location. In addition to wind speed, WPD also depends on the air density at the desired height relative to sea level, which is a function of atmospheric pressure and temperature. WPD relative to wind is an important feature in the introduction and comparison of power plants because air density decreases with increasing altitude and air molecules collide less. The wind density values of the stations calculated by equation 12 and presented in Table 7 are considered as one of the parameters defining the degree of proportionality in the utilization of wind power potential. According to the data in the table also Figure 10, Baladeh station has the highest wind energy density among the studied stations. This station has a wind energy density of 51 W/ m2 at a height of 10 m above the ground, 142 W/m2 at a height of 30 m above the ground and 228 W/m2 at a height of 50 m above the ground during a statistical period. After the Baladeh station, Kojoor station has better conditions in terms of wind power density, with densities of 28, 79 and 103 W/m2 at heights of 10, 30 and 50 m above the ground, respectively. Amirabad, Siahbisheh and Pol-e Sefid stations follow in Mazandaran Province in terms of wind power density. Sari station has the lowest wind power density calculated at 10, 30 and 50 m height with 4, 8 and 12 W/ m2 respectively. Moreover, the WPD values at Alasht, Gharakhil, Ramsar and Amol stations are also low [42,43].

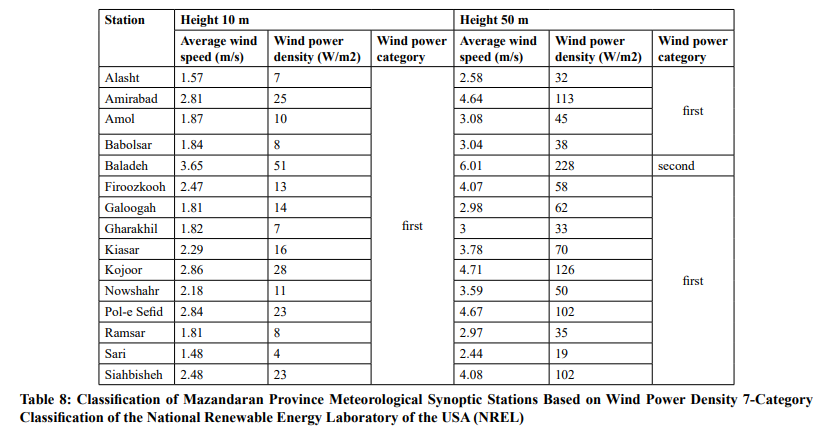
The study area is located in the lowest category in terms of wind power, namely category 1, according to the wind power classification and 7-category classification of the National Renewable Energy Laboratory of the USA (NREL). In the first category, the average annual wind speed is less than 4.4 m/s2 and the wind power density is less than 100 W/m2 at a height of 10 m. At a height of 50 m, the average annual wind speed is less than 5.6 m/s2 and the wind power density is less than 200 W/m2. Except Baladeh station, all stations in the study area belong to the first category (tables 5 and 6). Regarding Baladeh station, it is worth mentioning that the average wind speed at a height of 50 m above the ground is more than 5.6 m/s2 and the wind power density is more than 200 W/m2, which places it in the second category. However, with a height of 10 m above the ground, Baladeh station, like other stations in Mazandaran Province, belongs to the lowest category in terms of wind power (Table 8).
Based on the calculations of wind power density and comparison of annual isodensity maps of wind power at 10, 30 and 50 m above ground with the zones of wind speed maps, wind power density is directly dependent on wind speed. Moreover, the highest values of wind density are recorded at Baladeh, Kojoor, Amirabad, Pol-e Sefid, Siahbeisheh and Firoozkooh stations while the lowest values are found at Sari, Alasht, Gharakhil, Ramsar, Babolsar, Amol and Nowshahr stations. Figure 11 shows the zonal map of wind power density of meteorological stations in Mazandaran Province. Baladeh station has a maximum wind power density of about 51 W/m2 and wind speed of more than 4 m/s during 6 months of the year (especially in the warm months of June and July). Kojoor, Amirabad, Siahbisheh and Pol-e Sefid stations are in the next categories of wind power density in the province with 28, 25, 23 and 23 W/m2 respectively. Sari, Alasht, Gharakhil, Ramsar and Babolsar stations have the lowest wind power density at 10 m height with 4, 7, 7, 8 and 8 W/m2 respectively in the studied statistical period (2006-2017).
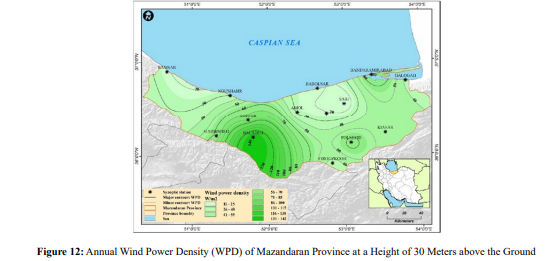
Zonation of wind power density of stations in Mazandaran Province at a height of 30 m above the ground (Figure 12) shows that Baladeh station has the highest value of wind power density (~140 W/m2) compared to the other stations in the province with wind speed more than 6 m/s in 7 months of the year. In addition, Kojoor, Pol-e Sefid, Amirabad and Siahbisheh stations have wind power density of 79, 70, 63 and 63 W/m2 respectively with more than 5 months of wind and speed more than 4 m/s in a year. On the other hand, Sari, Alasht, Gharakhil, Ramsar and Babolsar stations have wind power densities of 12, 20, 21, 22 and 23 W/m2 with wind speeds less than 3 m/s during most months of the year. From this point of view, they account for a relatively modest share of wind power generation from turbines in the province.
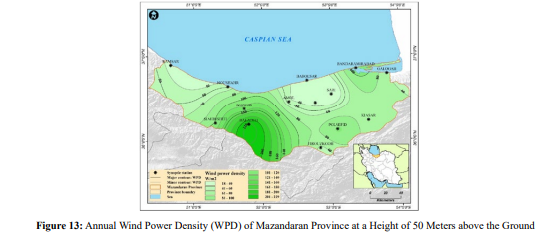
According to the map of wind power density at 50 m above the ground (Figure 13), Baladeh station has a wind power density of about 228 W/m2 with a wind speed of more than 5 m/s and the highest frequency of wind speed values in the range of 3 to 5 m/s. Baladeh station is in the second category (average) in terms of classification by turbine height and using the American Energy Union Wind Atlas. Moreover, the highest wind power density of up to 200 W/m2 is associated with the warm months of the year, which provide favorable conditions for turbine installation and power generation. Kojoor, Amirabad, Siahbisheh and Pol-e Sefid stations have wind power densities of 126, 113, 102 and 102 W/ m2, respectively with wind speeds of about 2 to 5 m/s. The lowest wind power densities are assigned to Sari, Alasht, Gharakhil, Ramsar and Babolsor stations with values of 19, 32, 33, 35 and 38 W/m2, respectively.
Wind Power Extraction
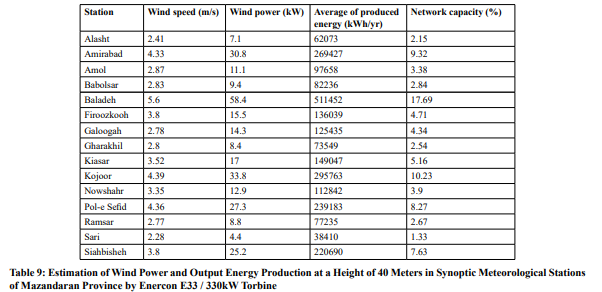
The amount of wind power that can be extracted by wind turbines depends not only on the speed and continuity of the wind but also on factors such as the efficiency of the turbine, the hub height, the rotor sweep height and blade radius. Currently, turbines with a capacity of 3 to 5 MW are available in the world market. However, transportation and installation of these turbines require the use of special equipment and infrastructure. The turbines installed in Iran with Vestas technology from Denmark have a height of 40 m and a speed range of 4 to 25 m/s. Table 8 shows the results of the calculations of extractable wind power at a height of 40 m at each of the synoptic meteorological stations in Mazandaran Province. Baladeh station has the highest percentage of electrical energy in the province with an average annual wind power of 58.4 kW, an annual produced electricity of about 511452 kWh/year and a network capacity of 17.7% (Table 9). Therefore, this area is a suitable place for the installation and construction of wind turbines in Mazandaran Province. Kojoor, Amirabad, Pol-e Sefid and Siahbisheh stations belong to the next categories of wind power potential. Due to lower wind speeds, Sari, Alasht, Gharakhil, Ramsar and Babolsar stations are not considered as suitable places for wind power extraction. Figure 14 shows the map of annual produced electrical energy of the stations in Mazandaran Province at a height of 40 m above the ground [42,43].

Topography Eeffect on Wind Variables
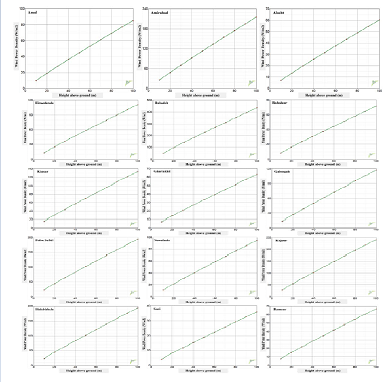
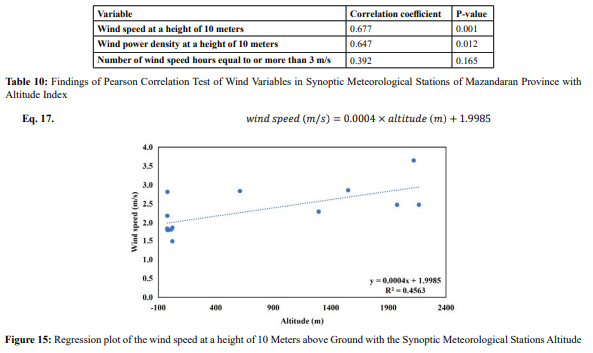
To investigate the influence of topography on wind variables such as wind speed, continuity, and wind power density, the relationship between height and slope indicators was evaluated with each of the aforementioned factors. Table 10 shows the Pearson correlation coefficient between wind variables and topographic indicators. The correlation coefficient between wind speed and altitude above sea level was 0.677, indicating a 95 percent positive correlation (P-value 0.05). Accordingly, as the altitude of the meteorological stations in the province above sea level increases, the wind speed increases at a height of 10 meters above the ground. Considering this correlation coefficient, the effect of altitude on the change of wind speed is shown in equation 17 and Figure 15.
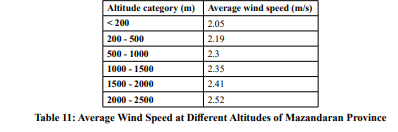
Examination of the spatial distribution of wind speed at different altitudes shows that as the altitude increases, the average wind speed also increases. This increase results in the average wind speed increasing from 2.05 m/s at altitudes less than 200 m to 2.52 m/s at altitude 2500 m. The general trend of increase in wind speed with increasing altitude in Mazandaran Province is shown in Table 11.
The correlation coefficient between wind power density and altitude is 0.647, indicating 95% positive correlation (P-value 0.05). Thus, like wind speed, wind power density also increases with by increasing the altitude. Considering this correlation coefficient, equation 18 and Figure 16 show the influence of altitude variations on wind power density at the stations in Mazandaran Province. However, due to a P-value greater than 0.05, the correlation between wind hour continuity with a speed 3 m/s and more was not significant at 95% level. Therefore, changes in altitude have no significance effect on the continuity of wind hours.
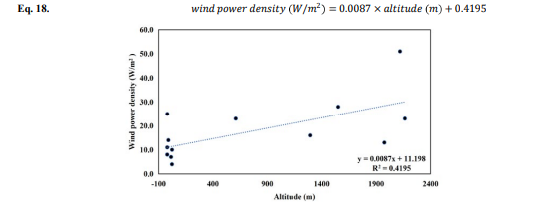
Table 12 shows the correlation coefficients of the wind speed variable, continuity of wind hours with speeds greater than 3 m/s, and wind power density with the slope index. According to P-values greater than 0.05, none of the wind variables is correlated with the slope index. Therefore, changes in the slope values have no noticeable effect on the wind variables and the correlation between them cannot be investigated.
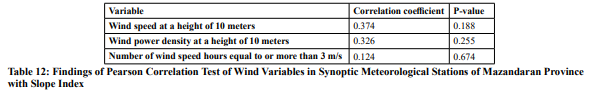
Table 13 shows the correlation coefficients of the wind speed variables, the continuity of wind hours with speeds greater than 3 m/s and the wind power density with the hillslope aspect index. After P-values greater than 0.05, among the wind variables, only the number of hours of wind with speeds greater than 3 m/s shows a strong positive correlation with the hillslope aspect. Thus, changes in the aspect of hillslopes have a discernible effect on the continuity of wind hours with speeds greater than 3 m/s at the 95% confidence level (P-value = 0.039), indicating that the hillslope aspect variable affects the number of wind hours with high-speeds in the region.
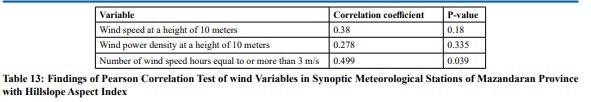
Considering this correlation coefficient, the effect of the hillslope aspect on the continuity variations of the number of wind hours with speeds greater than 3 m/s at the stations of Mazandaran Province is shown in equation 19 and Figure 17. This effect results in the maximum number of wind hours with speeds greater than 3 m/s occurring in the southwestern hillslopes with 2950 hours. The southern and southeastern hillslopes, with 2897 and 2740 hours, respectively, are in the next categories with the highest number of wind hours with the minimum suitable speed threshold for wind turbine operation and installation. Hillslopes with no direction (flat) and those with northwestern direction, with 2336 and 2628 hours, respectively, have the least wind speeds greater than 3 m/s, (Table 14). The correlation between the wind speed and density variables with the hillslope aspect index cannot be investigated because there is no meaningful correlation between them.

Conclusion
Among renewable energy sources, the use of solar and wind energy seems to be more economical and cost-benefit in Iran. Due to the high cost of converting solar rays into electrical energy, several countries around the world, including Iran, have turned their attention to wind energy. Given the enormous resources needed to generate one kilowatt of electricity, the question is what should be done to reduce consumption and provide cheaper energy. Wind energy is one of the most cost-benefit renewable energy sources for power generation, which is not only polluting the environment and being abundant and permanent, but also has the lowest price fluctuations. The objective of the study was to determine the spatial capability of wind power in Mazandaran Province, with emphasis on topography. With the increase of altitude of meteorological stations of the province, the wind speed and power density of the station increases at a height of 10 meters above the ground. Although there is no significant correlation between the number of wind speed hours equal to or more than 3 m/s and it cannot be assumed that variations in altitude affect wind hour continuity values. Examination of the spatial distribution of wind speed with increasing the altitude showed that the average wind speed increases from 2.05 m/s in the altitude less than 200 m to 2.52 m/s in the altitude 2500 m. The effect of the hillslope aspect on the changes in the number of the continuity wind hours with a speed greater than 3 m/s in Mazandaran Province, is such that its maximum value occurs in southwestern hillslope with 2950 hours. This may be influenced by the general pattern of air current in the region, where west and southwest winds are considered to be the prevailing winds at all seasons of the year and during most months of the year. The western, coastal strip, as well as the plain areas of Mazandaran Province have poor wind continuity conditions, which are a minimum threshold for wind turbine installation. The foothills and highlands, on the other hand, are in a relatively favorable position in terms of the persistence of winds with speeds of 3 m/s or more. The mountainous and highland areas in Noor Township are generally considered the best locations for wind turbine installation. The maximum wind speed occurs at different heights above the ground, in the southern and high parts of Noor, Amol, Nowshahr, Savadkooh and to some extent in Chaloos, with the highest wind speed in the southern parts of Noor. The plains and coastal areas of Mazandaran Province, particularly the townships of Jooybar, Babolsar, Mahmoudabad, Sari, Ghaemshahr, the north of Savadkooh, Babol, Amol and the western parts of Ramsar and Tonekabon, and the eastern parts of Behshahr and Neka, have the lowest average annual wind speed.
References
1. Yue, C. D., & Wang, S. S. (2006). GIS-based evaluation of multifarious local renewable energy sources: a case study of the Chigu area of southwestern Taiwan. Energy Policy, 34(6), 730-742.
2. Strantzali, E., & Aravossis, K. (2016). Decision making in renewable energy investments: A review. Renewable and sustainable energy reviews, 55, 885-898.
3. Baban, S. M., & Parry, T. (2001). Developing and applying a GIS-assisted approach to locating wind farms in the UK. Renewable energy, 24(1), 59-71.
4. Kenisarin, M., & Mahkamov, K. (2007). Solar energy storage using phase change materials. Renewable and sustainable energy reviews, 11(9), 1913-1965.
5. Caralis, G., Perivolaris, Y., Rados, K., & Zervos, A. (2008). On the effect of spatial dispersion of wind power plants on the wind energy capacity credit in Greece. Environmental Research Letters, 3(1), 015003.
6. Ajayi, O. O., Fagbenle, R. O., Katende, J., & Okeniyi, J. O. (2011). Availability of wind energy resource potential for power generation at Jos, Nigeria. Frontiers in Energy, 5, 376- 385.
7. Chong, Z. R., Yang, S. H. B., Babu, P., Linga, P., & Li, X. S. (2016). Review of natural gas hydrates as an energy resource: Prospects and challenges. Applied energy, 162, 1633-1652.
8. Gandomkar, A. (2010). Determining the horizontal wind direction of Sistan using cluster analysis. Physical Geography Journal, 10, 67-76.
9. Heydari M (2009) Solar power plant zoning in Iran. Journal of Heat Converters, 2(17): 60-71.
10. Esfandiari, A., Rangzi, K., Saberi, A., & hattahi Moghadam, M. (2011). Potential measurement of solar power plants construction by studying climatic parameters in Khuzestan province using GIS. In Geomatic National Conference, Tehran, Iran.[In Persian].
11. Entezari, A., Amir Ahmadi, A., Erfani, A., & Borzuie, A. (2012). Evaluation of wind energy potential and feasibility of wind power plant construction in Sabzevar. geographical studies of arid regions. Geographical Studies of Arid Regions, 3(9-10), 33-46.
12. Secretariat, I. P. C. C. (2013). Intergovernmental Panel on Climate Change (IPCC). Retrieved ΔεκÎμβριος, 3, 2015.
13. REN21 (Global Status Report) 2015. Annual reporting on renewables: ten years of excellence. Renewable Energy Policy Network for the 21st Century.
14. Partovi A. 2012. New energies: energy for a sustainable future. First Edition, Institute of Printing and Publishing, University of Tehran, Iran, 599 p.
15. Rezaee Banafsheh, M., Jahanbakhsh, S., Dinpashoh, Y., & Esmaeilpour, M. (2014). Feasibility Assessment for Use of Wind Energy in Ardebil and Zanjan Provinces. Physical Geography Research, 46(3), 261-274.
16. Ahmadi, M., & Dadashi Roudbari, A. (2015). Feasibility study of wind power plants with AHP method in Semnan region. Journal of the Iranian Geographical Association, 13, 81-98.
17. Maryanaji, Z., Hosseini, S. A., & Abbasi, H. (2018). Zoning and forecasting of the wind energy potential in Hamadan Province using Geographic Information System. Scientific-Research Quarterly of Geographical Data (SEPEHR), 26(104), 186- 196.
18. Ilkiliç, C., & Aydin, H. (2015). Wind power potential and usage in the coastal regions of Turkey. Renewable and Sustainable Energy Reviews, 44, 78-86.
19. Allouhi, A., Zamzoum, O., Islam, M. R., Saidur, R., Kousksou, T., Jamil, A., & Derouich, A. (2017). Evaluation of wind energy potential in Morocco's coastal regions. Renewable and Sustainable Energy Reviews, 72, 311-324.
20. Kruyt, B., Dujardin, J., & Lehning, M. (2018). Improvement of wind power assessment in complex terrain: the case of COSMO-1 in the Swiss Alps. Frontiers in Energy Research, 6, 102.
21. Chen, W., Castruccio, S., Genton, M. G., & Crippa, P. (2018). Current and future estimates of wind energy potential over Saudi Arabia. Journal of Geophysical Research: Atmospheres, 123(12), 6443-6459.
22. Salam M.A, Yazdani M.G, Rahman Q.M (2018) Investigation of wind energy potentials in Brunei Darussalam. Frontiers in Energy.
23. Kim, Y. H., & Lim, H. C. (2017). Effect of island topography and surface roughness on the estimation of annual energy production of offshore wind farms. Renewable Energy, 103, 106-114.
24. Baker, L., & Sovacool, B. K. (2017). The political economy of technological capabilities and global production networks in South Africa's wind and solar photovoltaic (PV) industries. Political Geography, 60, 1-12.
25. Shahriari, M., & Blumsack, S. (2017). Scaling of wind energy variability over space and time. Applied Energy, 195, 572- 585.
26. Byrne, R., Astolfi, D., Castellani, F., & Hewitt, N. J. (2020). A study of wind turbine performance decline with age through operation data analysis. Energies, 13(8), 2086.
27. Promsen, W., Janjai, S., & Tantalechon, T. (2014). An analysis of wind energy potential of Kampot Province, Southern Cambodia. Energy Procedia, 52, 633-641.
28. Aien, M., Rashidinejad, M., & Fotuhi-Firuzabad, M. (2014). On possibilistic and probabilistic uncertainty assessment of power flow problem: A review and a new approach. Renewable and Sustainable energy reviews, 37, 883-895.
29. Bairamvand, R., Motevalli, S., Janbaz Ghobadi, G., & Derafshi, K. (2022). Wind power plants site selection using Boolean model and ArcGIS (Case study: Mazandaran Province). Physical Geography Quarterly, 15(57), 91-108.
30. Whiteman, C. D. (2000). Mountain meteorology: fundamentals and applications. Oxford University Press.
31. Azizi G, Farid Mojtahedi N, Shaebanzadeh F, Negah S, Abed H (2017) Wind behavior in west Alborz stations influenced by environmental implications. Geography and Planning, 21, 62: 203-222. https://dx.doi.org/3-6.
32. Janbazghobadi, G. (2020). Potentiometric analysis of wind energy to determine the optimum location for wind turbines in Mazandaran province. Geographical Planning of Space, 9(34), 209-224.
33. Negash, T., Möllerström, E., & Ottermo, F. (2020). An assessment of wind energy potential for the three topographic regions of Eritrea. Energies, 13(7), 1846.
34. Rehman, S., Natarajan, N., Vasudevan, M., & Alhems, L. M. (2020). Assessment of wind energy potential across varying topographical features of Tamil Nadu, India. Energy Exploration & Exploitation, 38(1), 175-200.
35. Molanejad, M., Soltani, M., Ranjbar SaadatAbadi, A., Babu, C. A., Sohrabi, M., & Martin, M. V. (2015). Climatology ofCyclones and TheirTracking over Southern Coasts ofCaspian Sea. International Journal of Environmental Research, 9(1), 117-132.
36. Azizi, Q., Masoumpoor, J., Khoush-Akhlaq, F., Ranjbar, A., & Zavar, R. (2010). Numerical Simulation of Sea Breeze on the Southern Shores of Caspian Sea on the basis of Climate Characteristics. Journal of Climatology, 1(2), 21-38.
37. Ghaffari, P., & Chegini, V. (2010). Acoustic Doppler Current Profiler observations in the southern Caspian Sea: shelf currents and flow field off Feridoonkenar Bay, Iran. Ocean Science, 6(3), 737-748.
38. KARIMI, M., AZIZI, G., SHAMSI, P. A. A., & REZAEI, M. A. L. (2016). DYNAMIC SIMULATION OF THE ALBORZ MOUNTAIN IN SPREAD ANDTHICKNESS OF SEA BREEZE ON THE SOUTHERN COAST OF THE CASPIAN SEA.
39. Masoud M. Pawlowicz R (2020) Currents generated by the sea breeze in the southern Caspian Sea. Ocean Sceince, 18: 675-692.
40. Akpinar, E. K., & Akpinar, S. (2005). A statistical analysis of wind speed data used in installation of wind energy conversion systems. Energy conversion and management, 46(4), 515-532.
41. Celik, A. N. (2004). A statistical analysis of wind power density based on the Weibull and Rayleigh models at the southern region of Turkey. Renewable energy, 29(4), 593-604.
42. Bairamvand, R., Motevalli, S., Janbaz Ghobadi, G. R., & Derafshi, K. (2022). Potential measurement and estimation of wind power characteristics for energy generation (Synoptic stations of Mazandaran Province). Journal of Geography and Environmental Studies, 11(43), 6-23.
43. Bairamvand, R., Motevalli, S., Janbaz Ghobadi, G. R., & Derafshi, K. (2022). Evaluated the location of wind power plants based on spatial assessment of environmental factors Mazandaran Province, Iran. Physical Geography Research, 54(2), 203-225.
44. Mohammadi, H., Rostami, S., Taghavi, F., & Shamsipoor, A. (2012). Wind energy potential measurement in Kermanshah Province. Physical Geography Quarterly Journal, 44(2), 19- 32.
45. Mojarrad F, Hemmati S (2013) Evaluation of wind energy capabilities in Kermanshah and Kurdistan provinces. Applied Research in Geographical Sciences, 13(29): 137-157.